Configuring Data Display on Scala2
You can display measurements taken by the sensors (e.g. distances between doors, depth, pitch and roll...) on pages in Scala2.
About this task
- Spread Master / Spread Slave / Spread Clump for Spread sensors.
- Door Sounder
The title is followed by the node where the sensor was placed when added to the system. Data displayed (e.g. spread distances, pitch & roll) depends on the firmware installed.
Displaying Doors 3D View
Before you begin
Procedure
-
From the top left corner of the screen,
click Menu
 > Customize and enter the password eureka.
-
From the top toolbar, click the add icon
 .
.
-
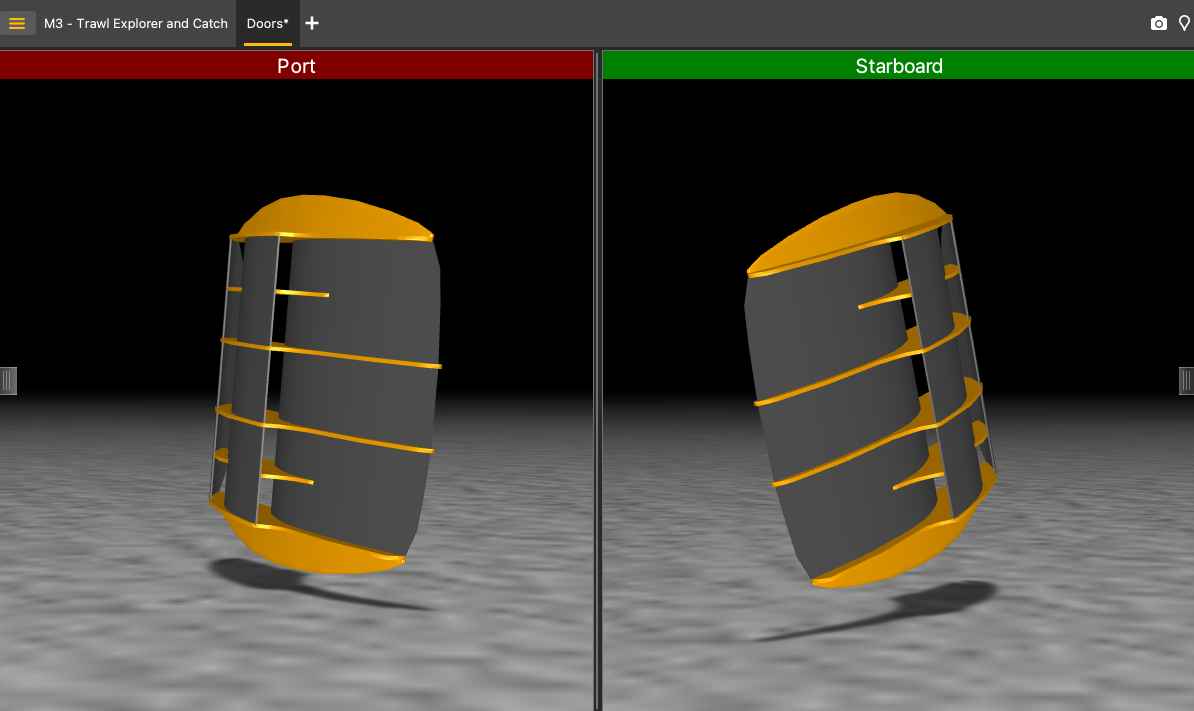
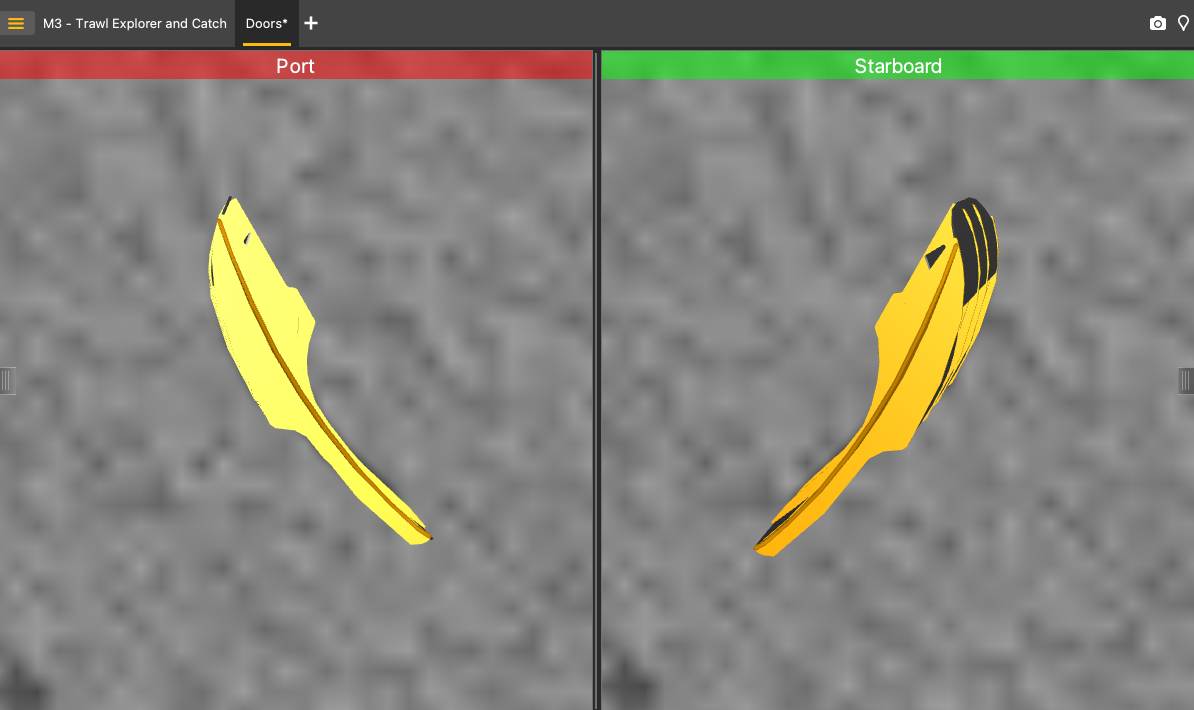
From Standard Pages, click Trawl Doors
(Front) to see doors from vessel or Trawl Doors
(Back) to see doors from trawl.
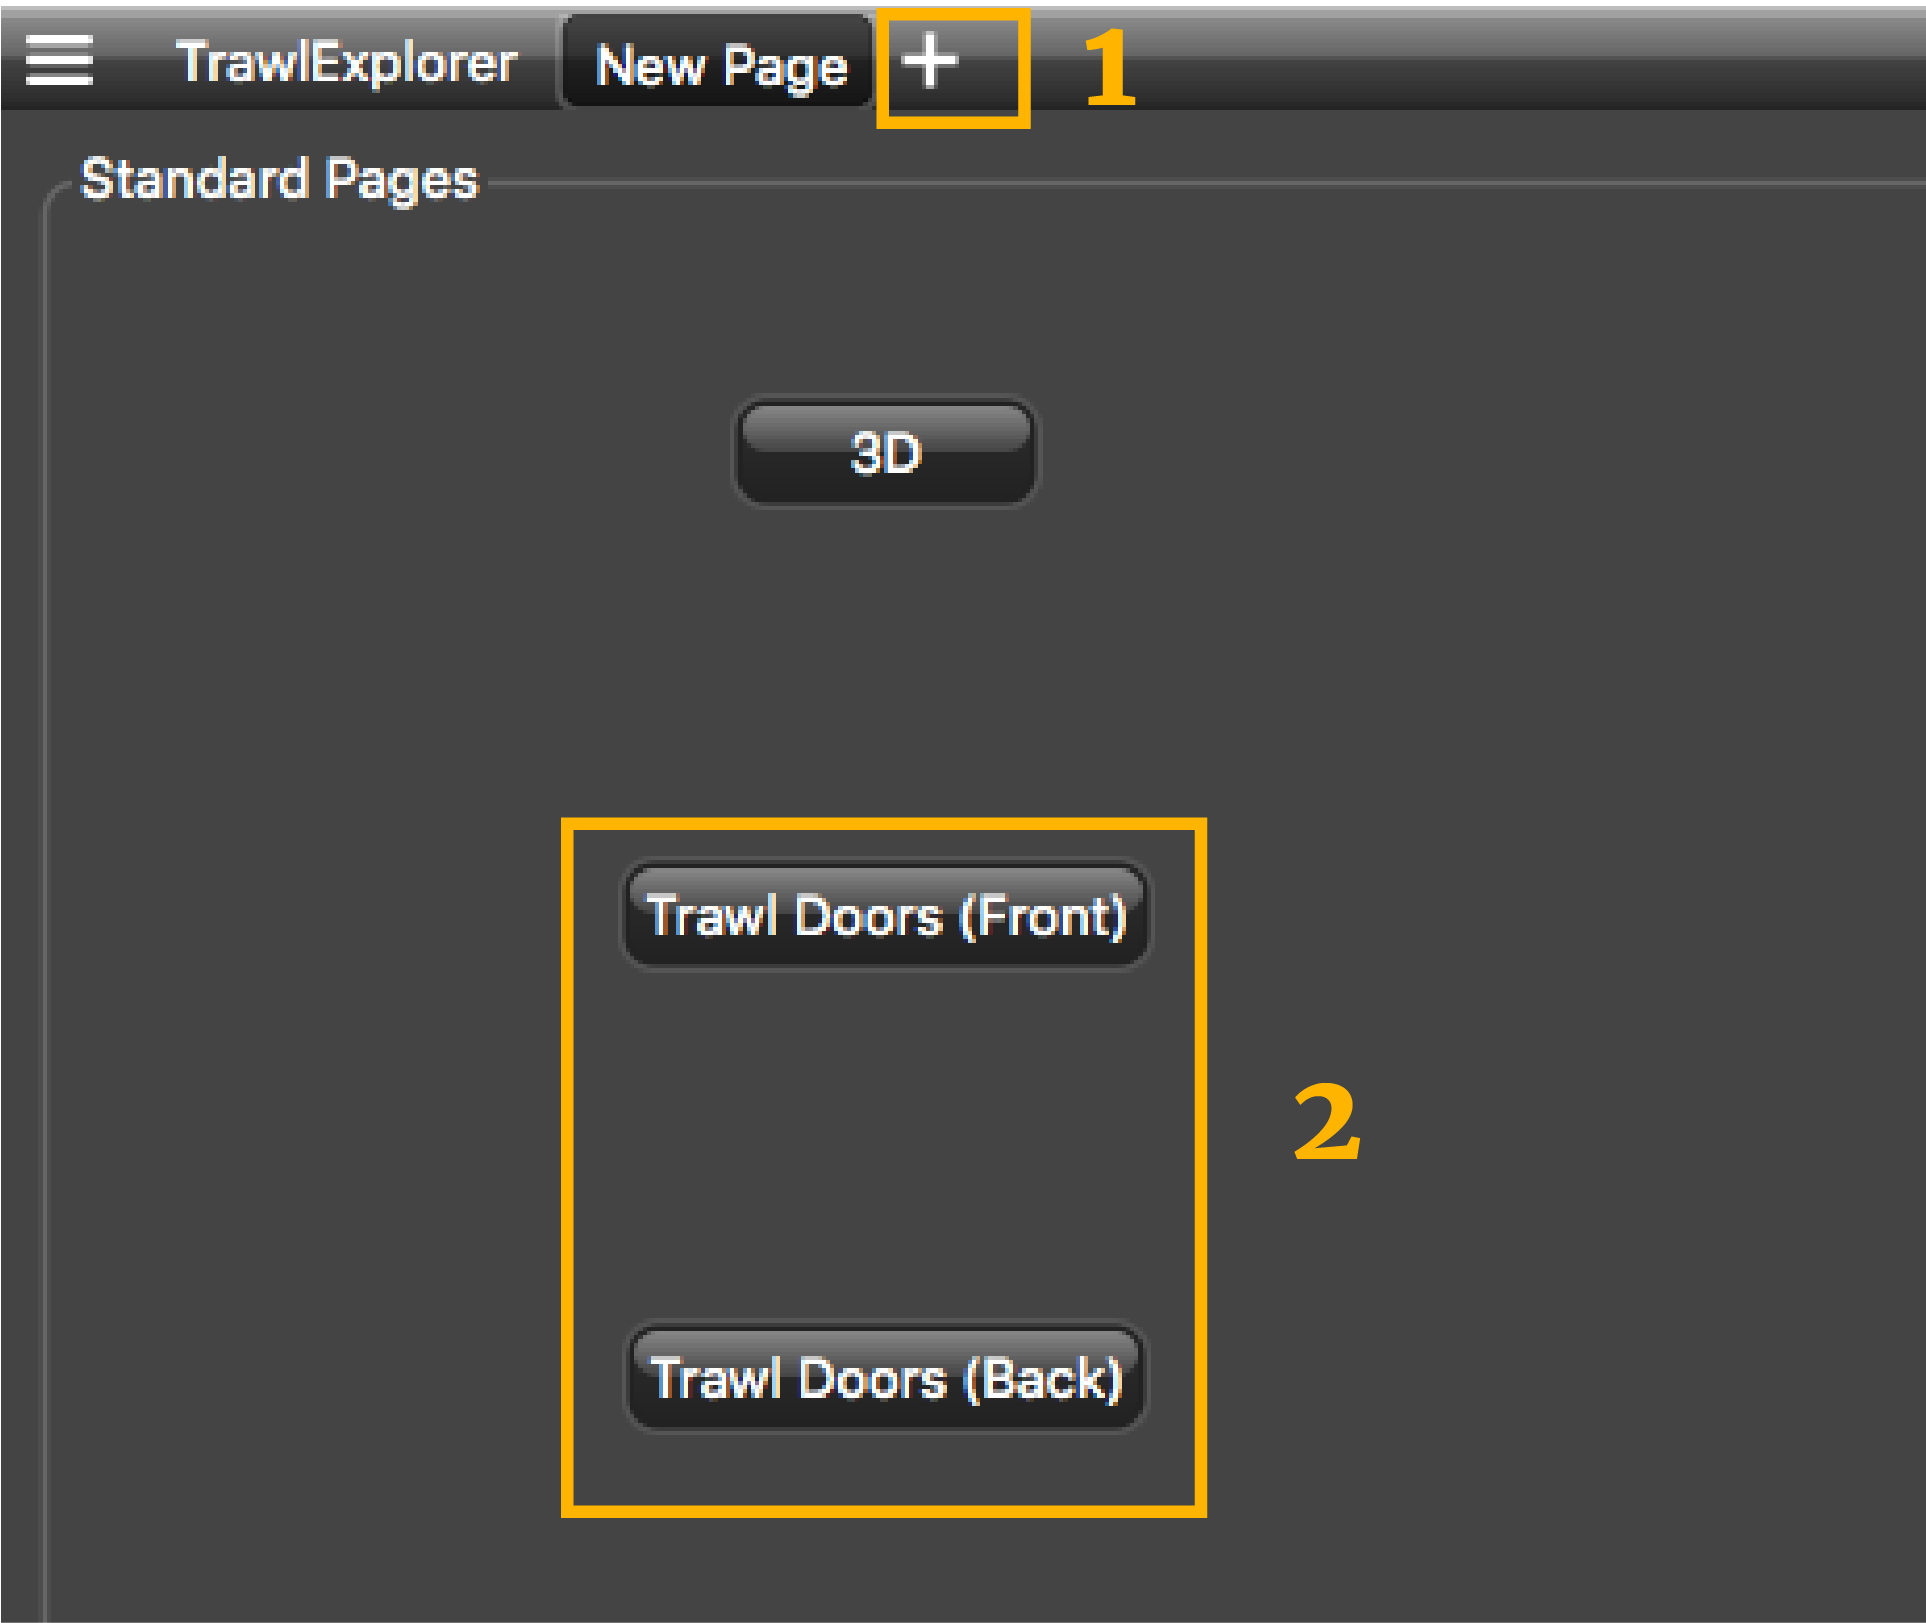
Port and starboard trawl doors are displayed.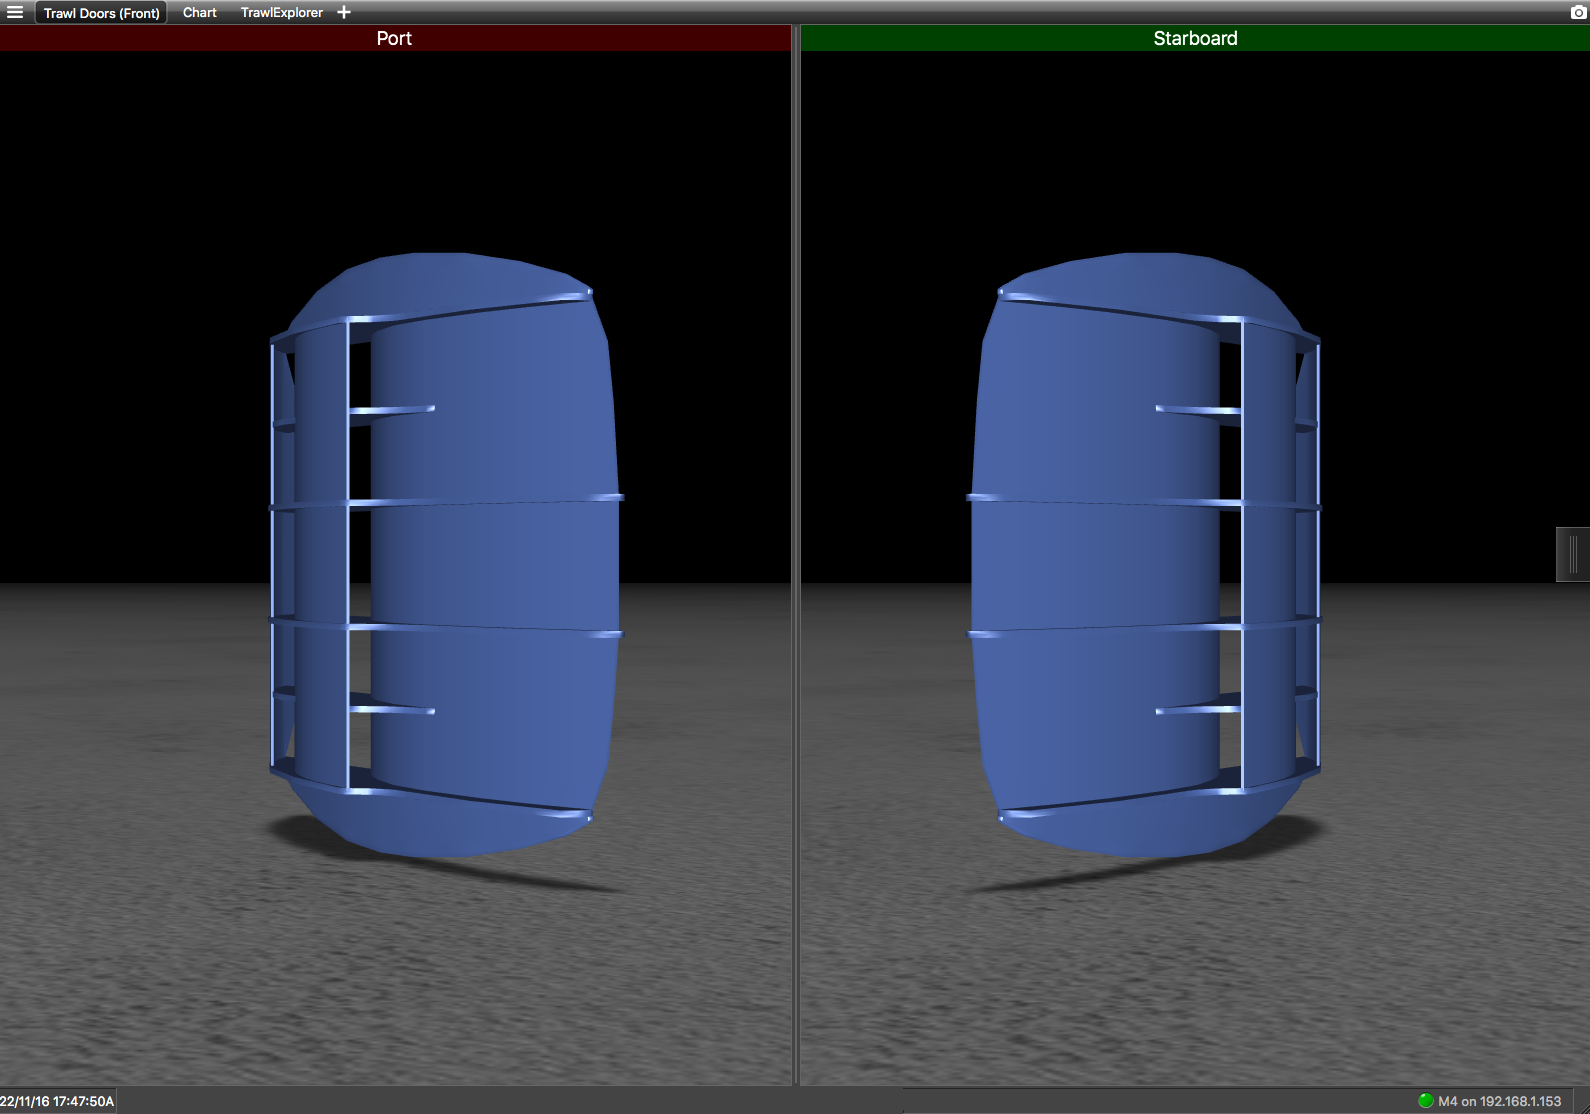
-
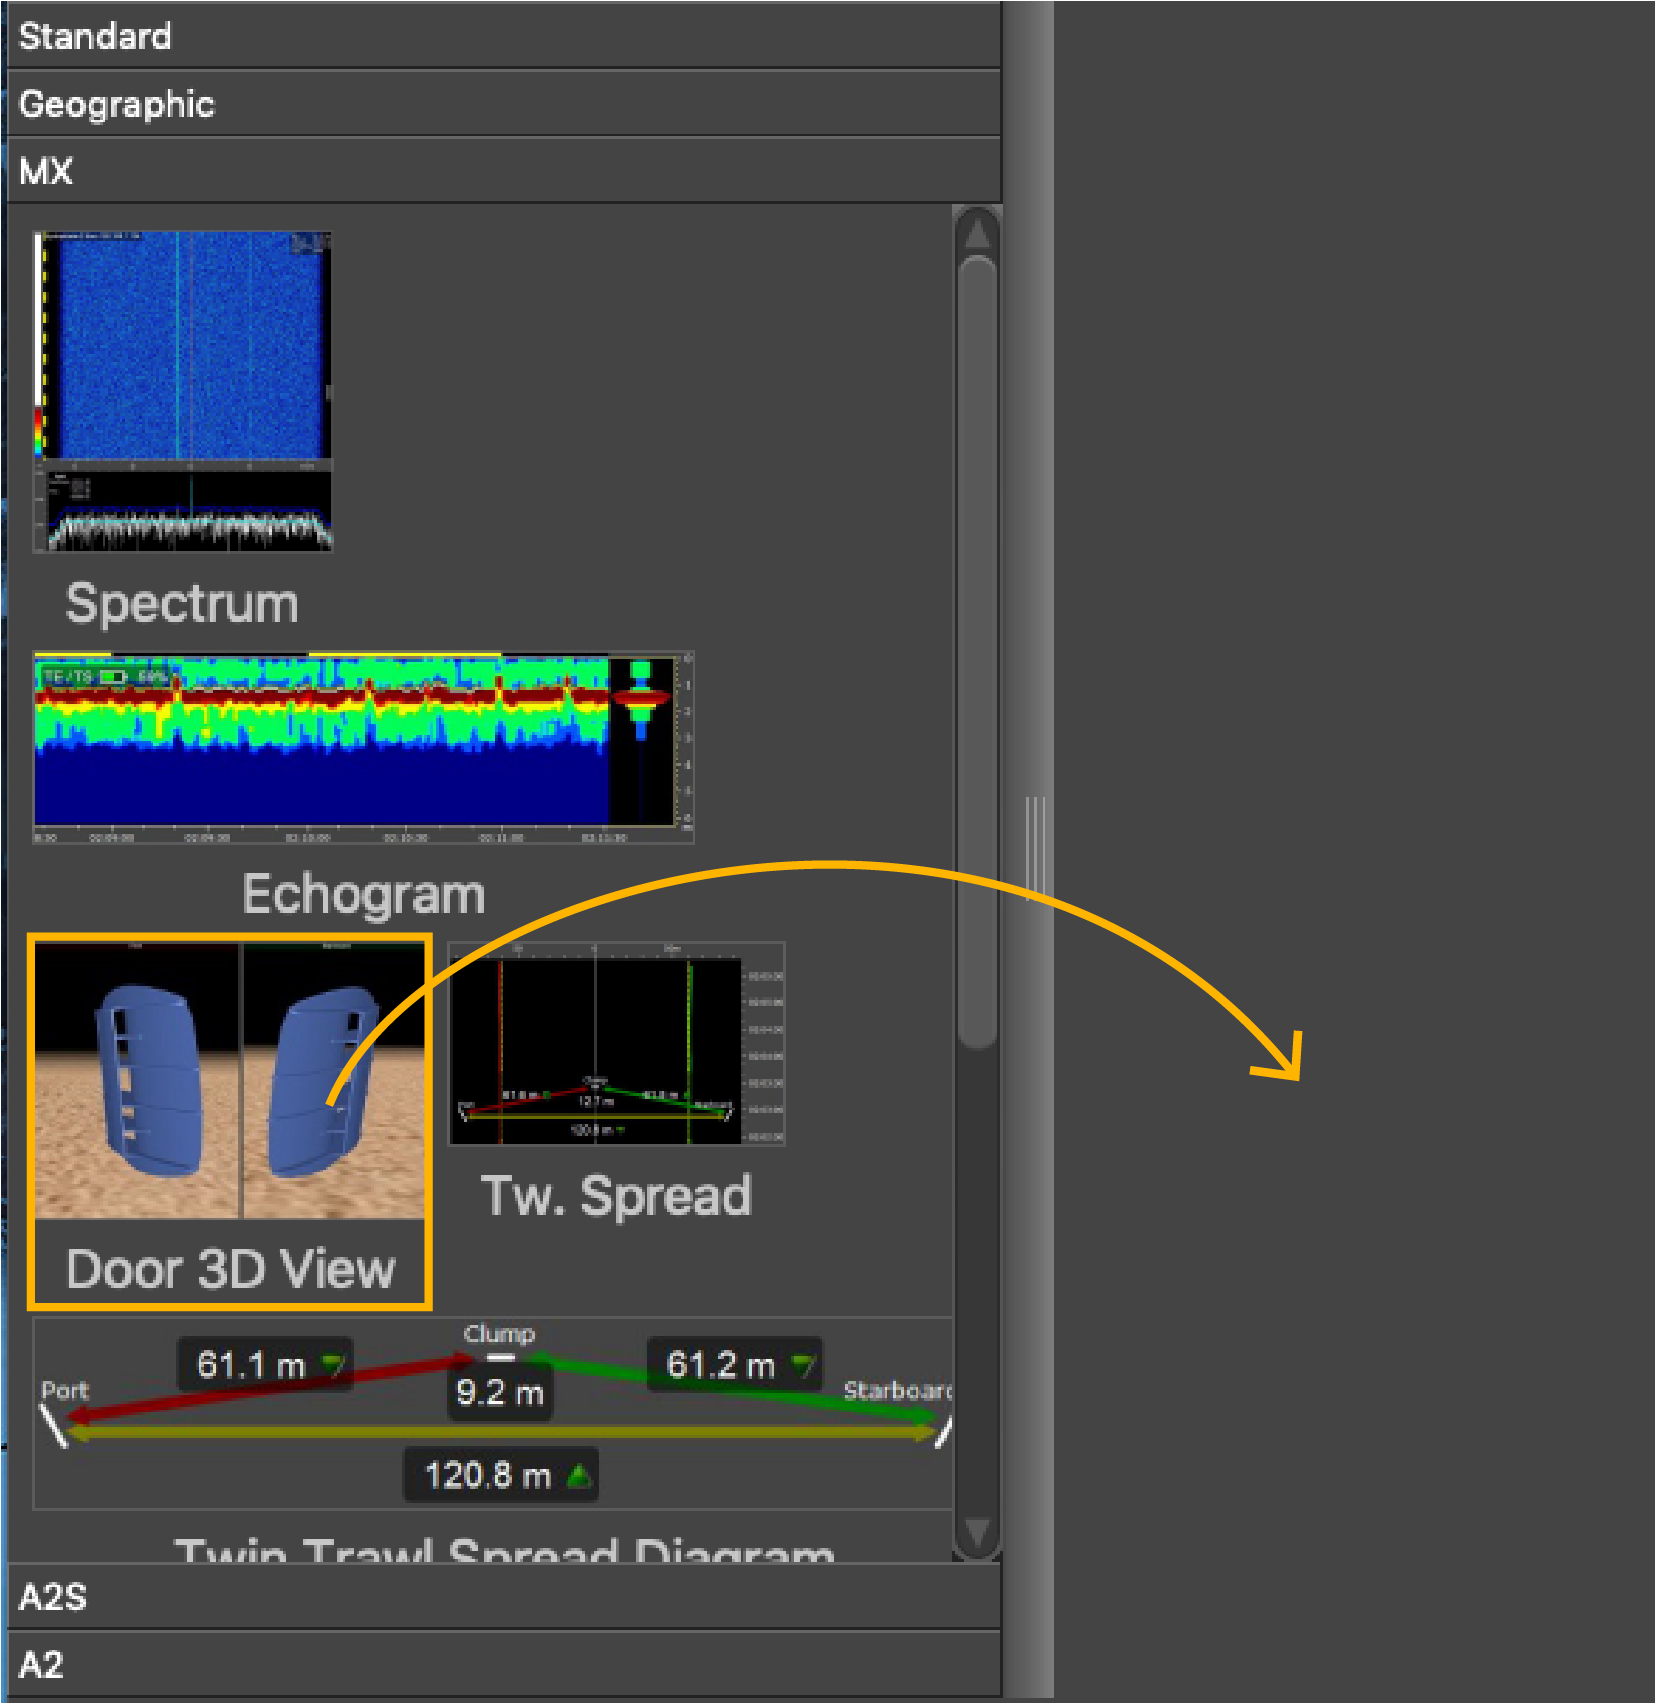
Open the customize panel, then go to Mx and drag Door 3D View to the page.
-
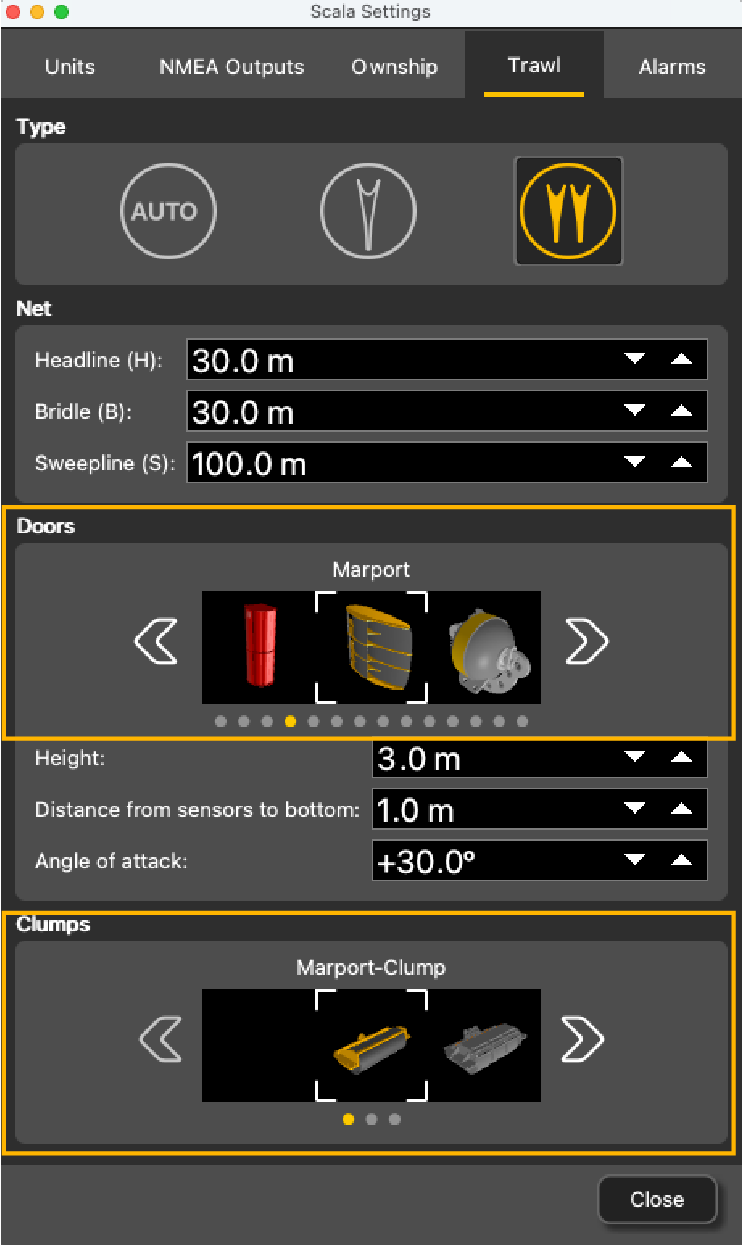
To change the door or clump model:
-
From the top left corner, click Menu
 > Settings.
-
Click the Trawl tab and
select the models of doors and clumps from the lists, using left and
right arrows.
-
From the top left corner, click Menu
-
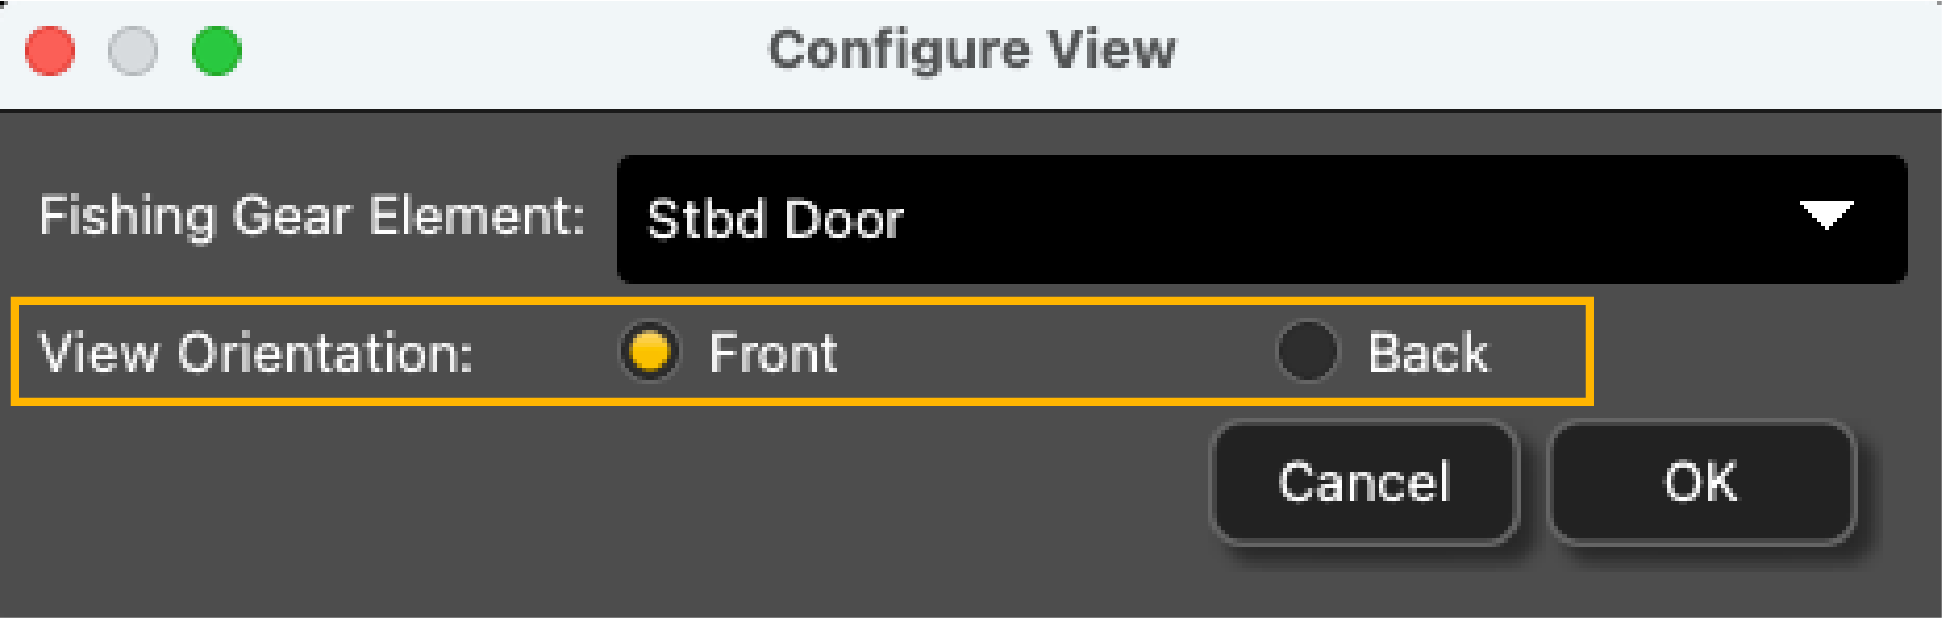
You can also change the viewing angle: looking from the
trawl toward the vessel (front), or from the vessel toward the trawl (back).
-
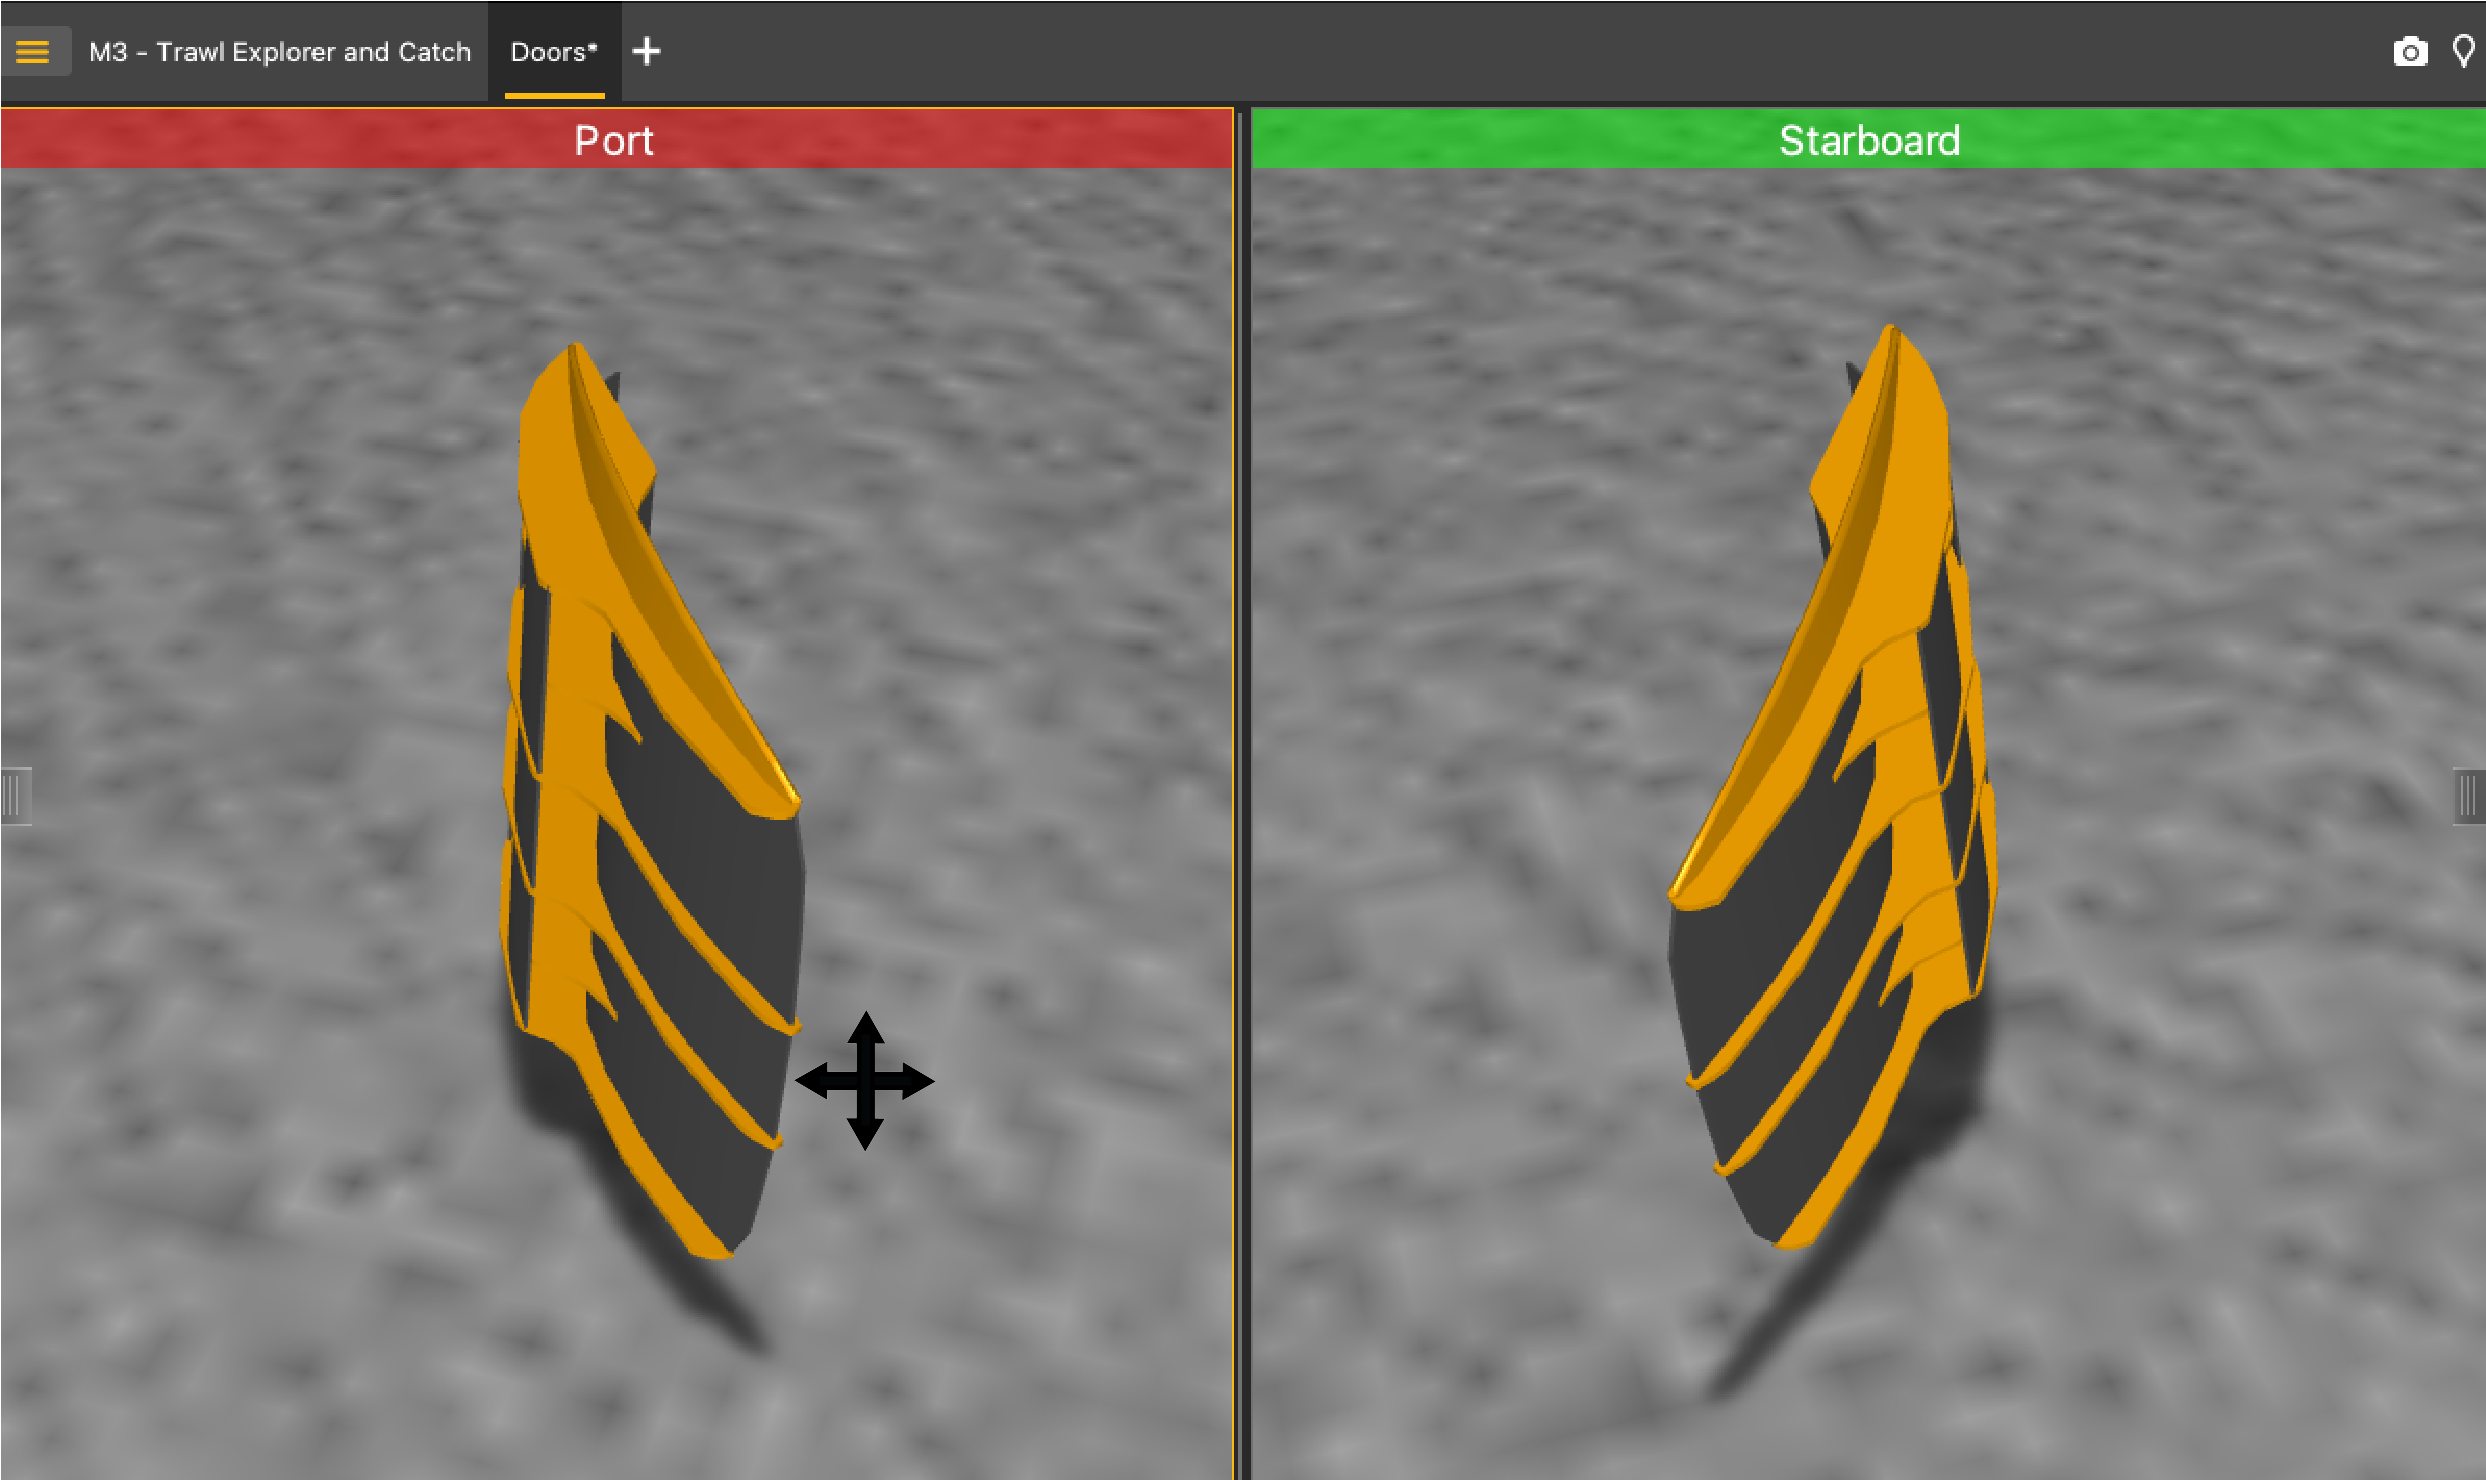
To change the view angle of the door, right-click the 3D view and choose:
- Horizontal
Camera to see the doors from
the front.
- Or back.
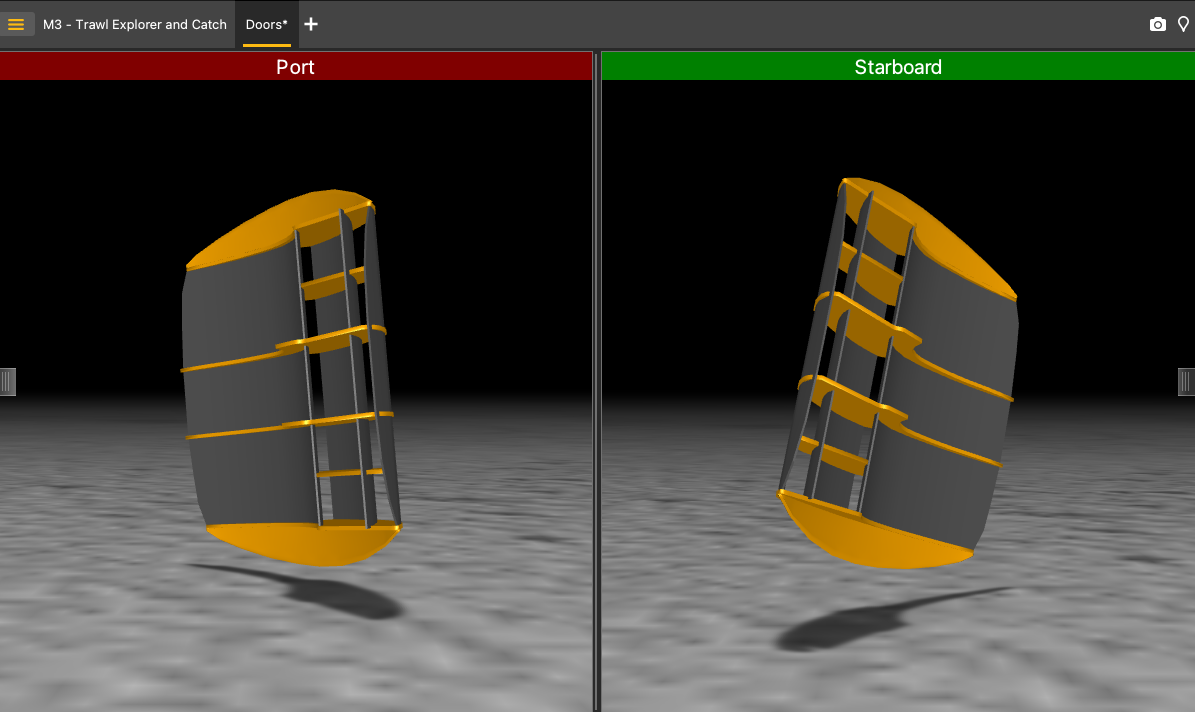
- Vertical Camera to see the doors from
above.
- Free Camera to adjust the viewing
angle yourself, by clicking and dragging the 3D doors.
- Horizontal
Camera to see the doors from
the front.
- To display the ground, right-click the 3D view and select Display Ground. You should leave the ground displayed in order to see if the doors are touching it.
-
Deactivate the Customize mode when you have finished
customizing pages: click Menu > Customize again.
Displaying Single Trawl Spread
Before you begin
Procedure
-
From the top left corner of the screen, click Menu > Customize and enter the password
eureka.
-
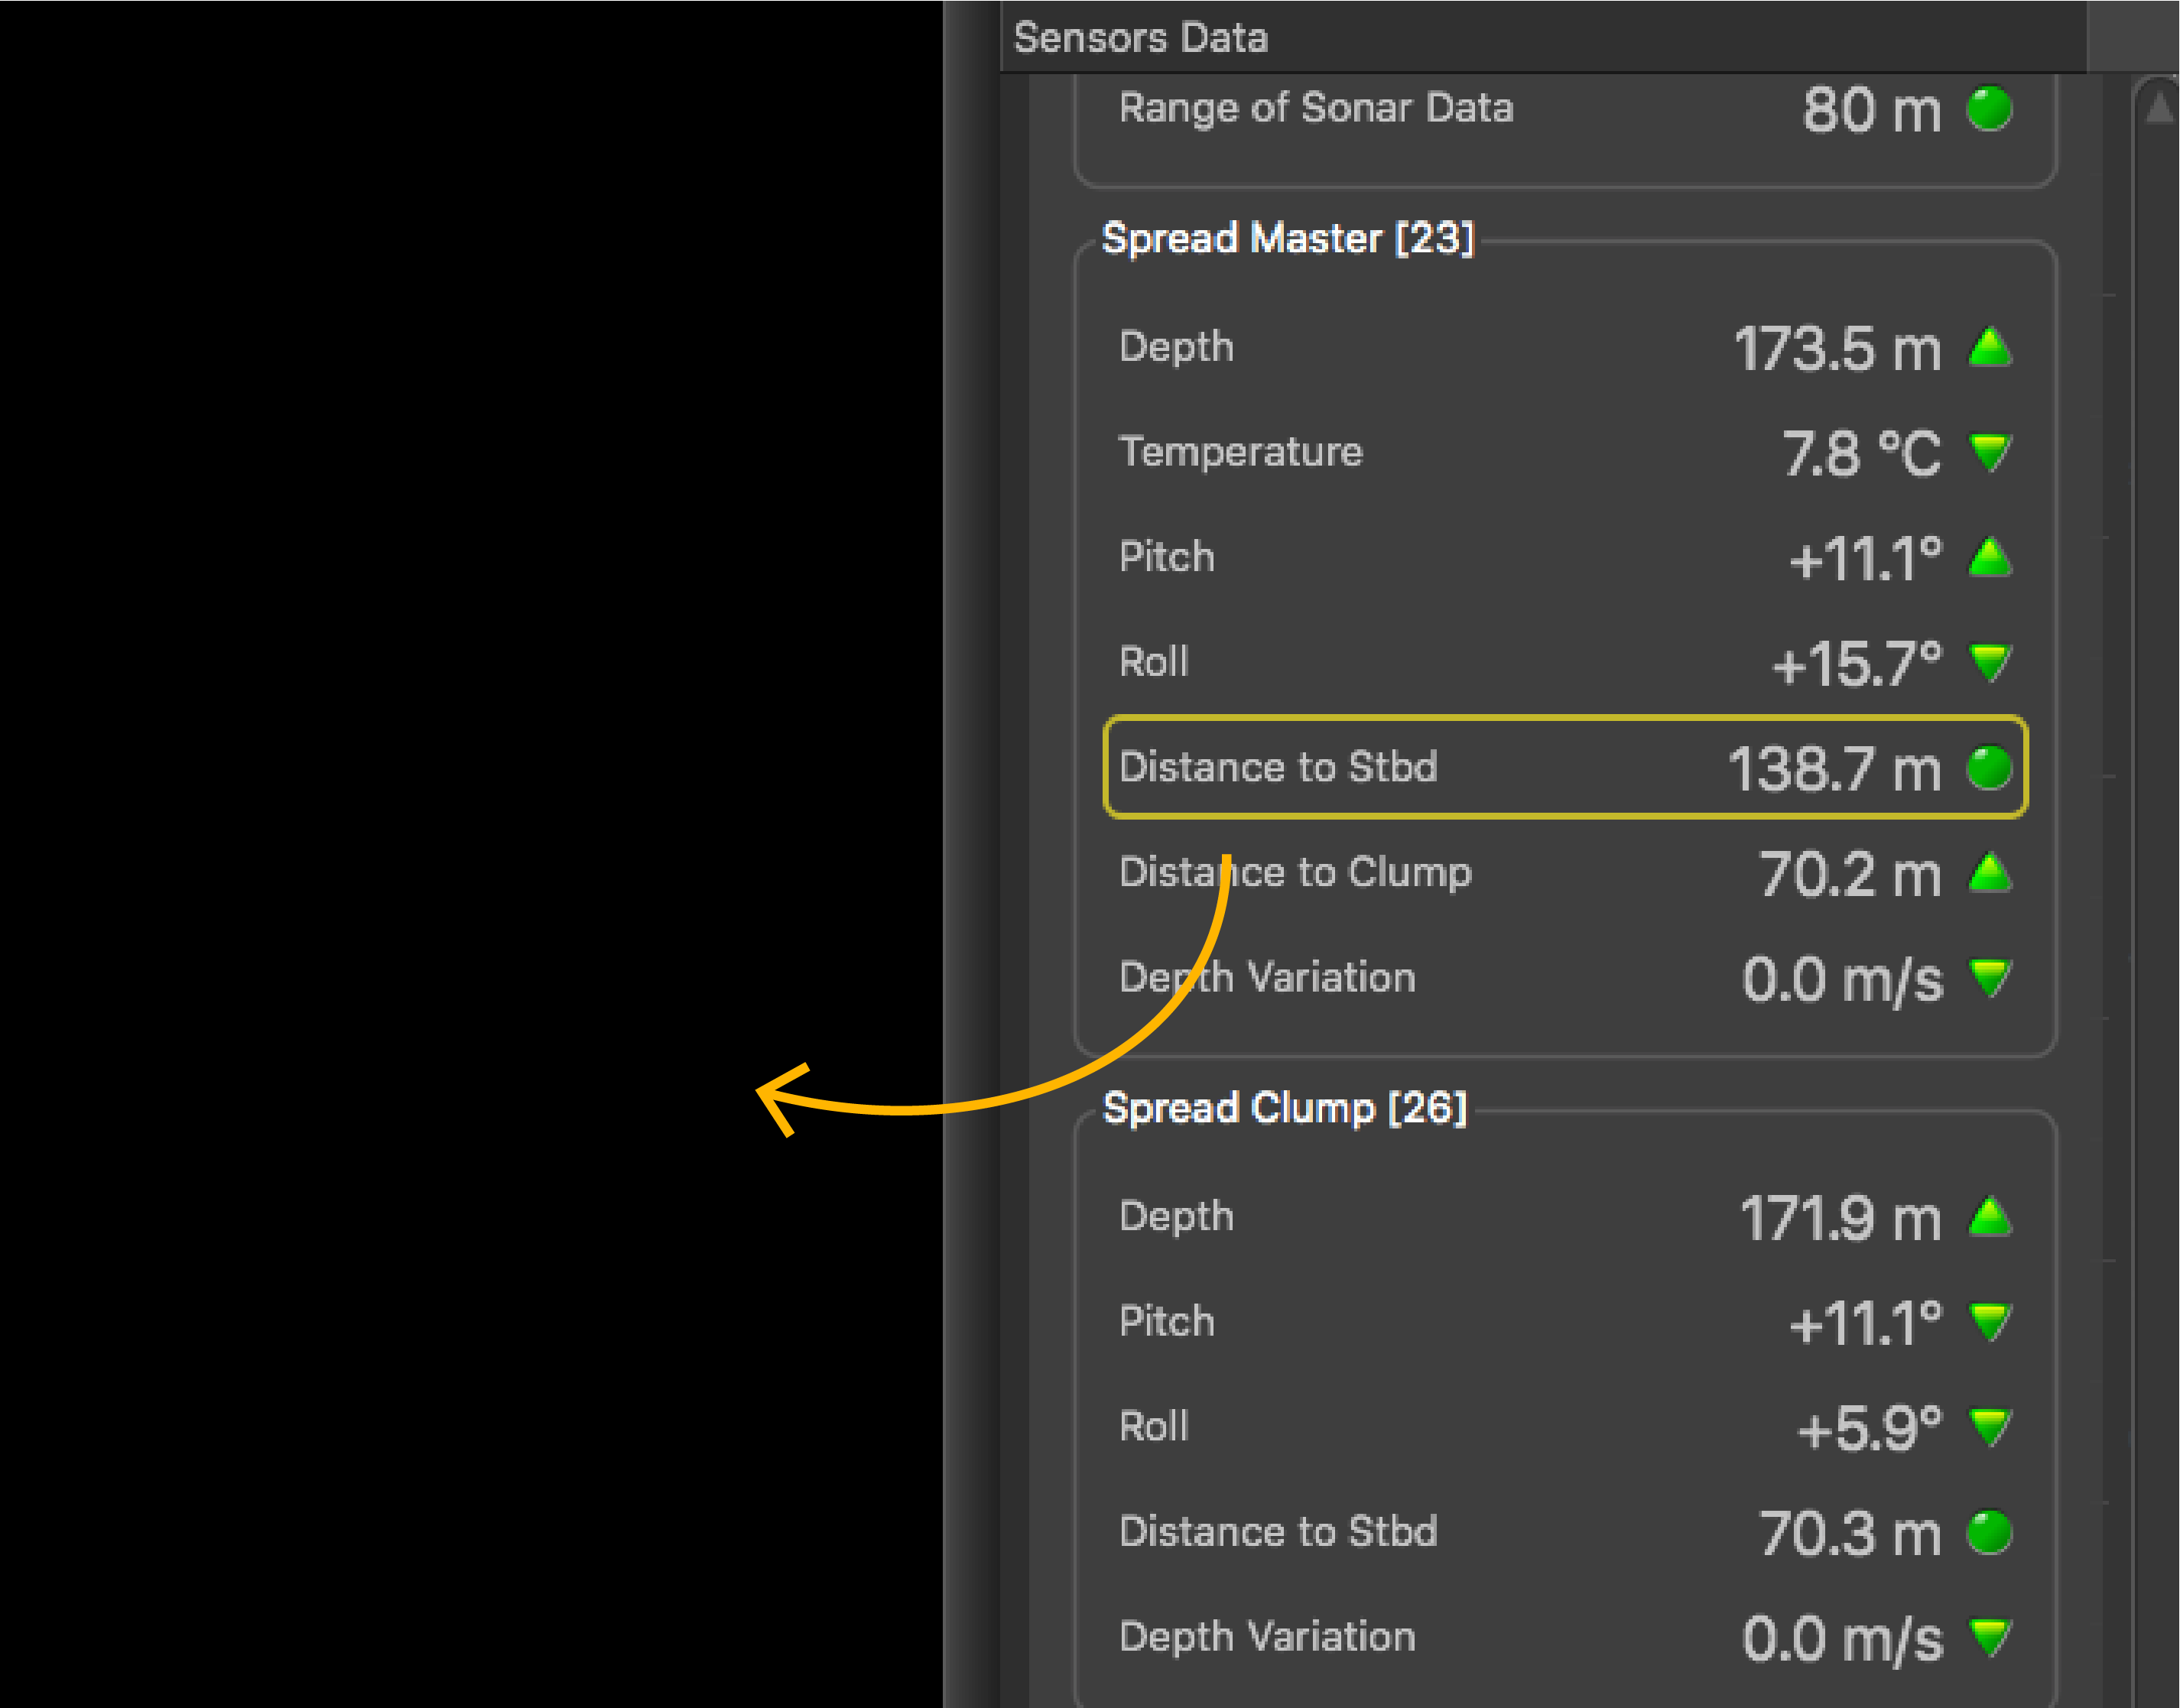
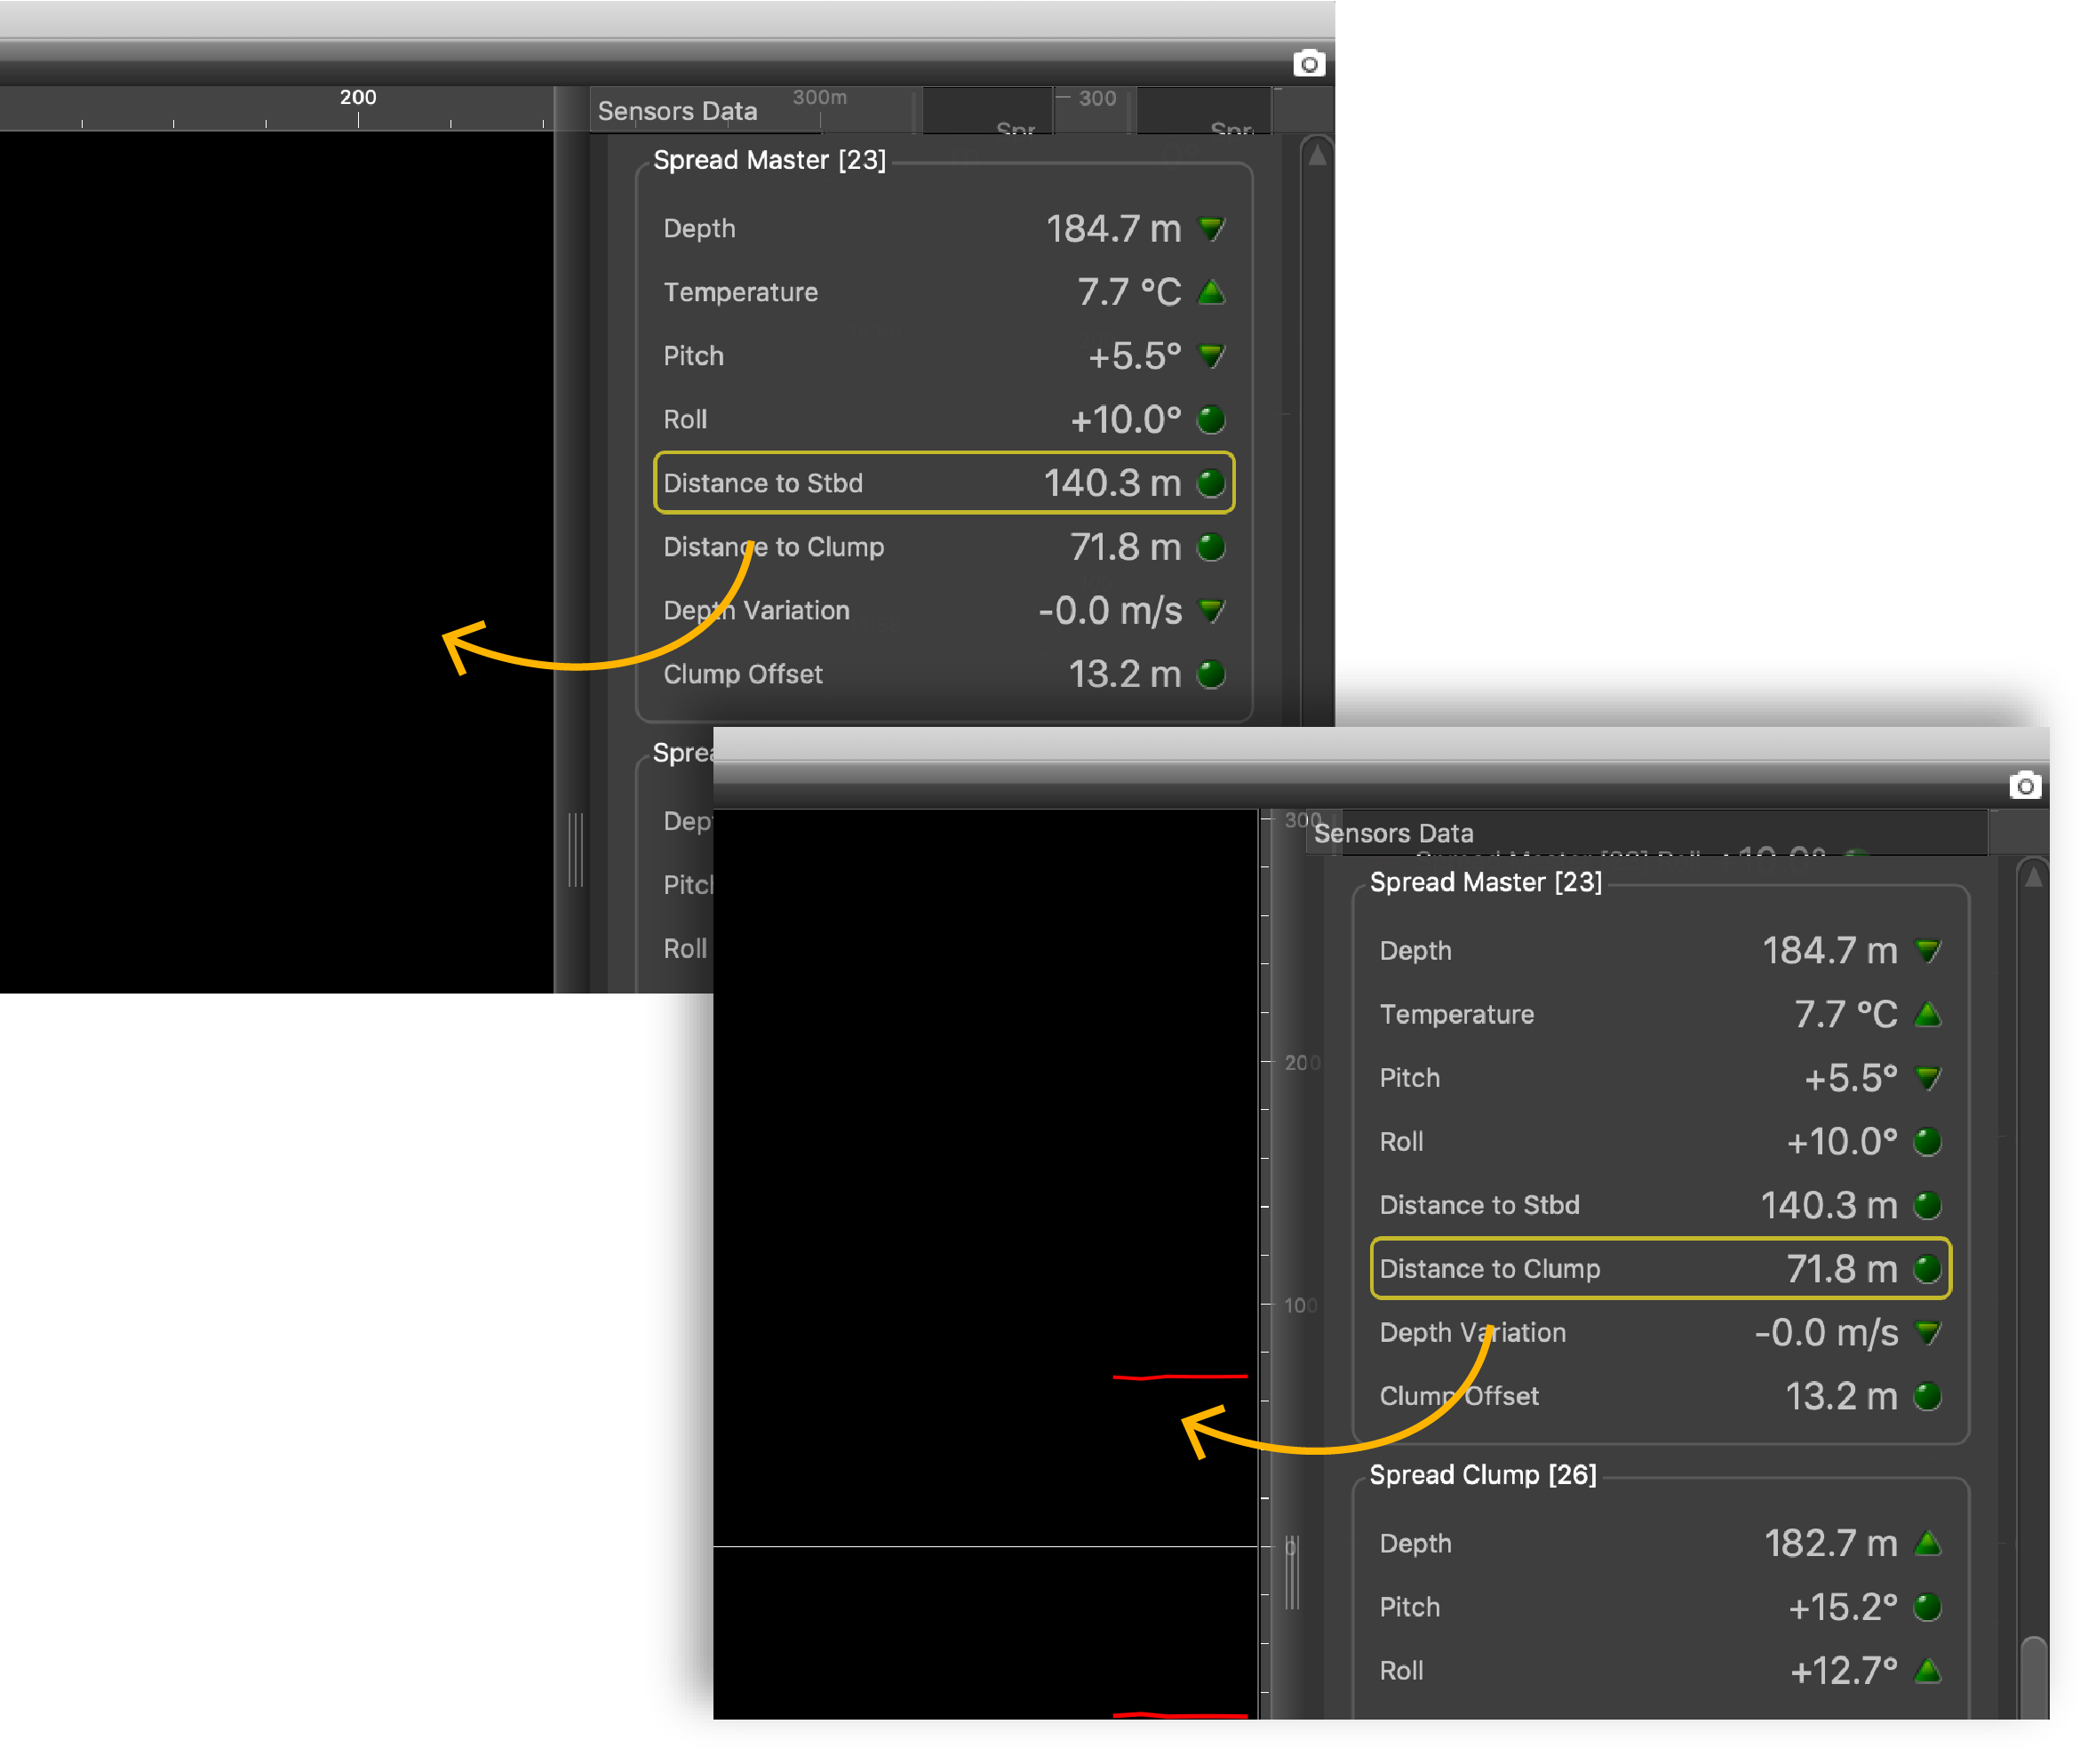
In , click + hold distance data from spread sensors such as
Distance to Stb from a Spread
Master and drag it to the page display.
-
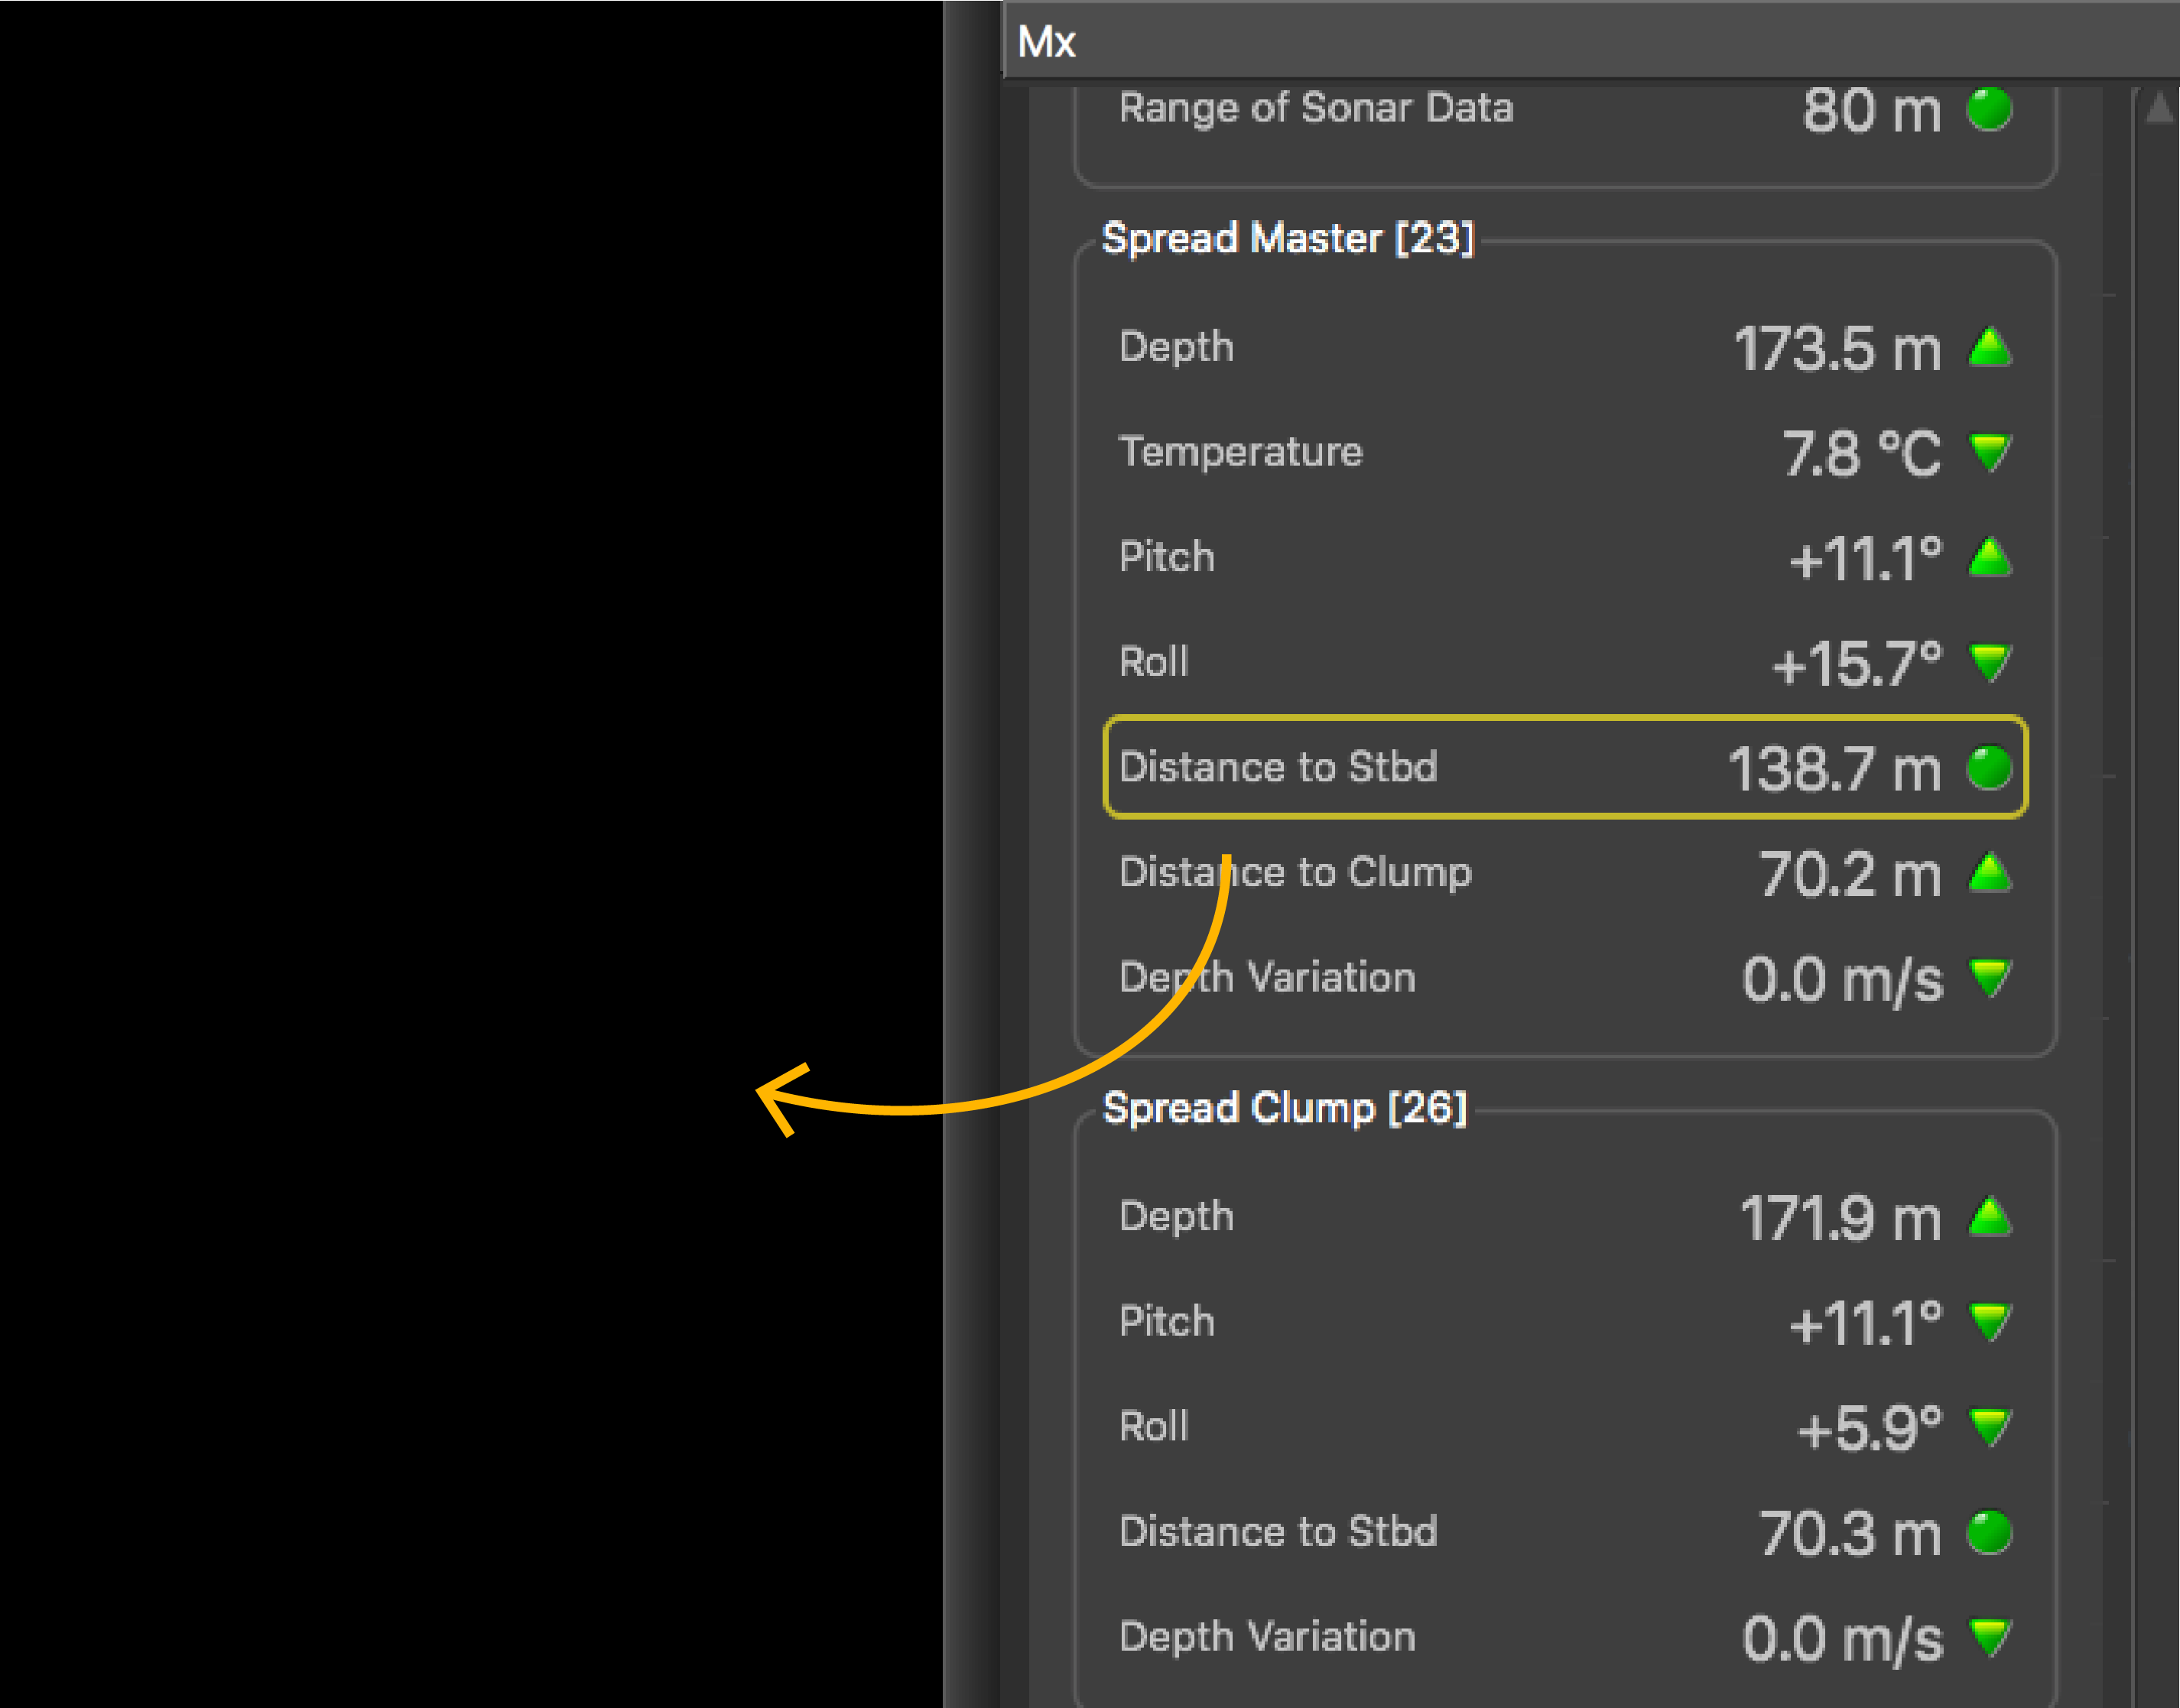
Open the control panels and from the Mx
tab, click + hold distance data from spread sensors such as Distance to Stbd from a Spread Master and drag it to the page
display.
-
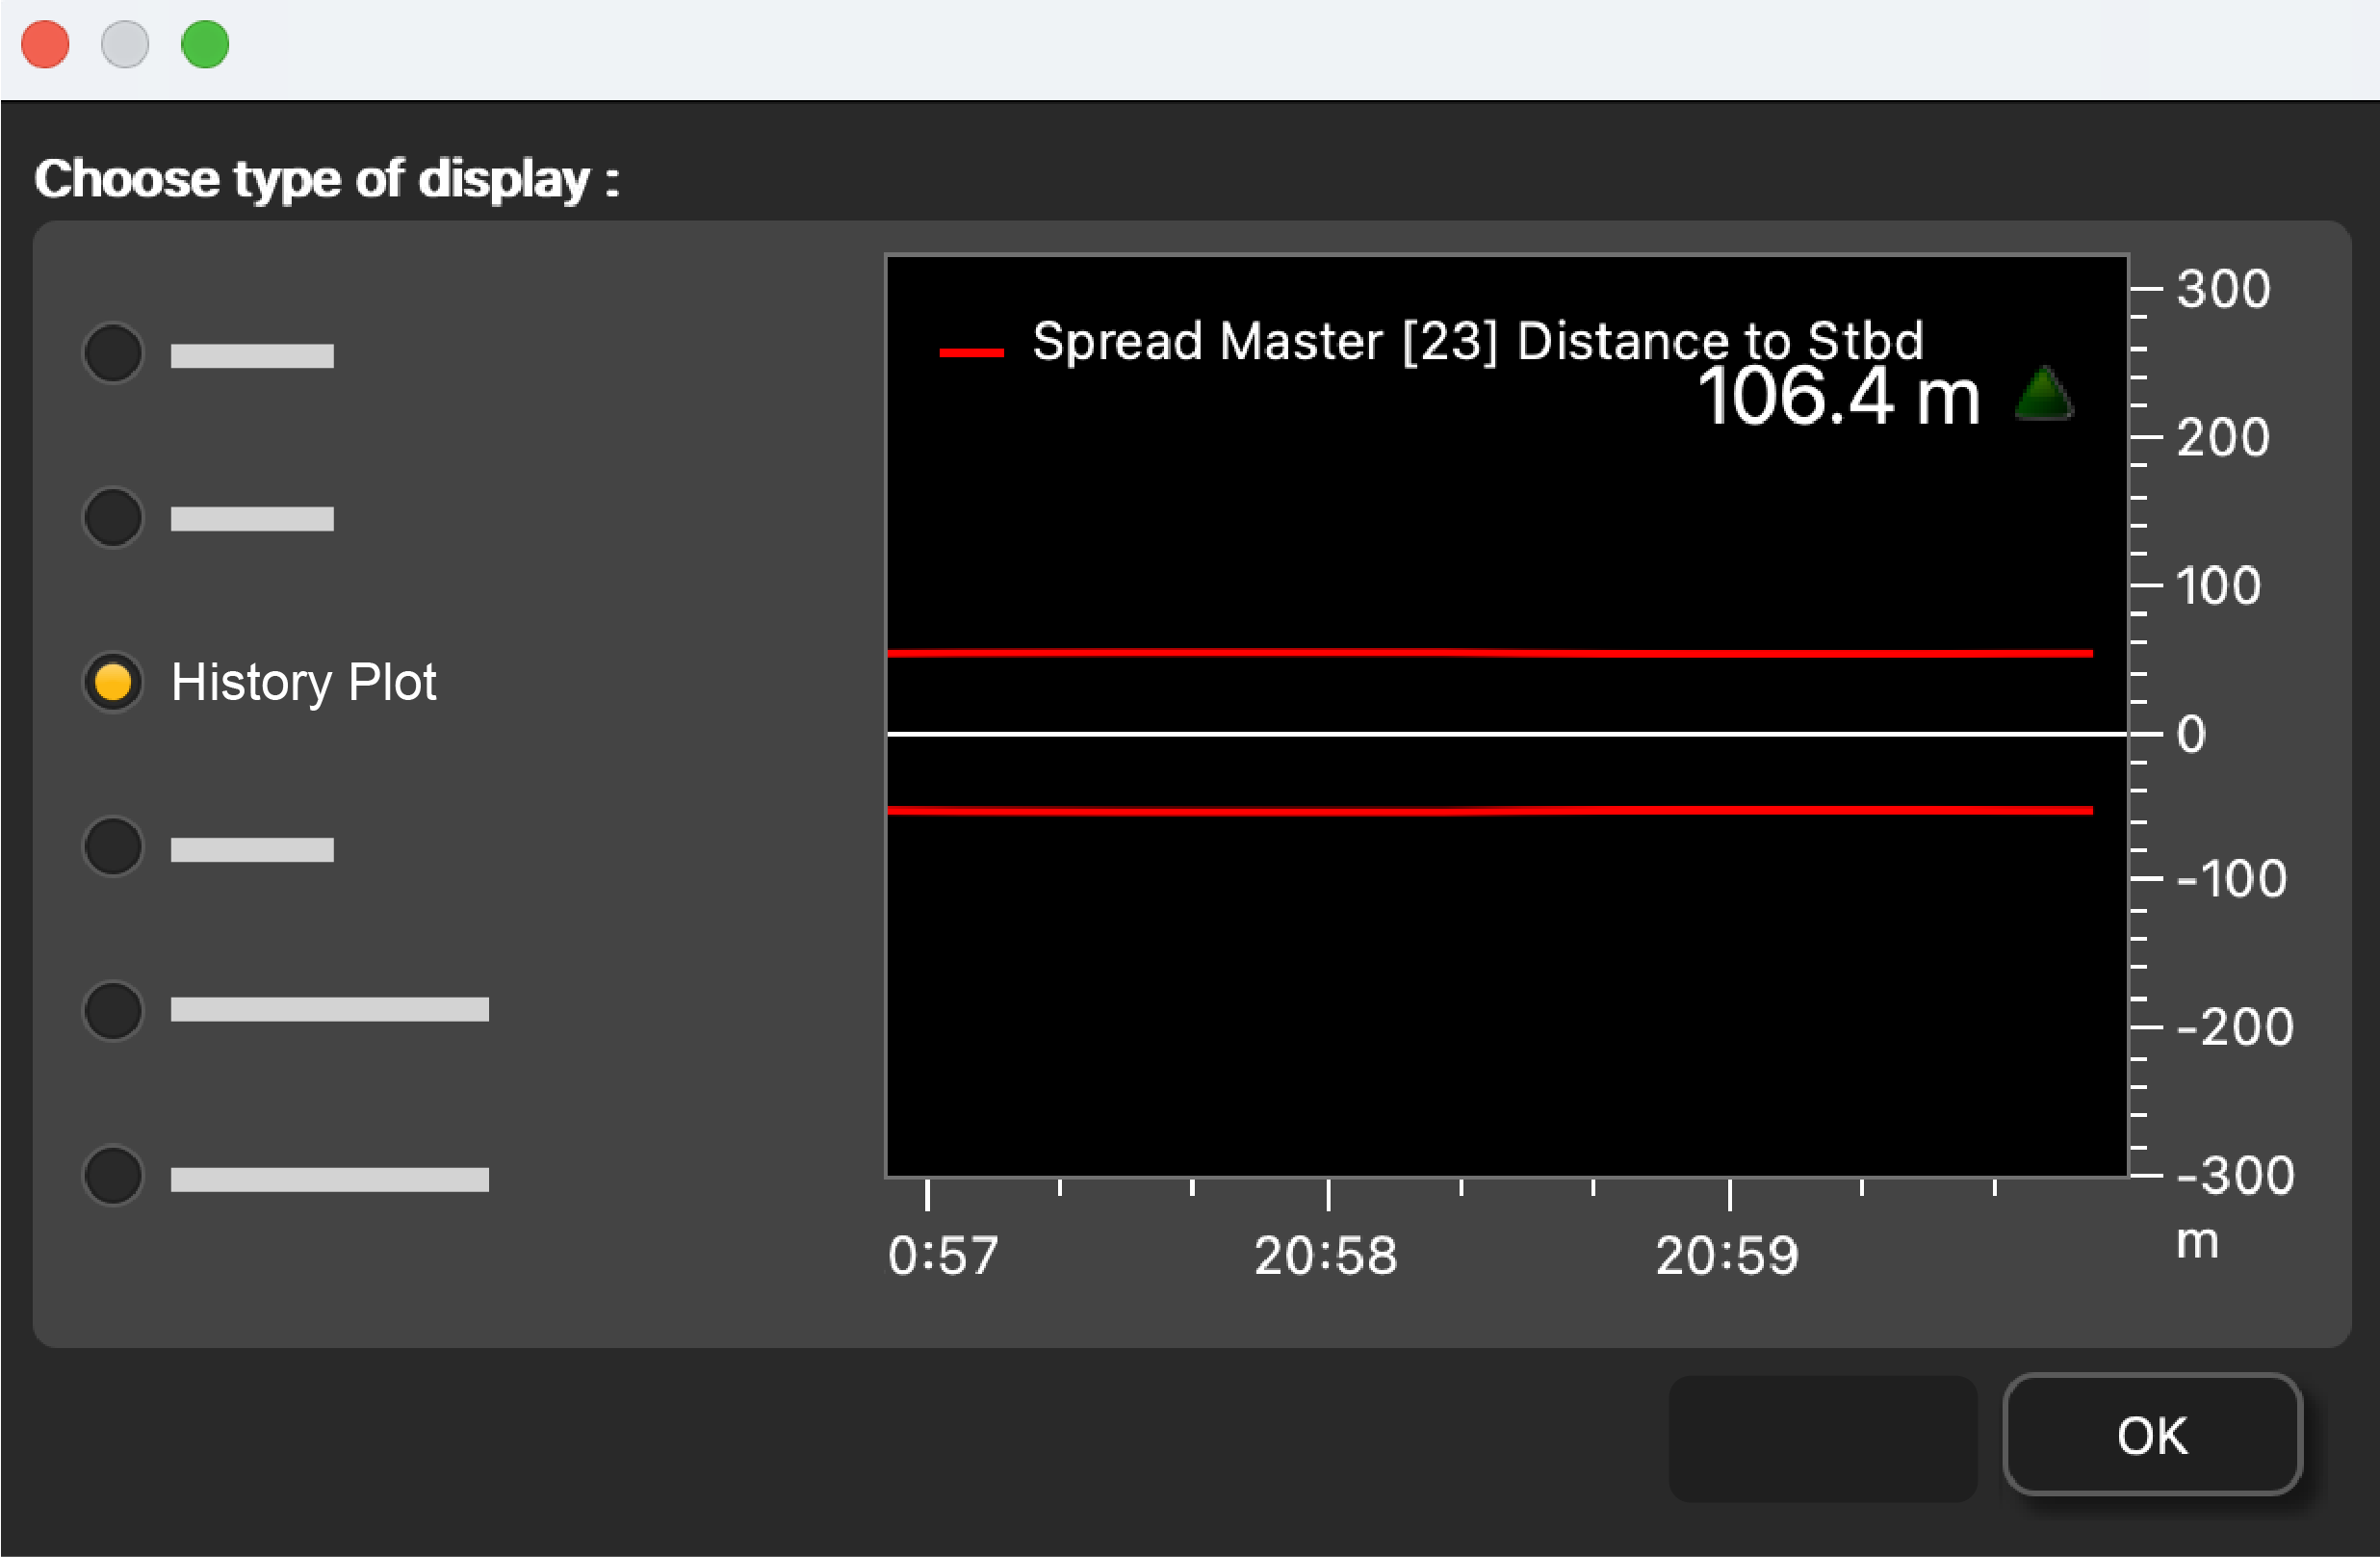
In Choose type of
display, select
History Plot.
-
Right-click the history plot and select Vertical.
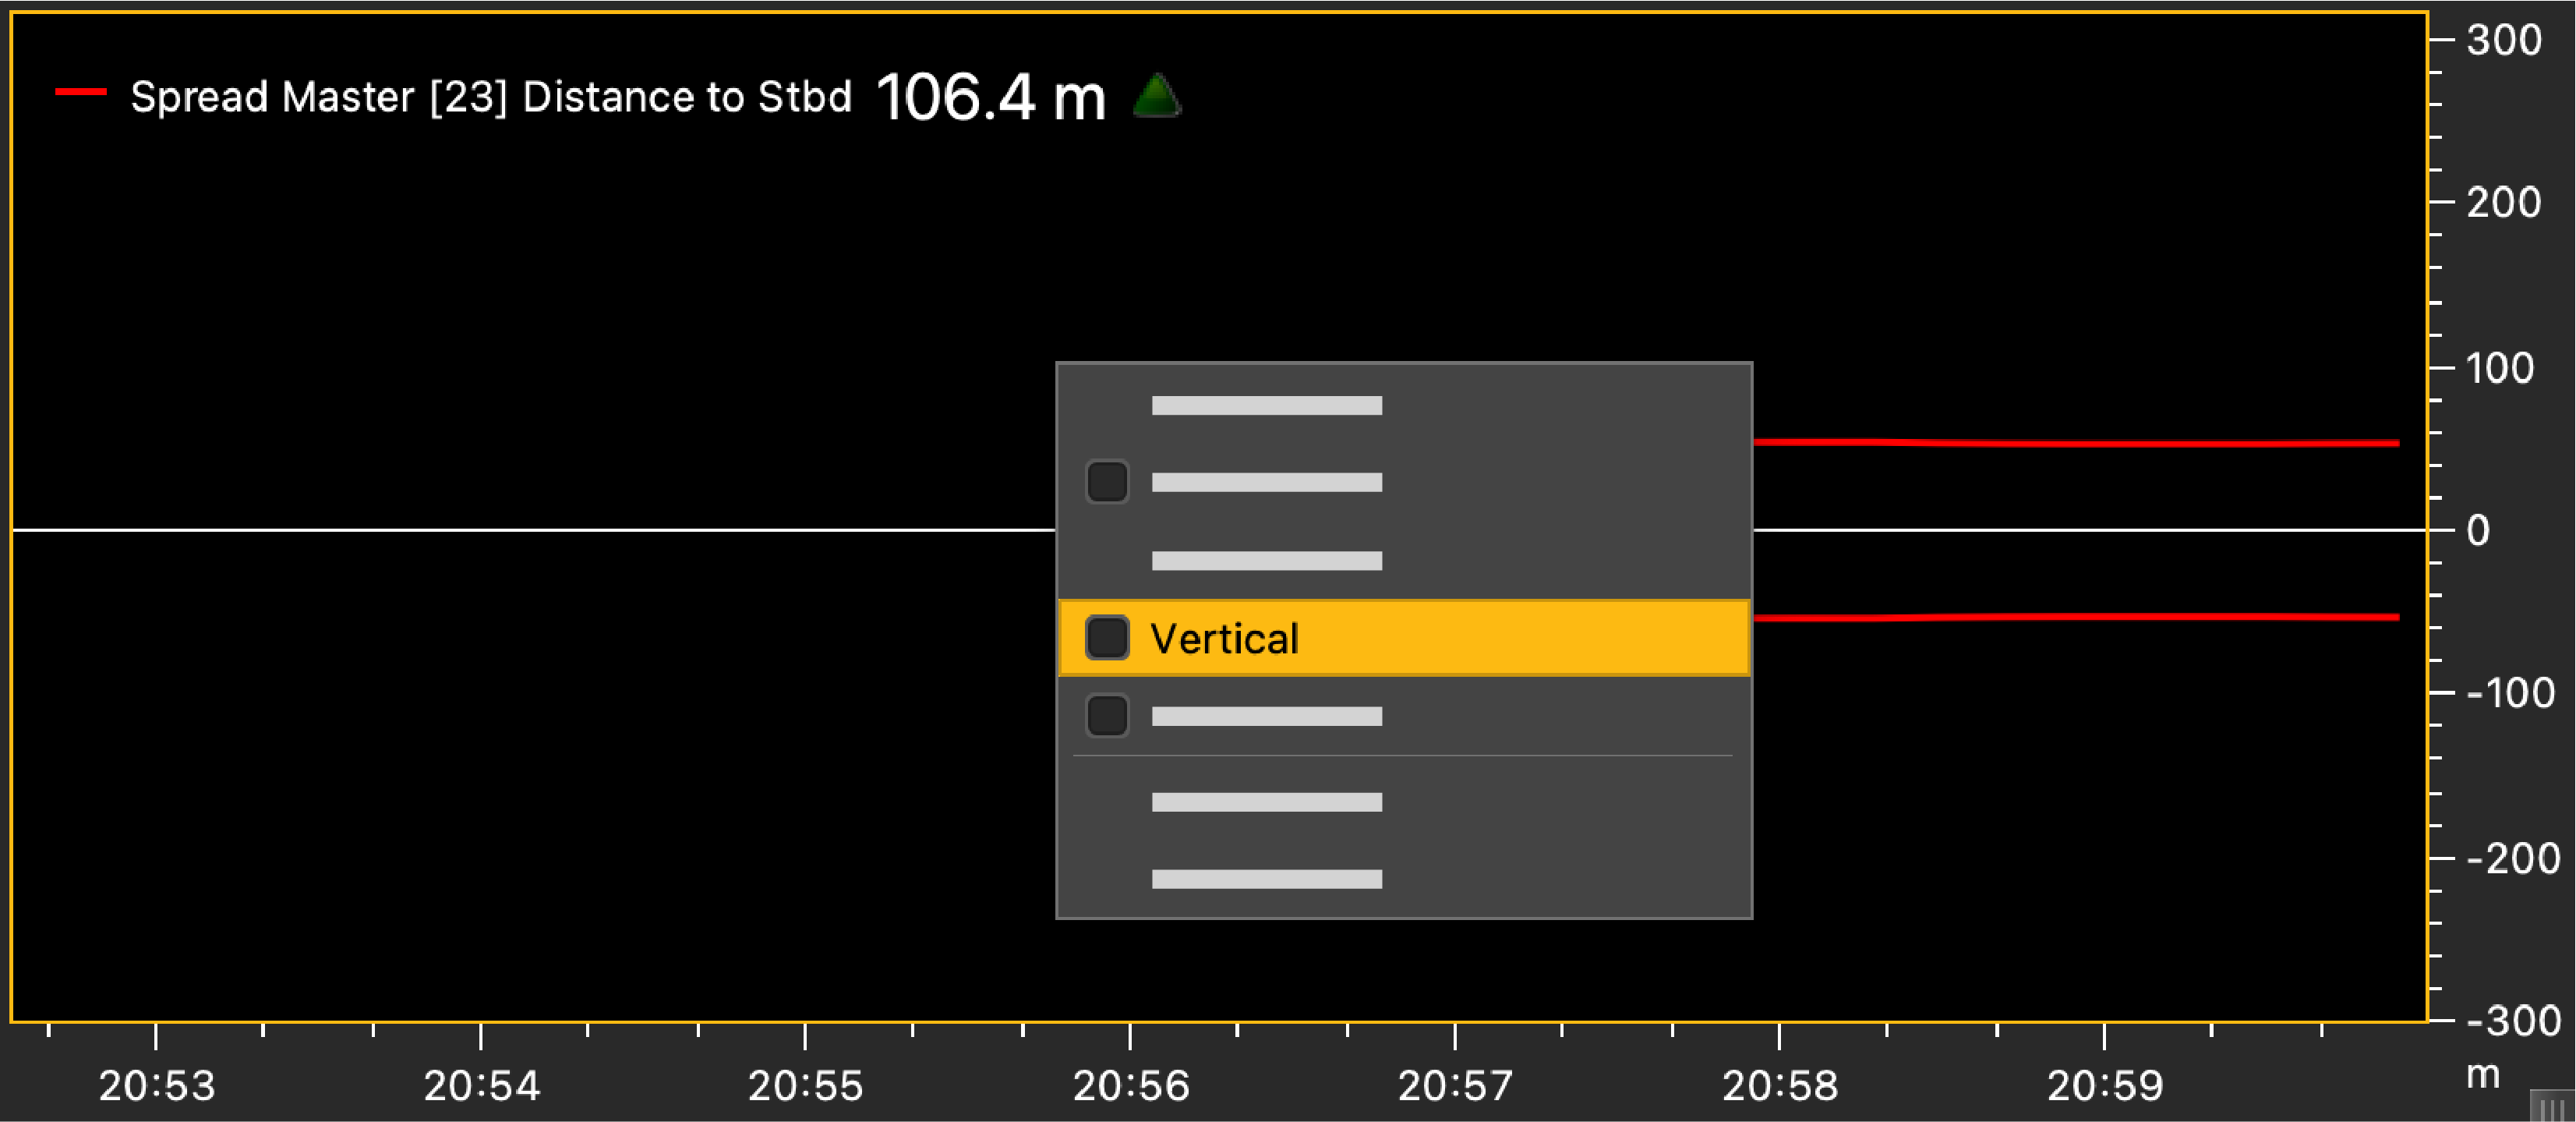
The history plot becomes vertical. You can see the distance between the port and starboard door.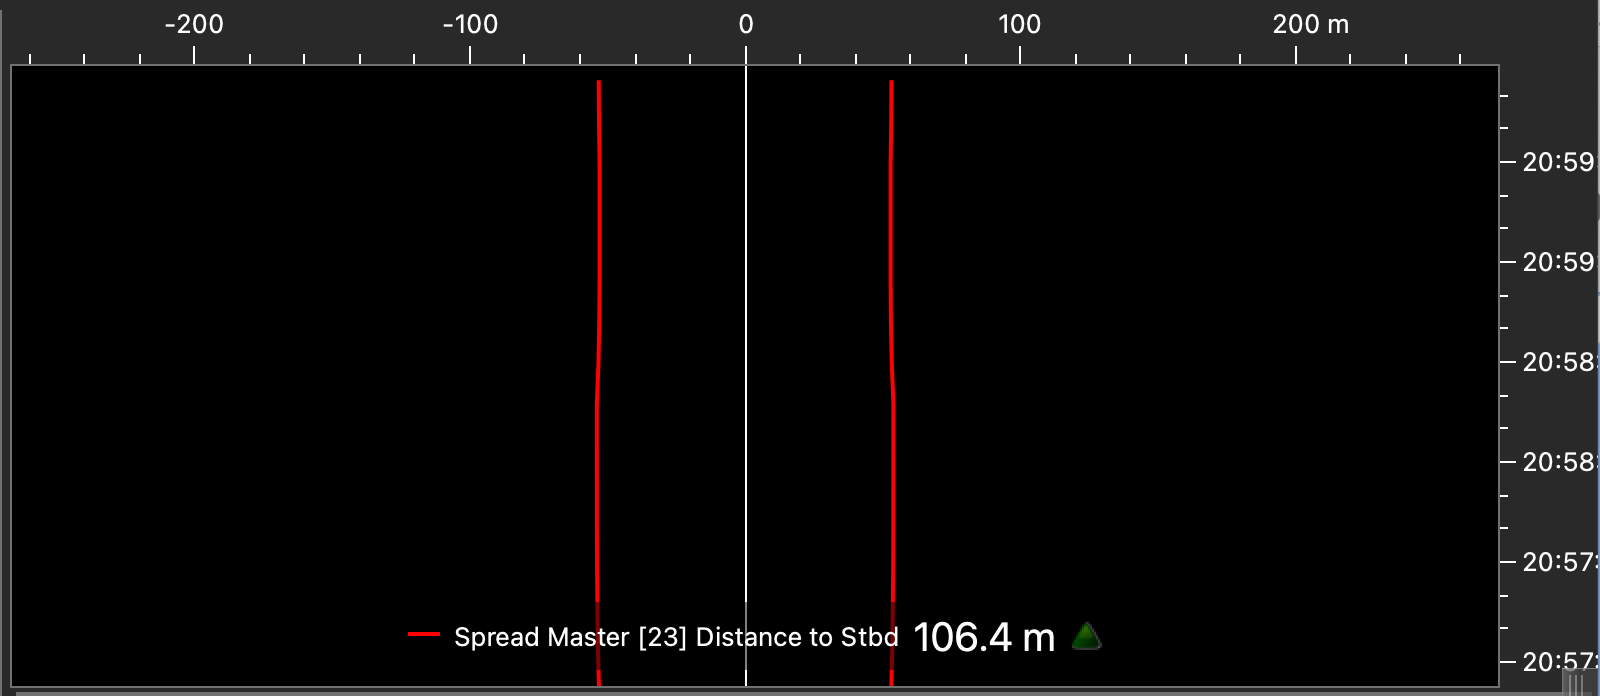
-
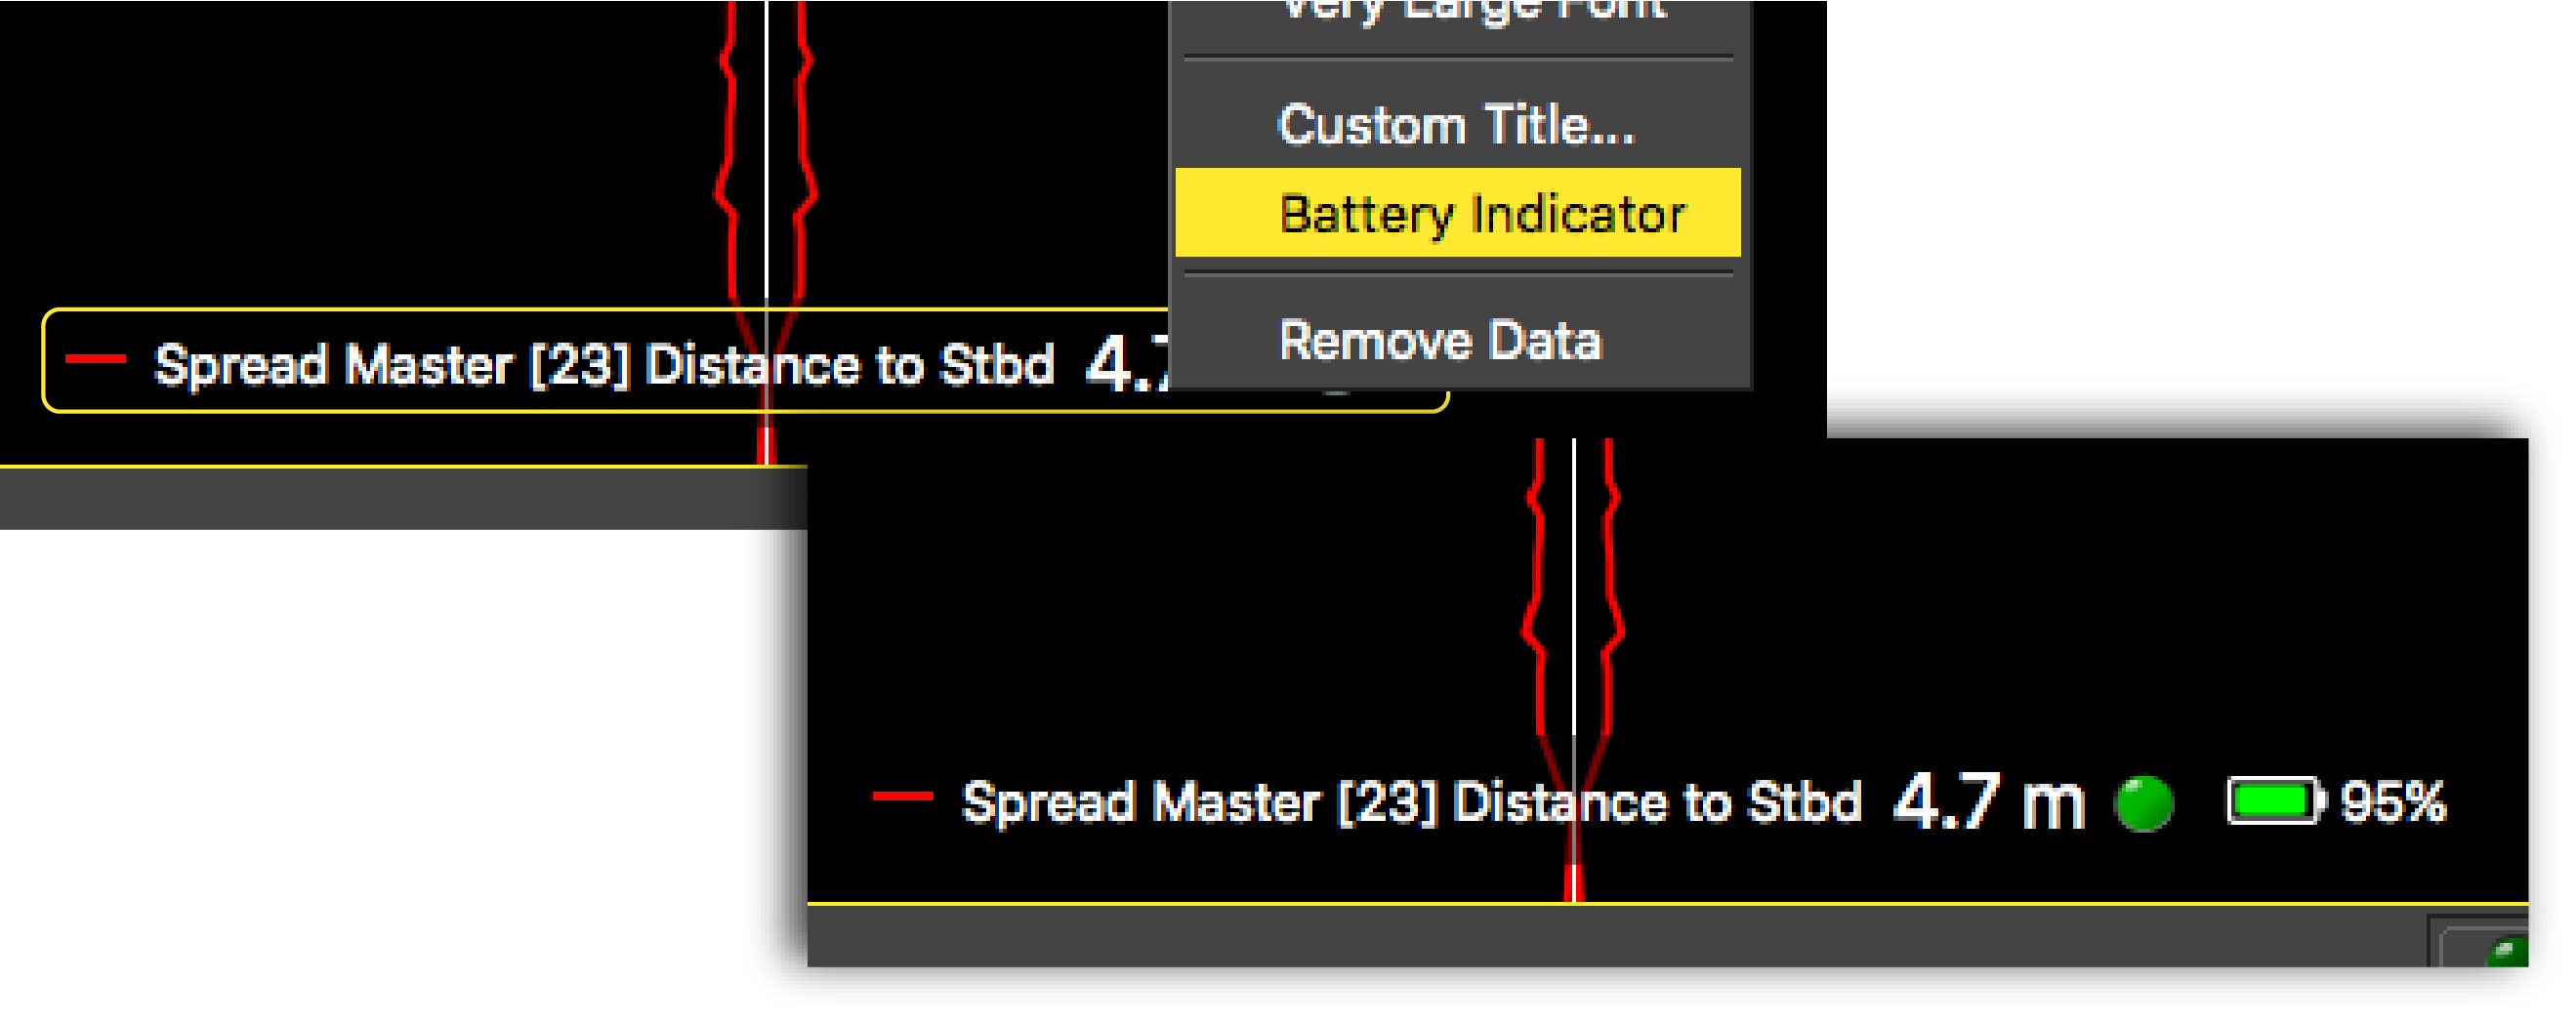
If you have a firmware version 08.03 and above, you can display the battery
level on the plot. Right-click the title of the plot and click Battery
Indicator.
-
Deactivate the Customize mode when you have finished
customizing pages: click Menu > Customize again.
Displaying Twin Trawl Spread
Before you begin
Procedure
-
From the top left corner of the screen, click Menu > Customize and enter the password
eureka.
-
If you have twin trawls with 2 measured distances, drag to
the page the Spread Master Distance to Stbd,
then drag Distance to
Clump above the plot of
the distance to starboard. Right-click the plot and click Vertical.
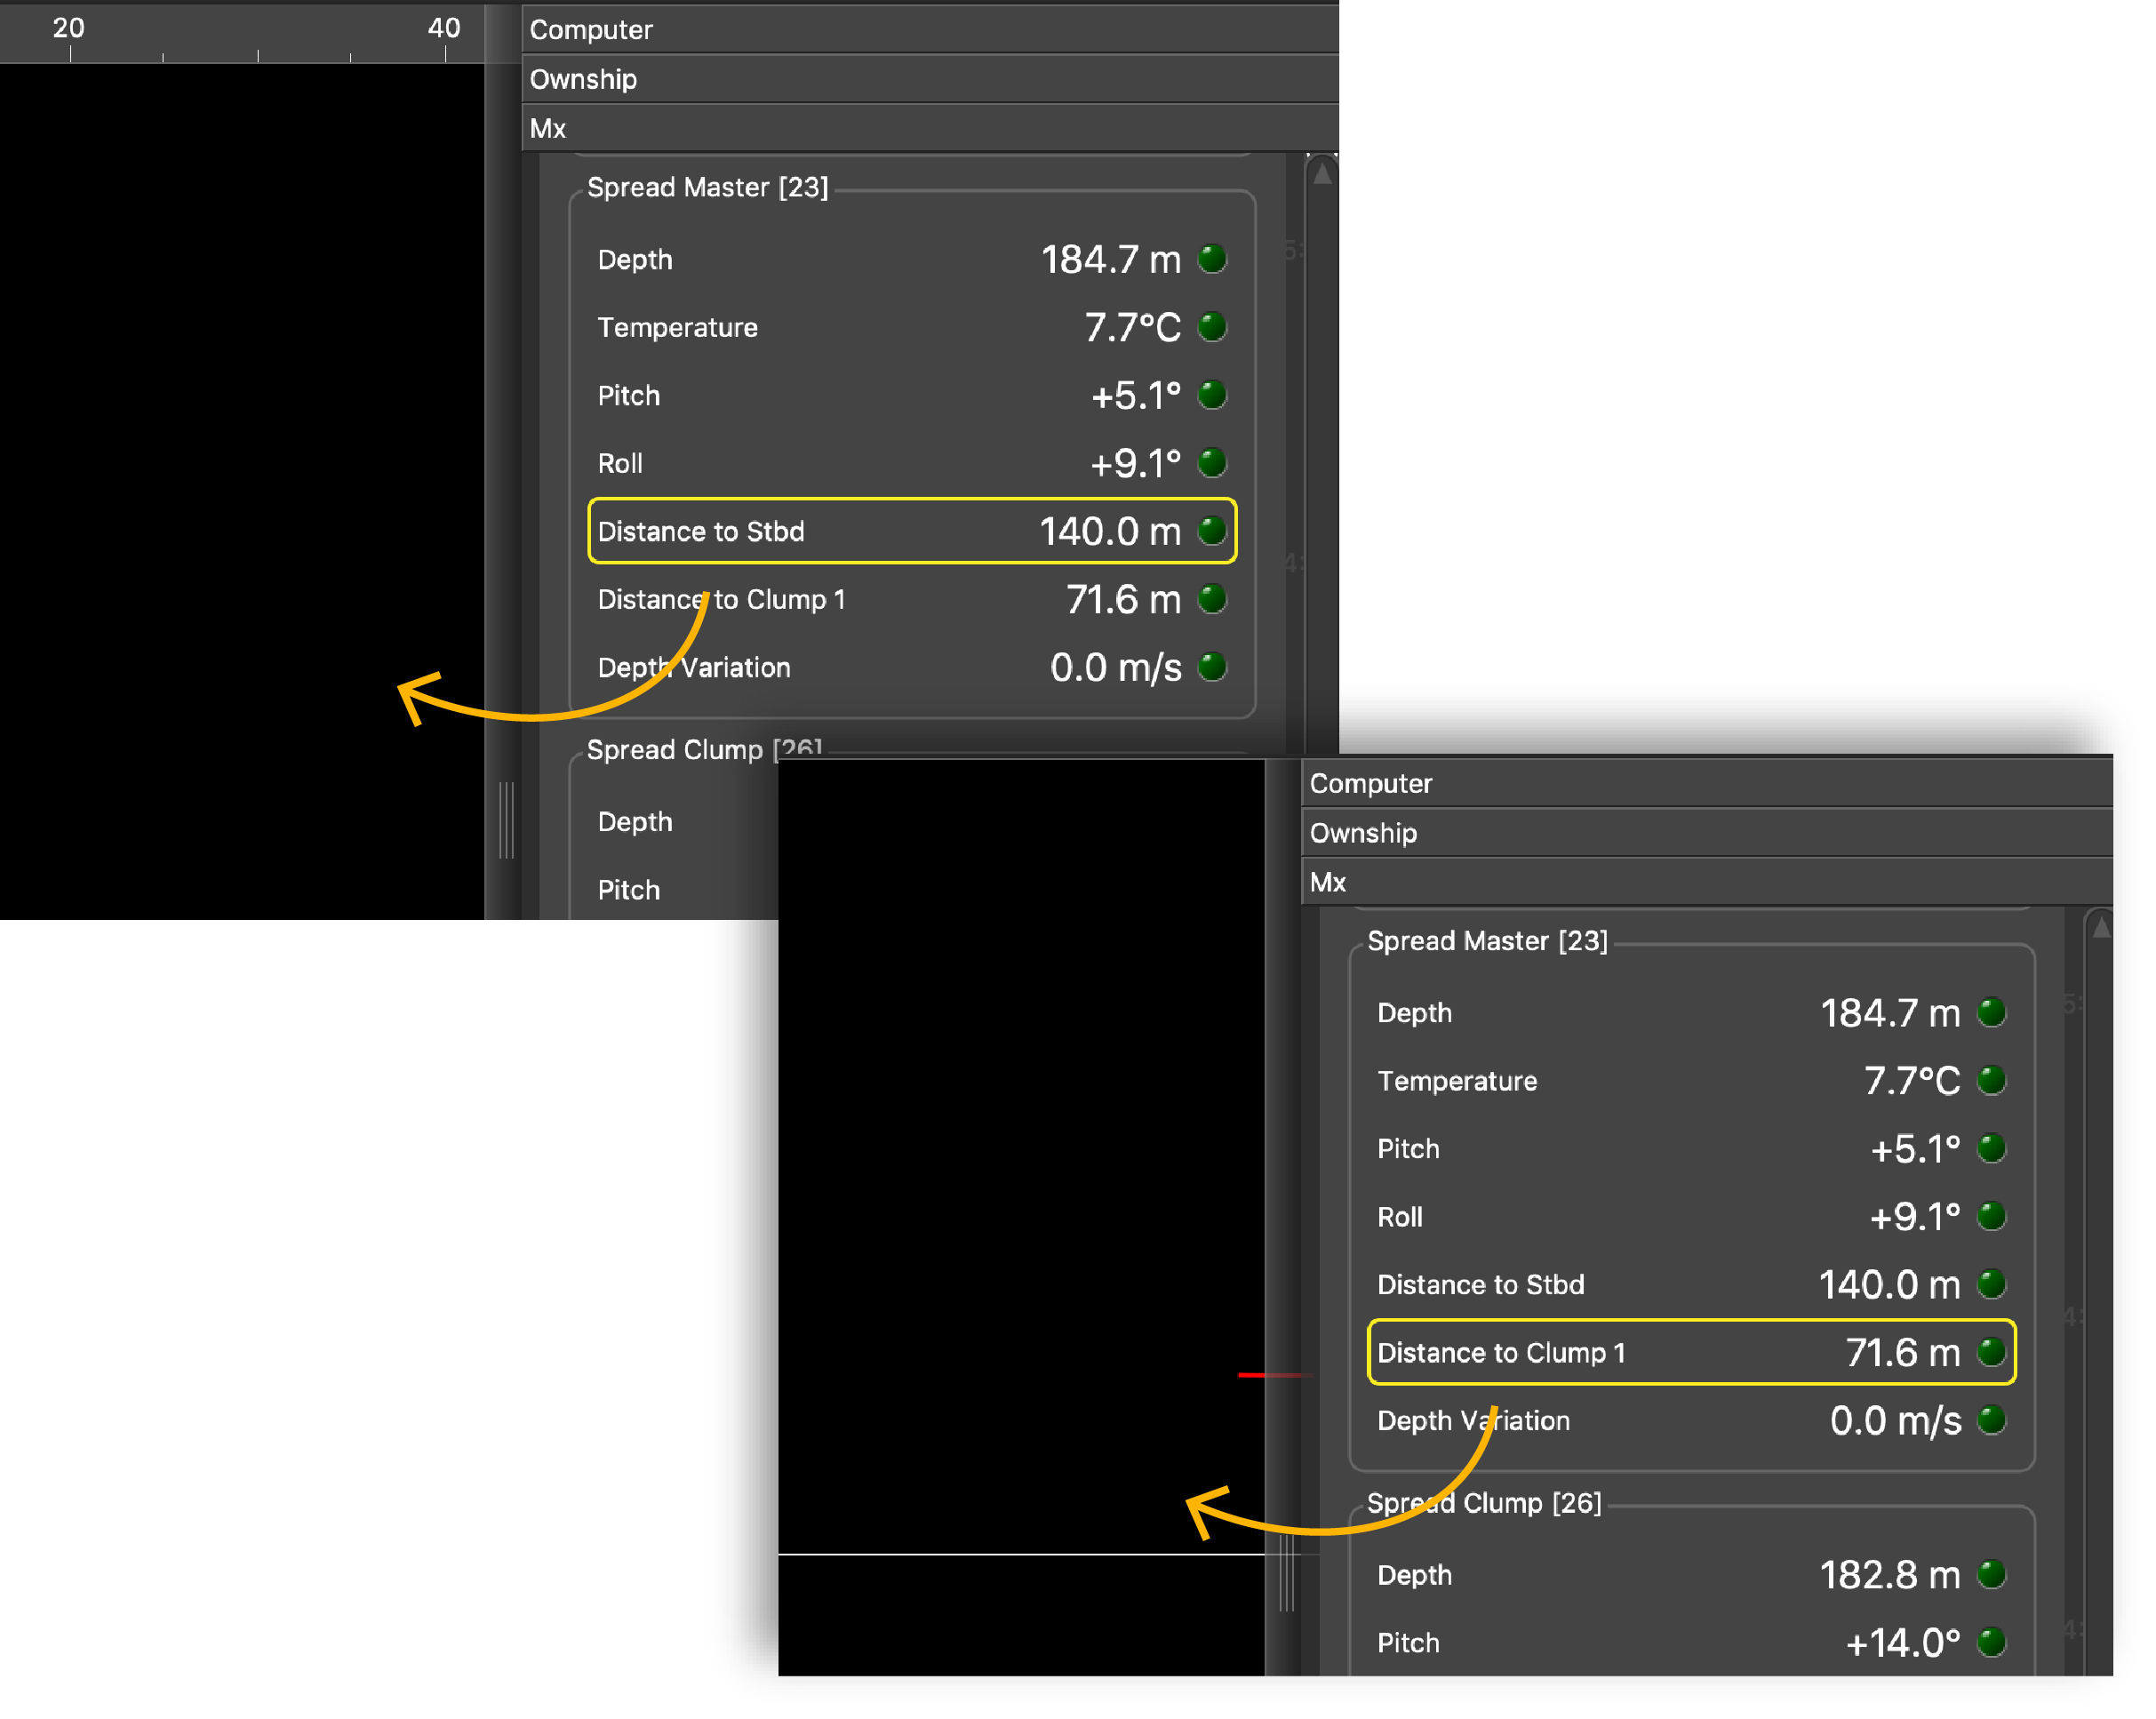
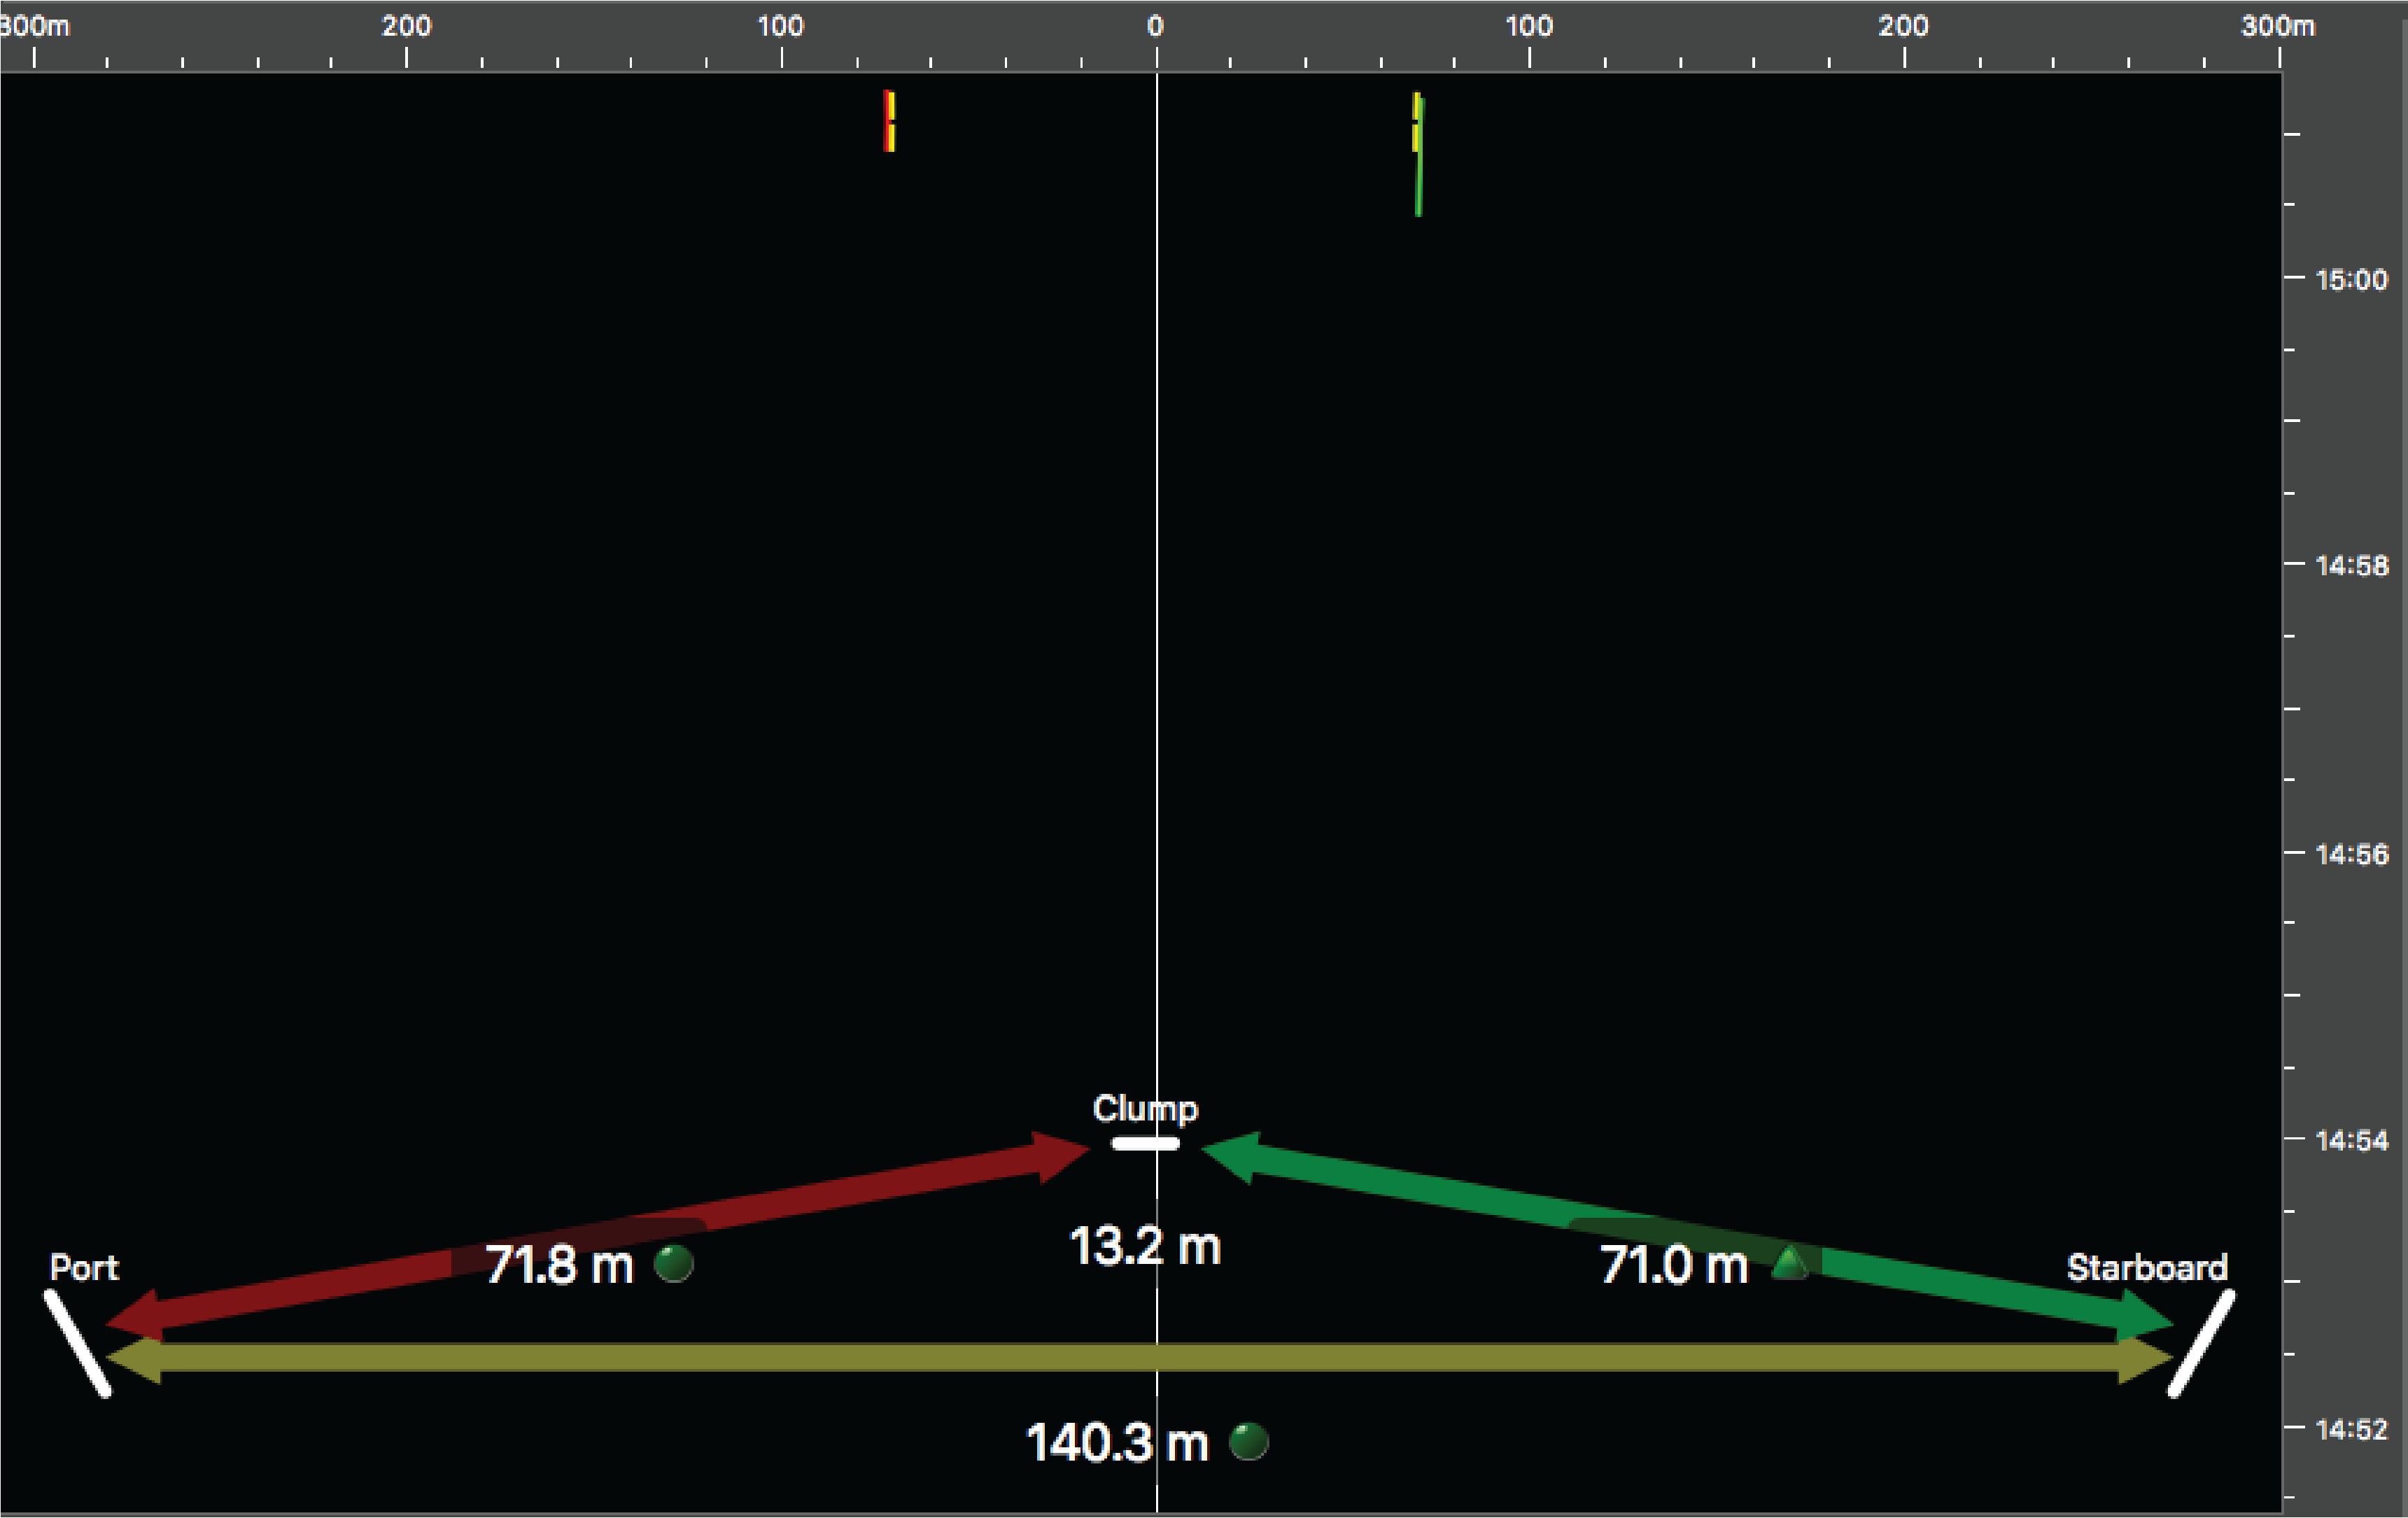
Distances between the port door and starboard door and between the port door and clump are displayed.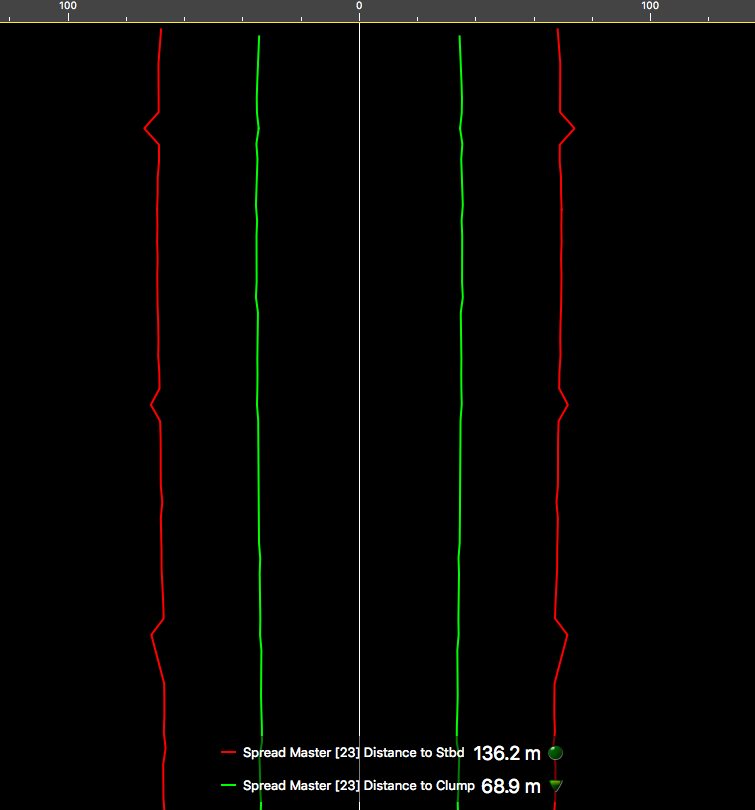
- Right-click the title of the plot and click Battery Indicator to display the battery level of the sensor.
-
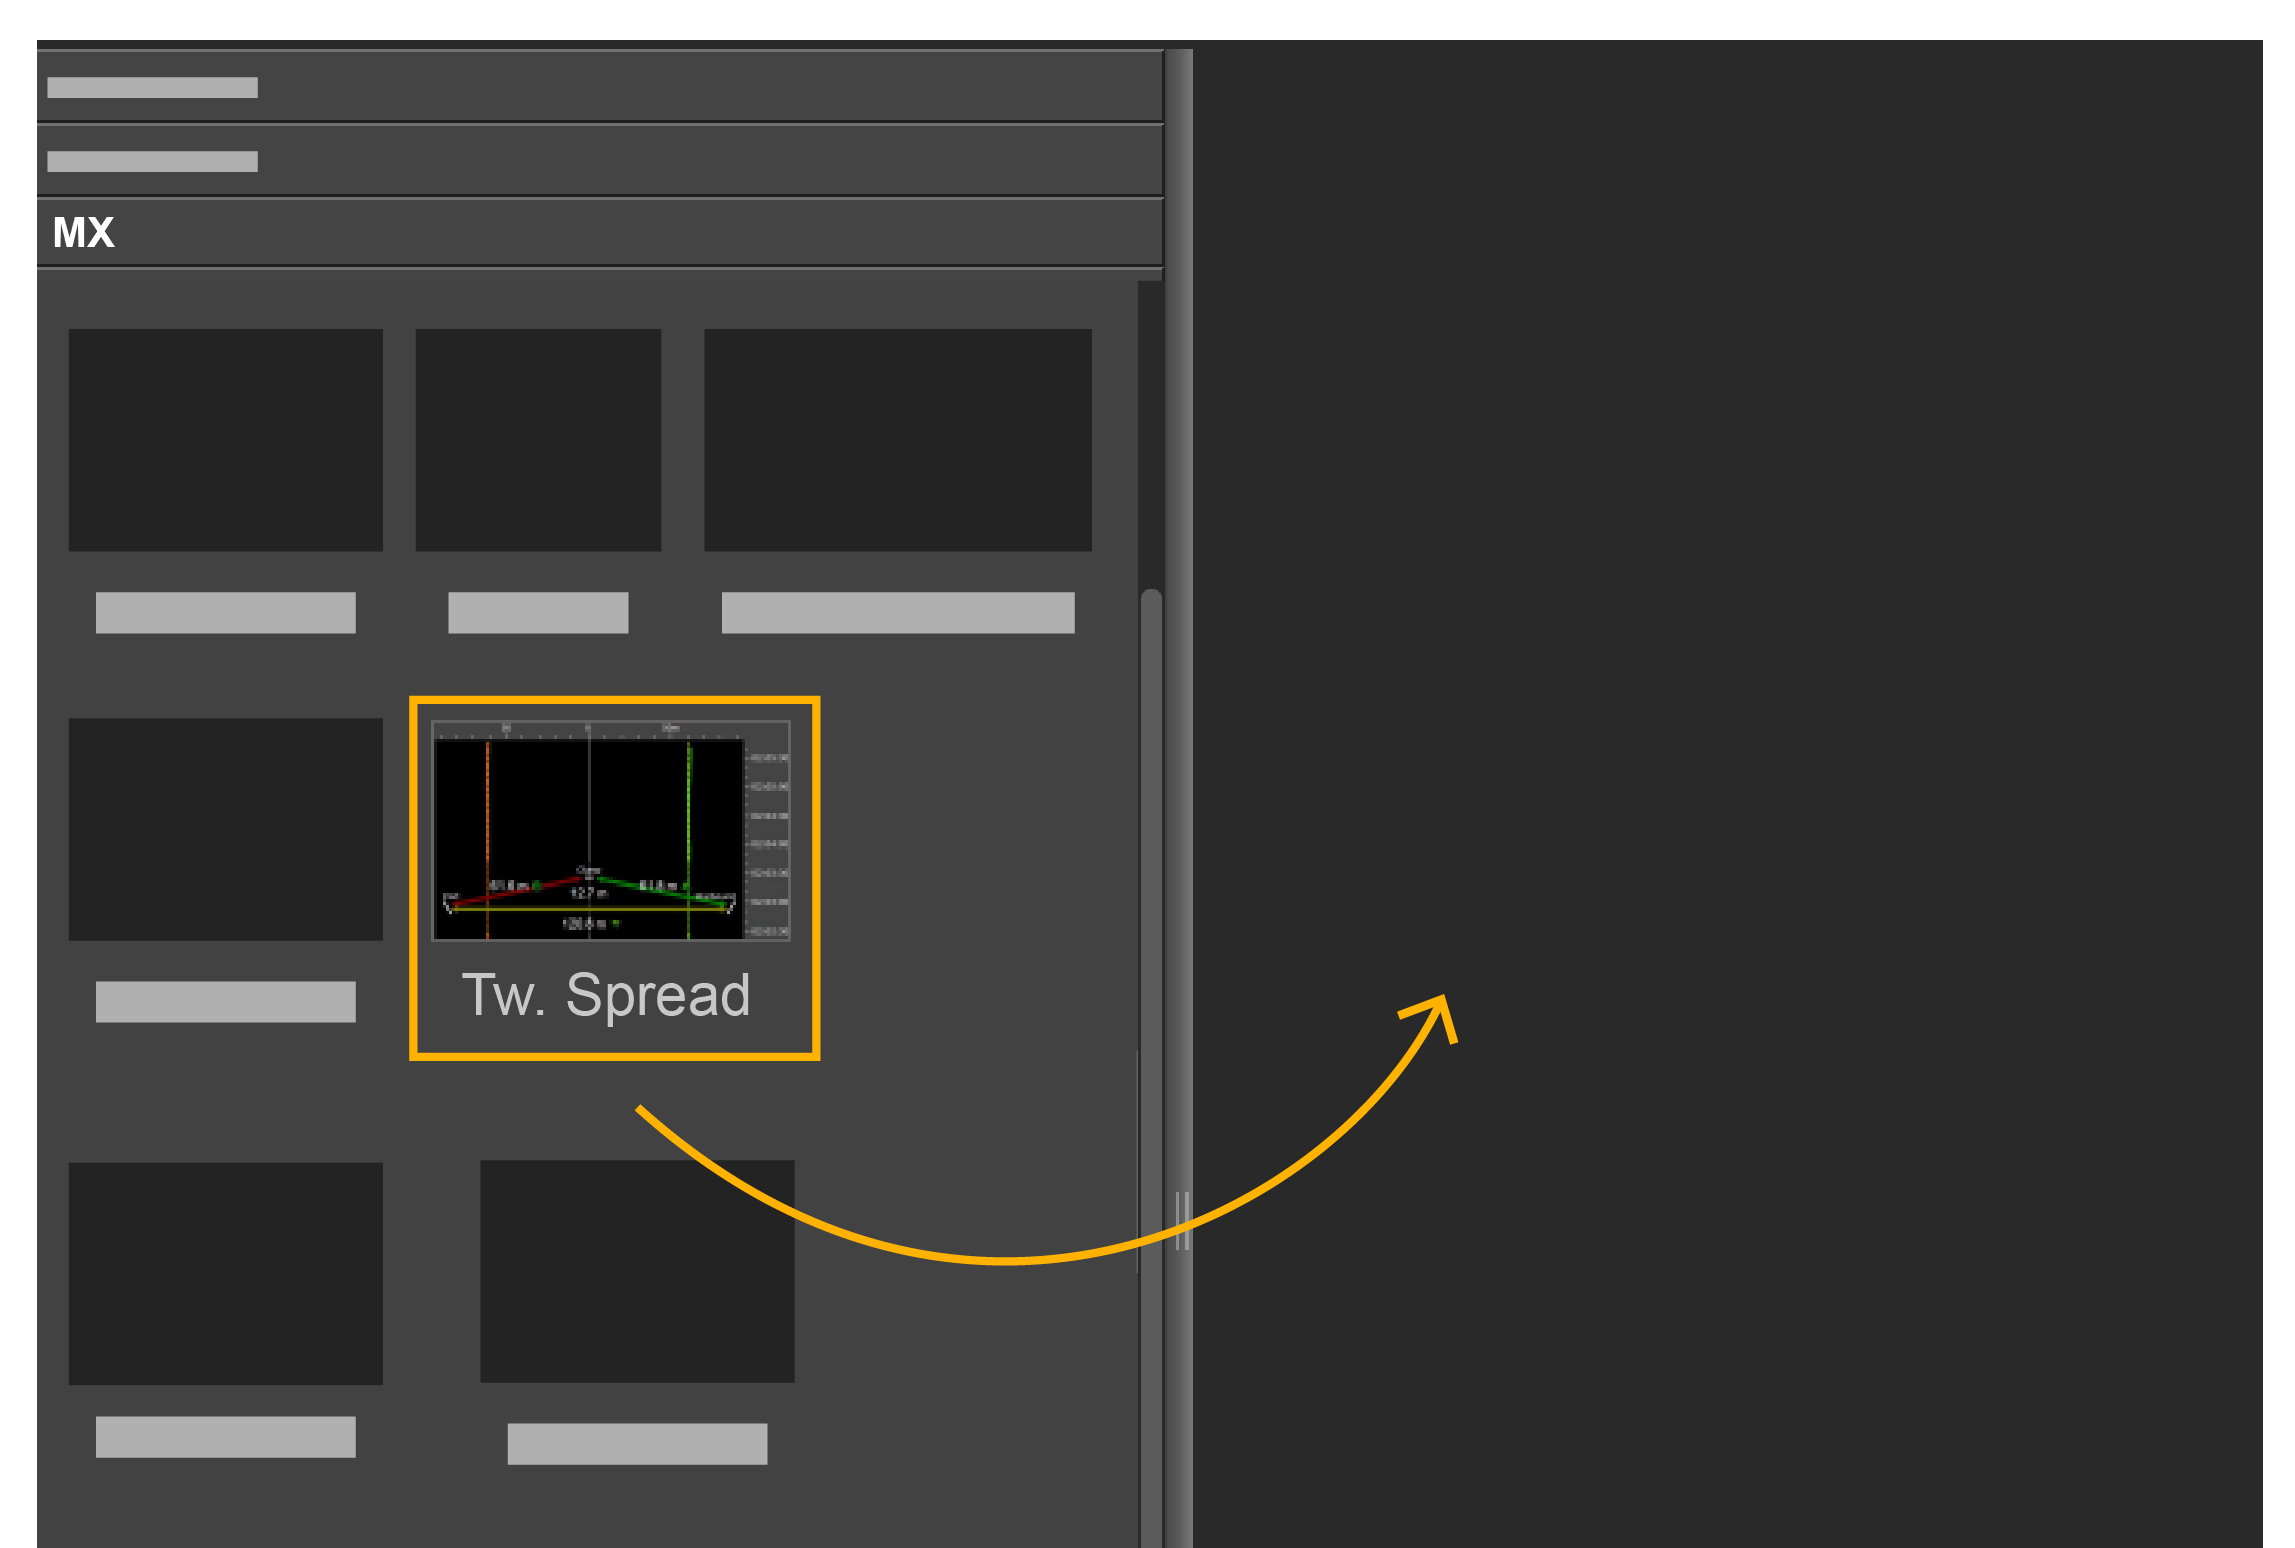
If you have twin trawls with 3
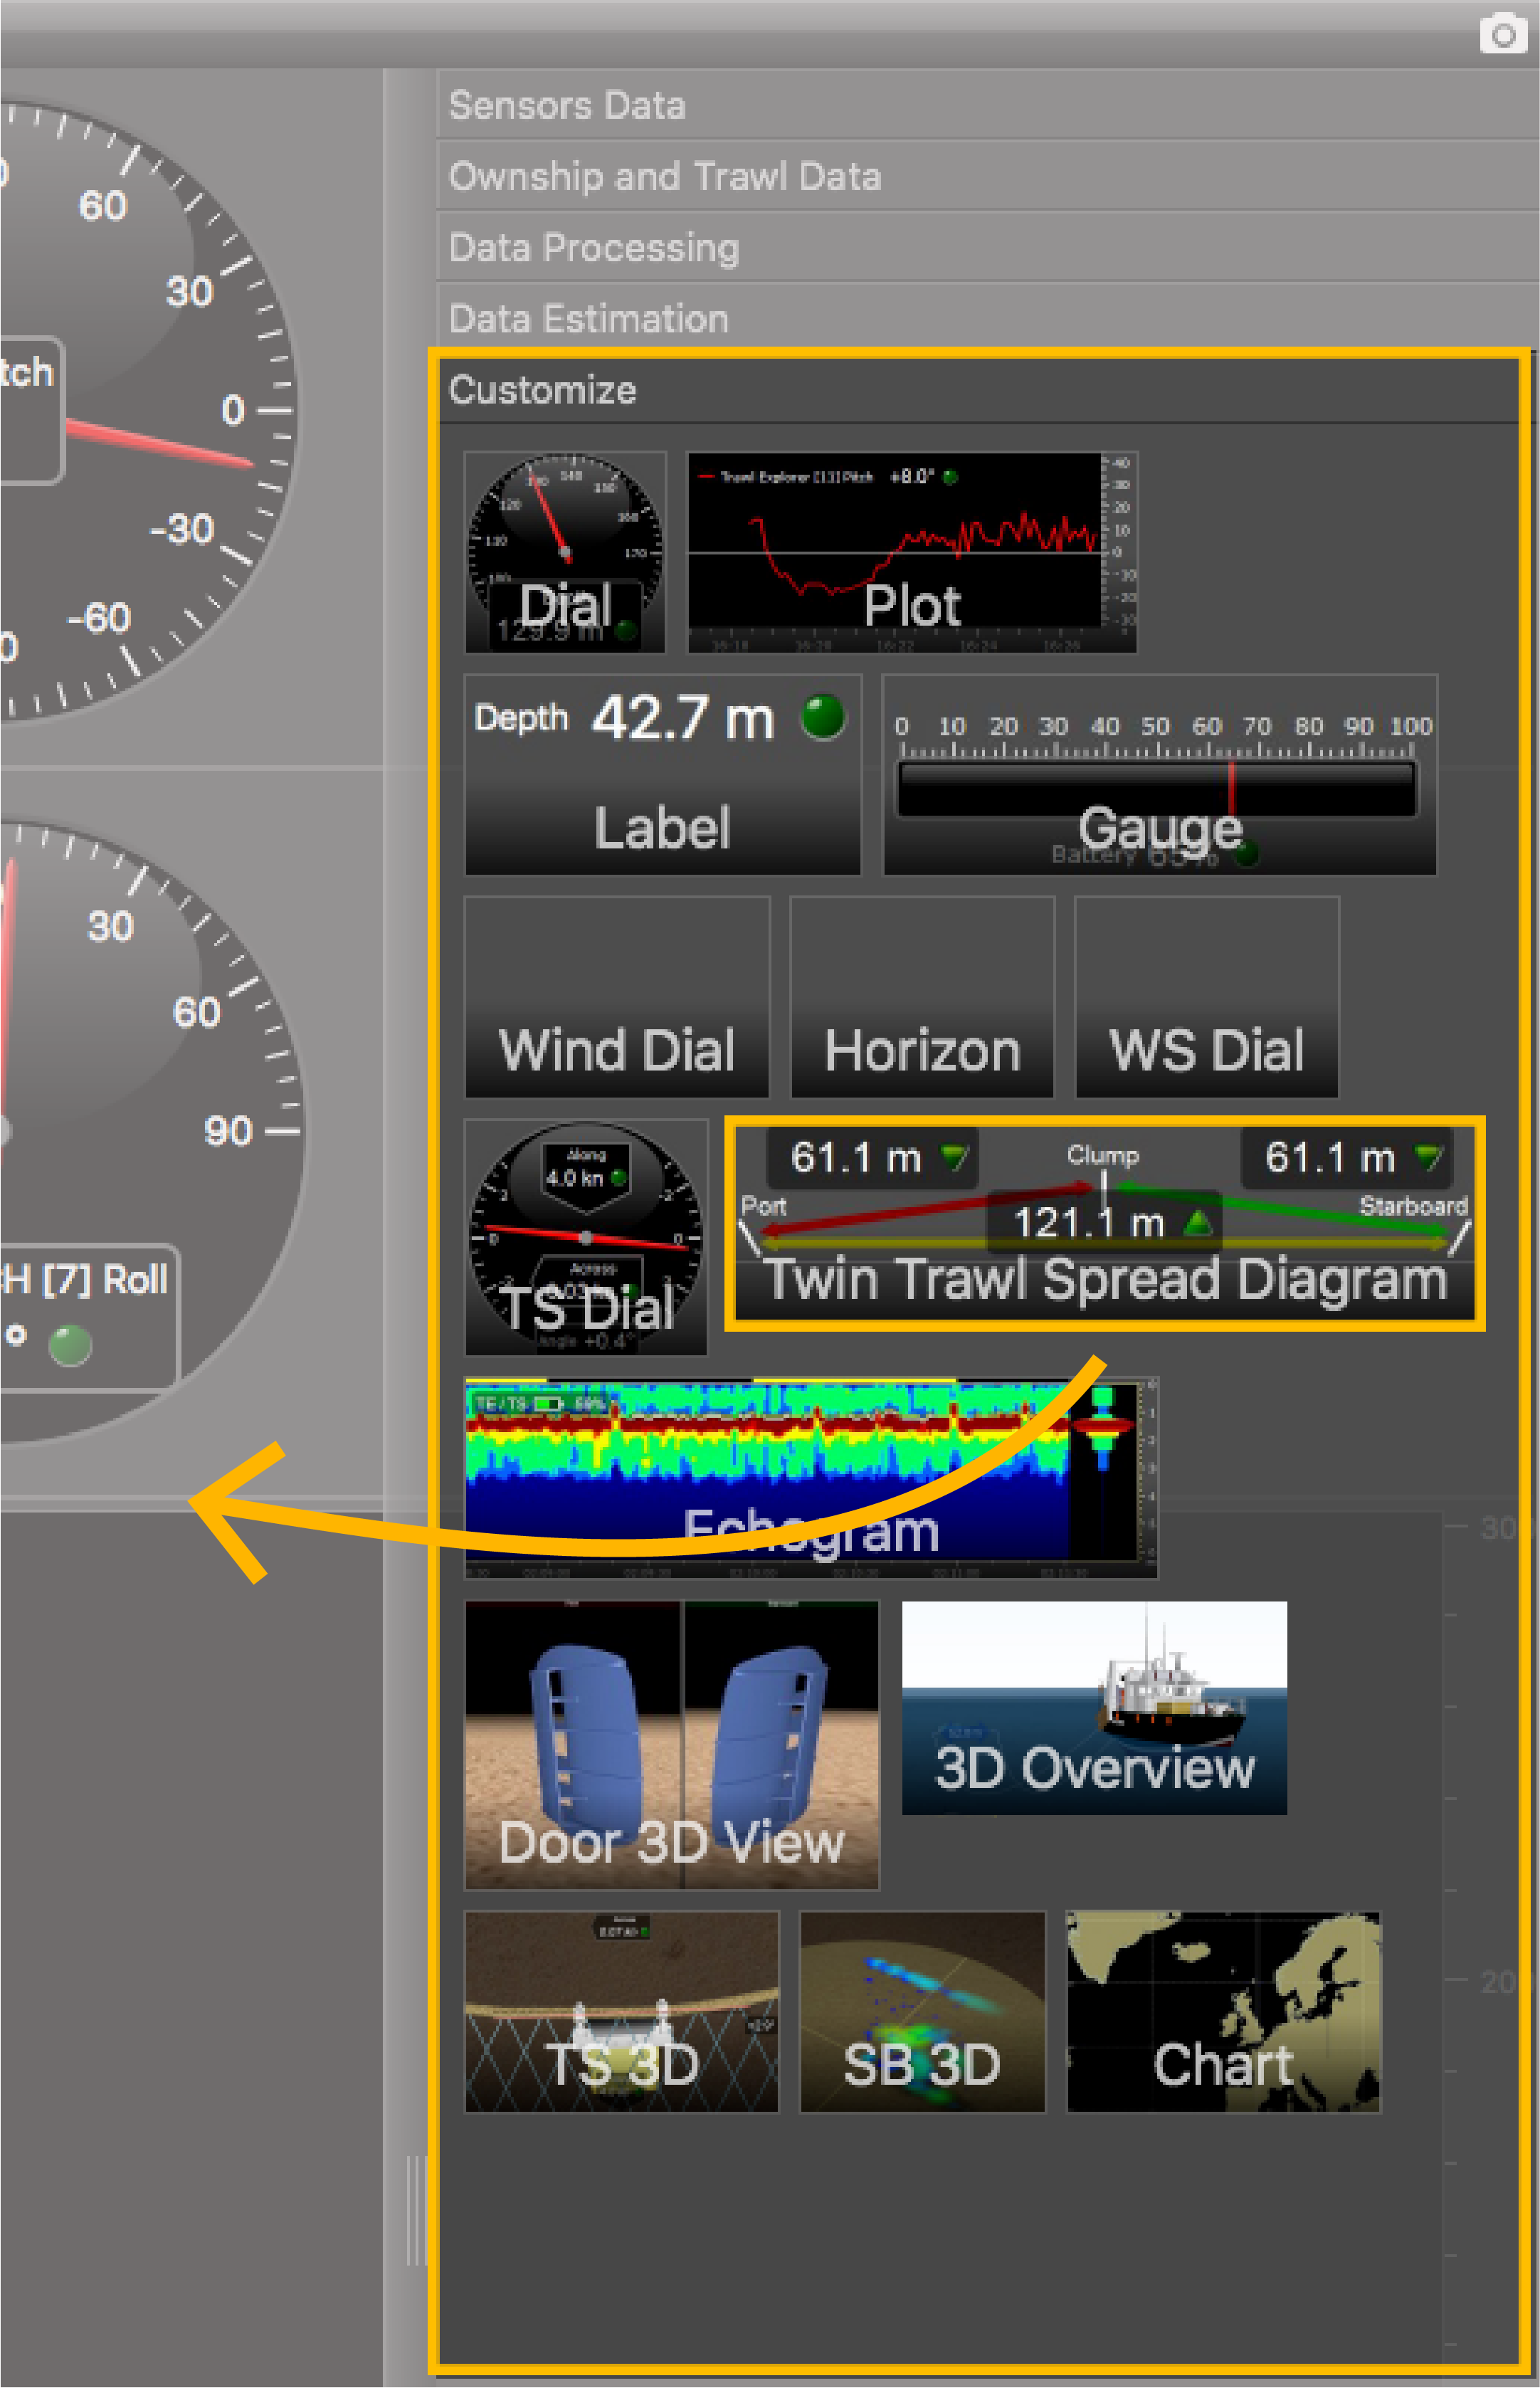
measured distances, open the Customize panel and go to the Mx tab.
- Click + drag a Twin Trawl Spread
Plot to the page. You
can know if the clump is centered when the yellow dashed line is above
the red and green lines.
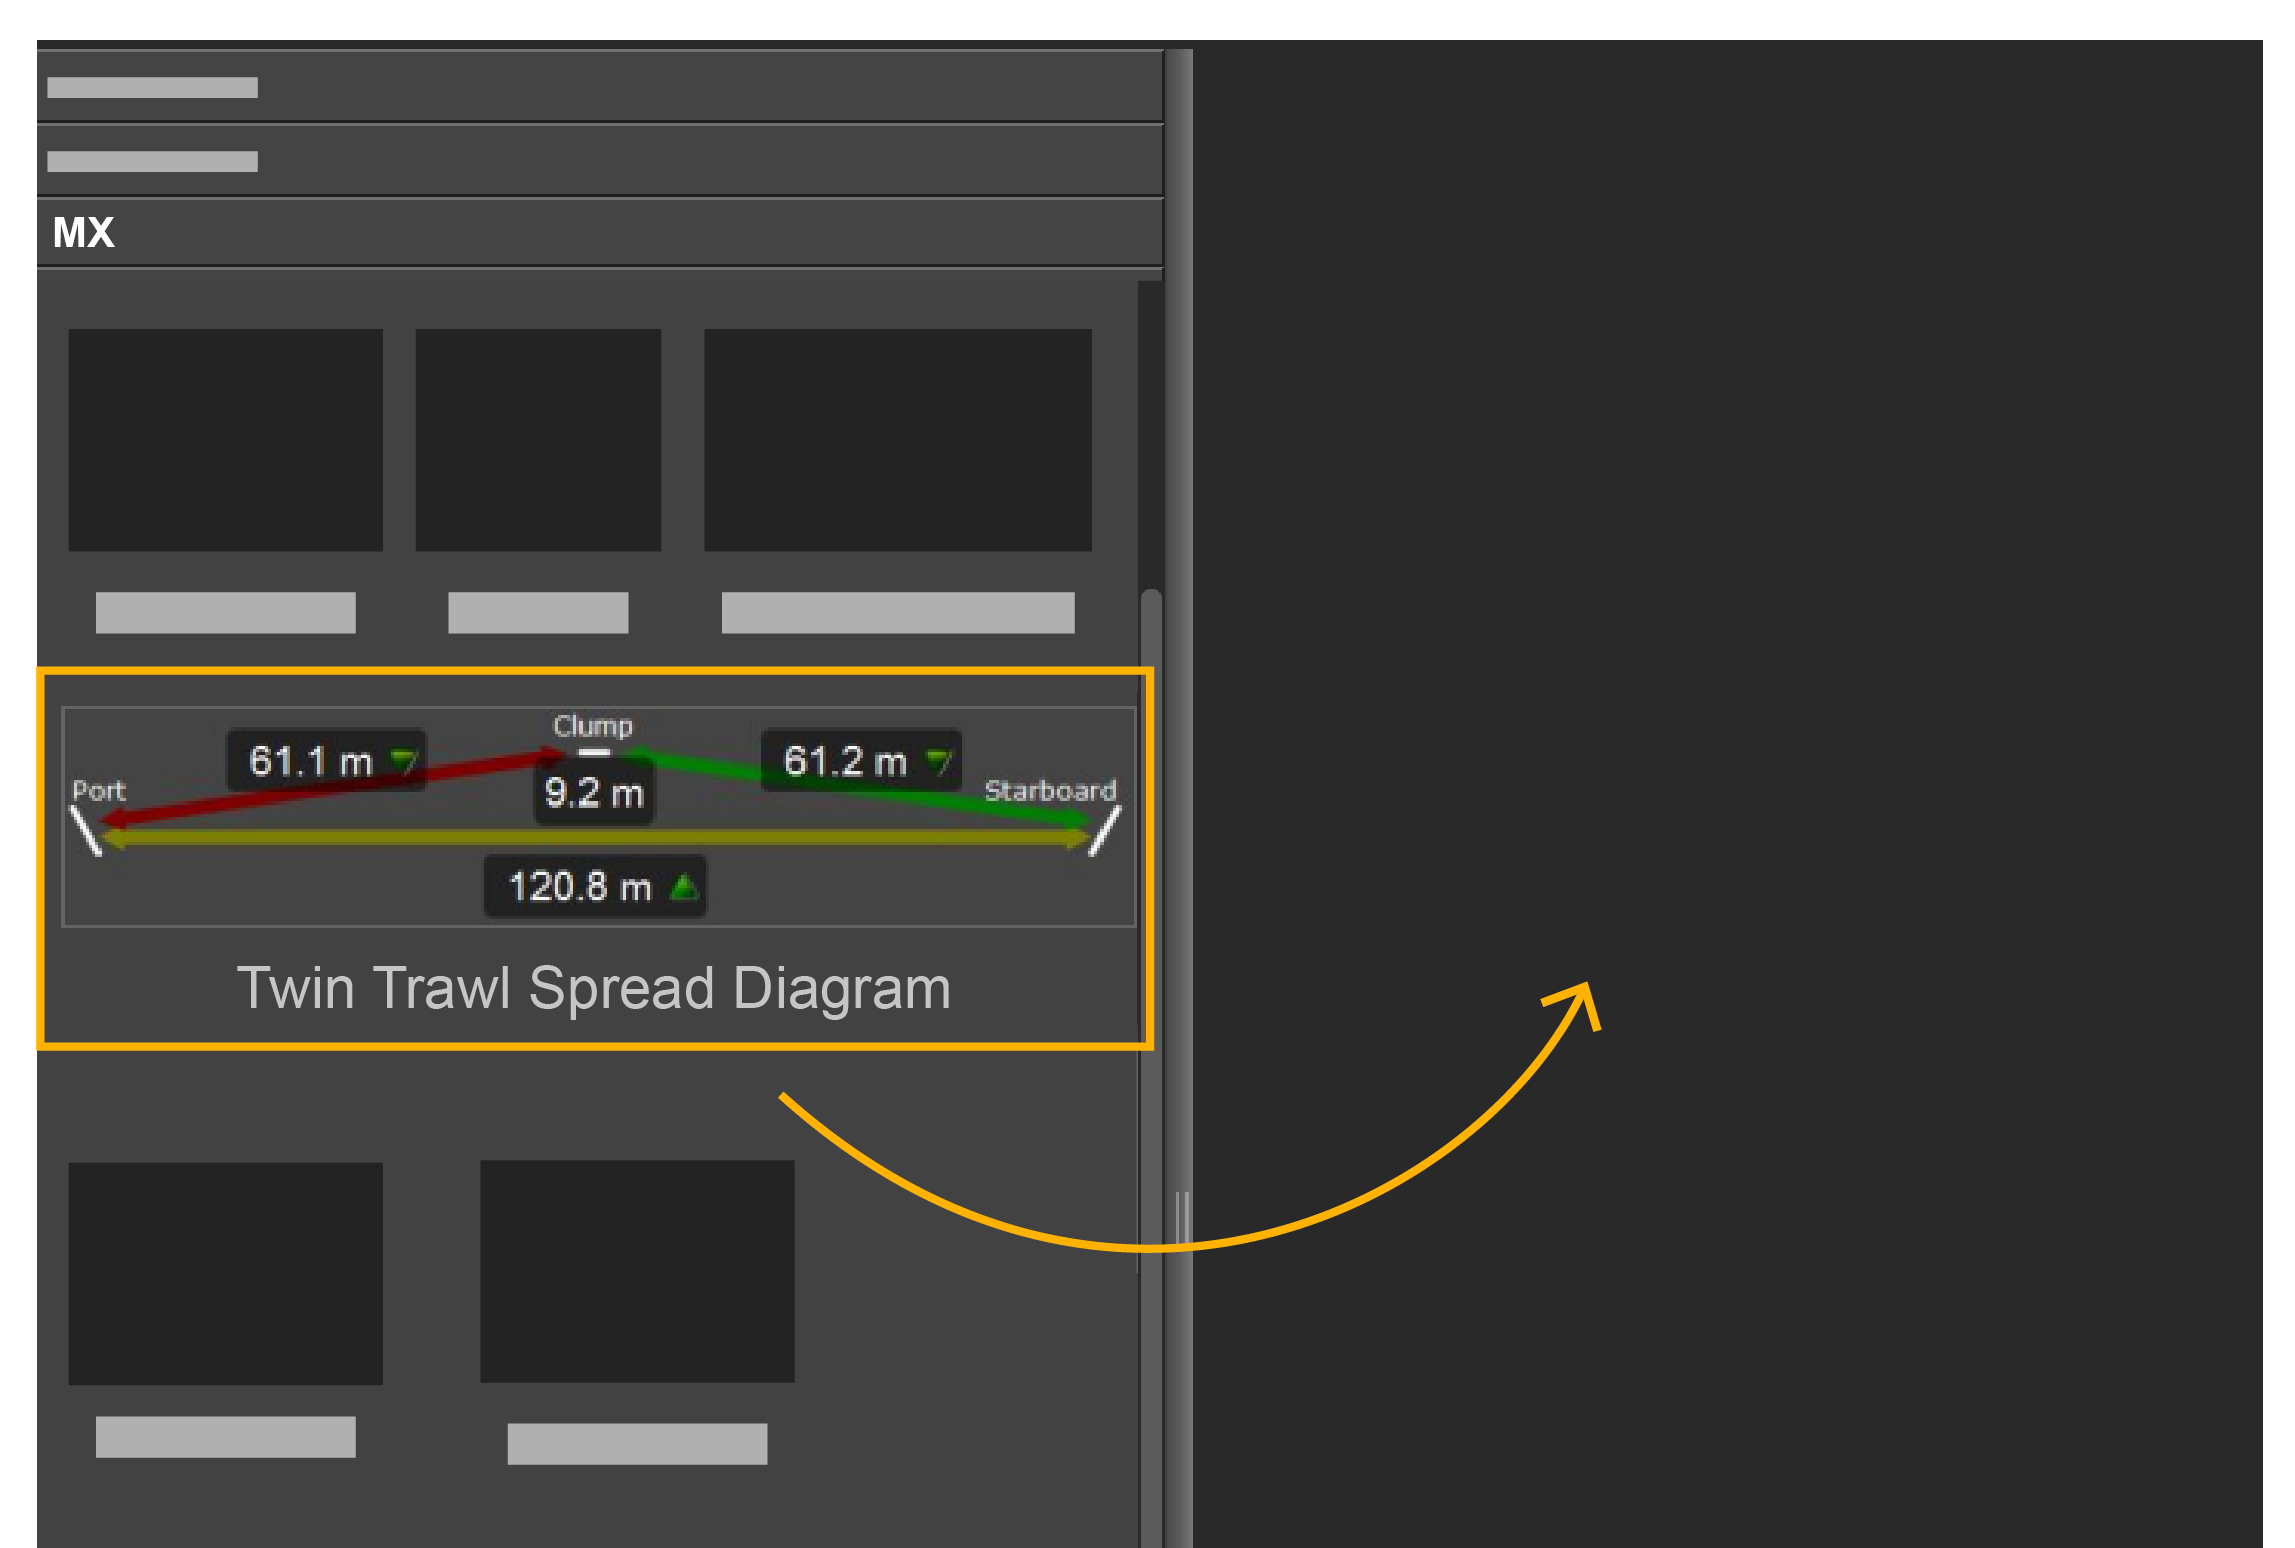
- Or click + drag a Twin trawl Spread
Diagram to only display the
diagram.

Now you can see the distances between:- port door and starboard door,
- port door and clump,
- clump and starboard door.
Note: Right-click the plot and click Single Trawl Spread Plot if you need to switch to single trawl. - Click + drag a Twin Trawl Spread
Plot to the page. You
can know if the clump is centered when the yellow dashed line is above
the red and green lines.
-
If you have twin trawls with 3 measured distances: drag to
the page one spread distance such as a Spread Master Distance to
Stbd, then right-click the plot and click Twin Trawl
Spread Plot.
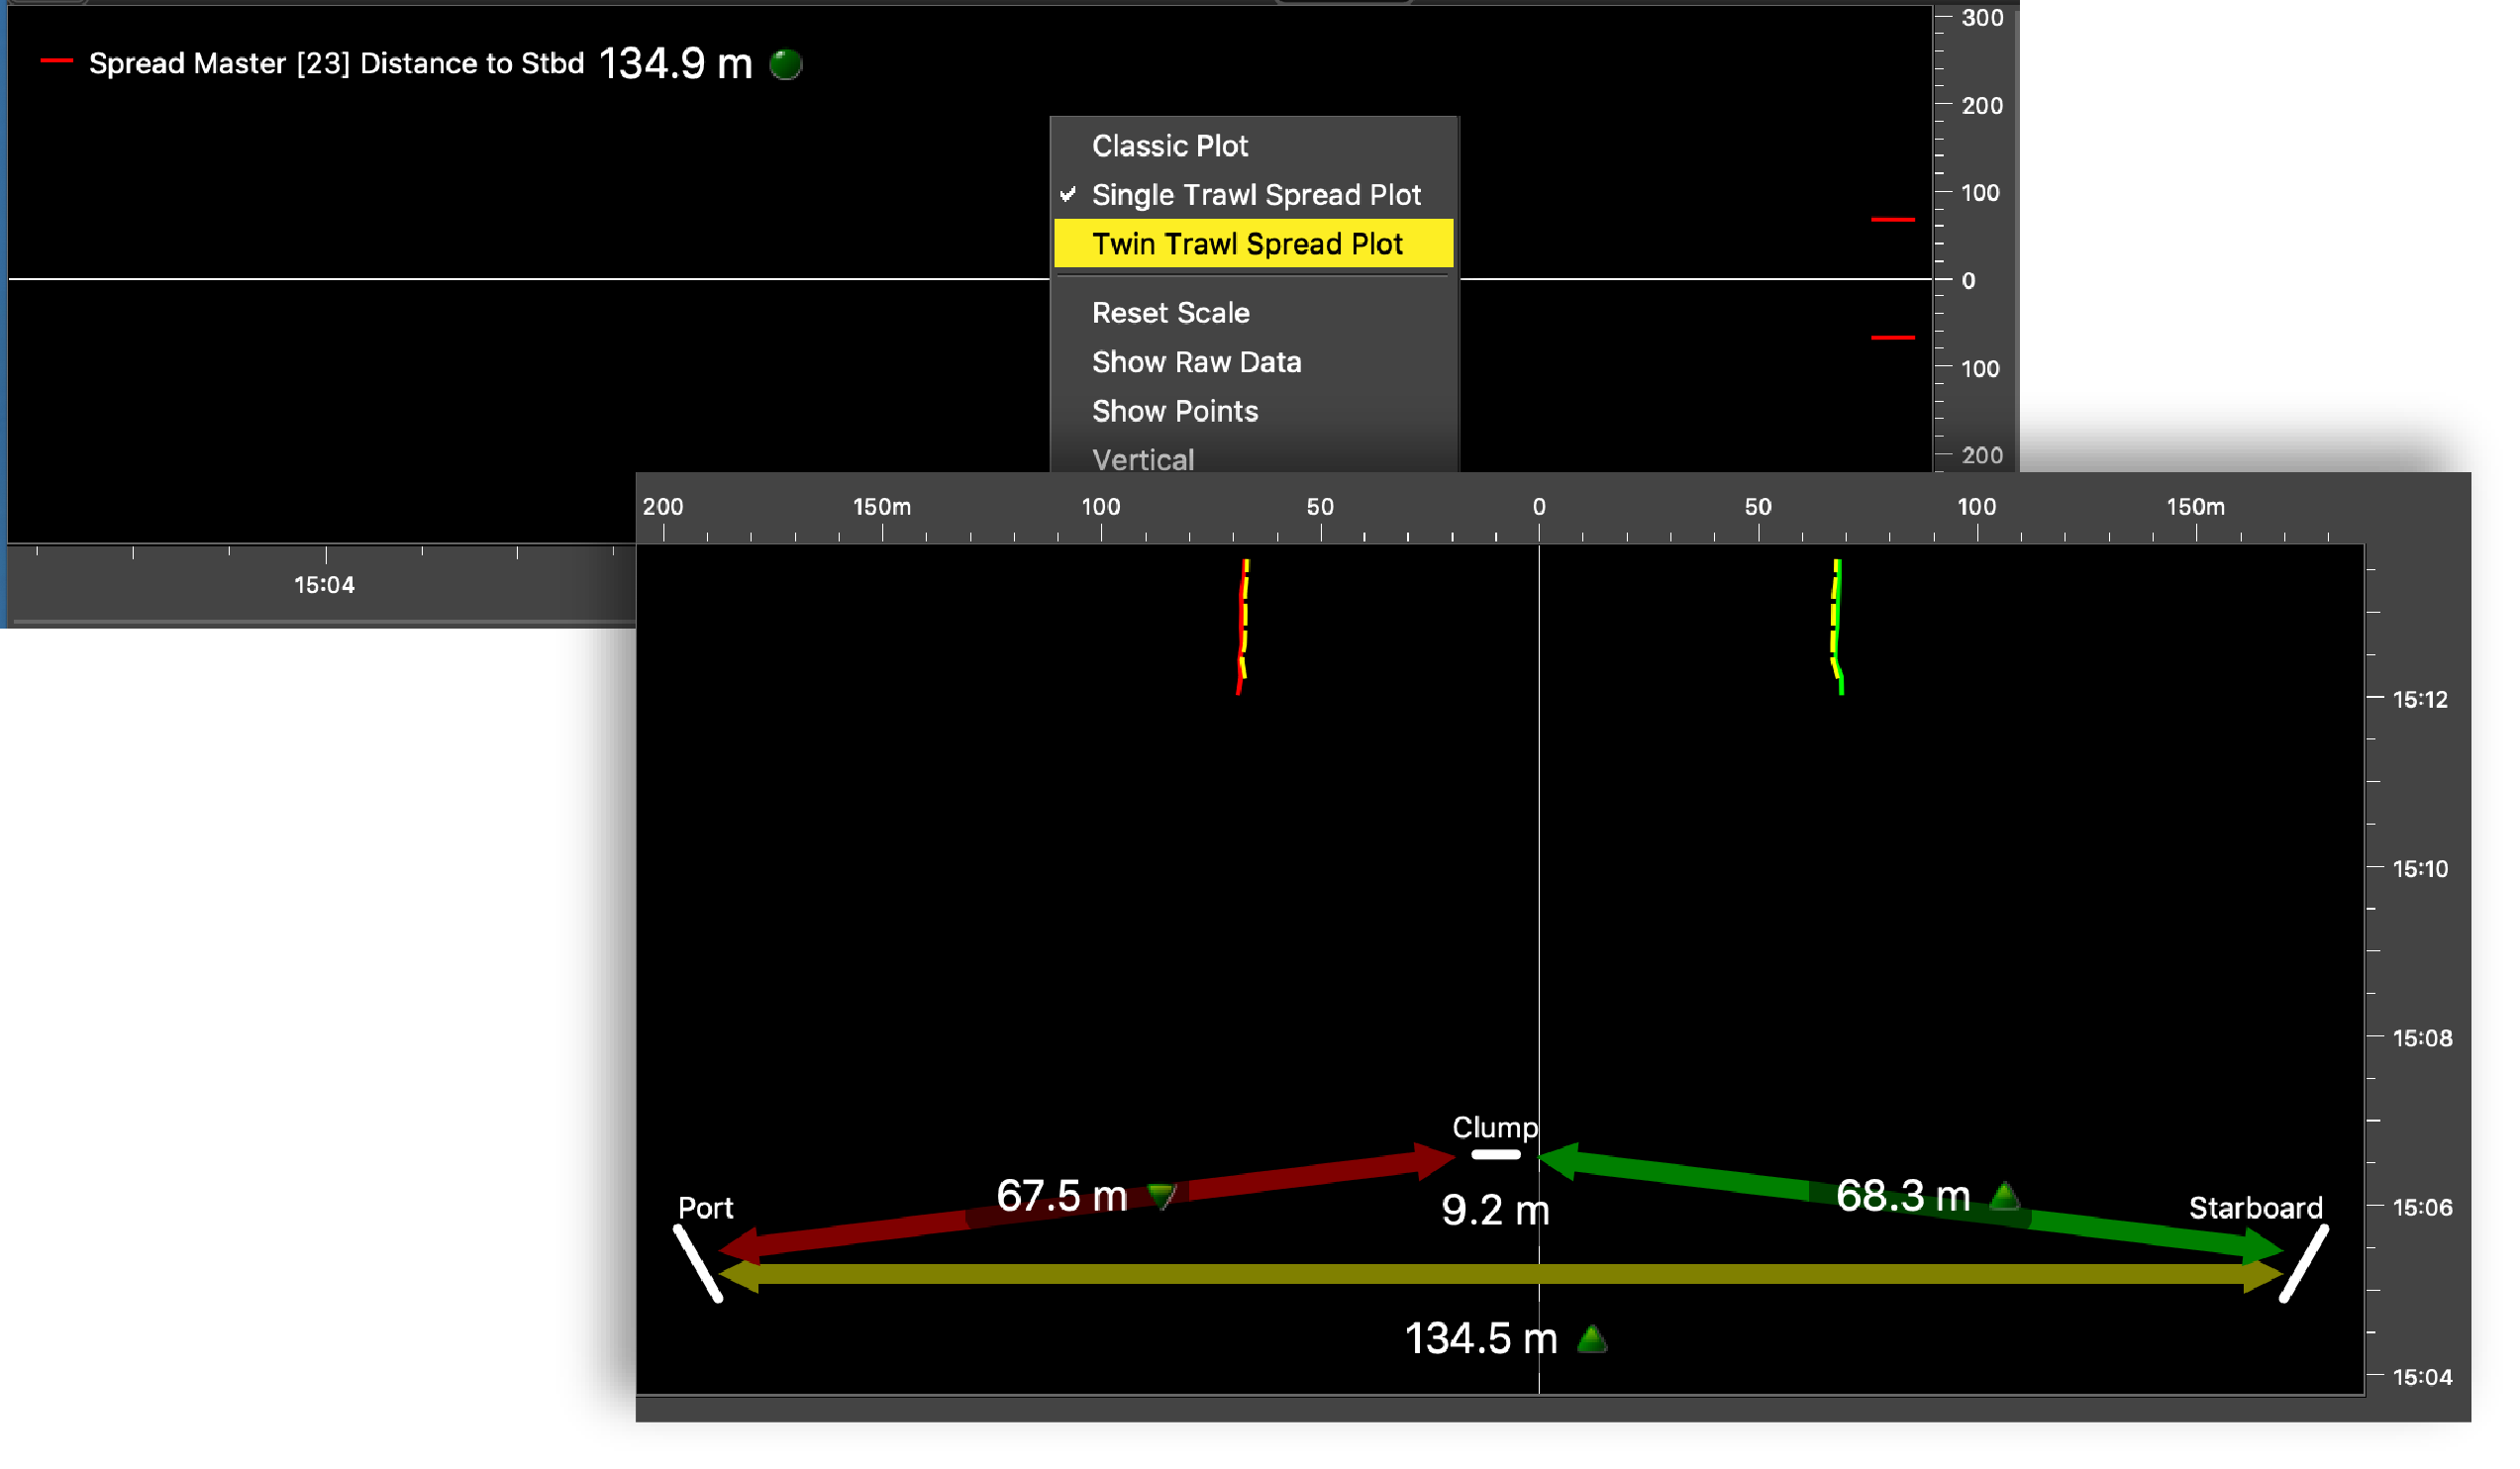
You now have an history plot and a diagram displaying the distance between:- port door and starboard door,
- port door and clump,
- clump and starboard door.
You can know if the clump is centered when the yellow dashed line is above the red and green lines.
Note: Right-click the diagram and click Single Trawl Spread Plot if you need to switch to single trawl. -
You can also find the diagram for triple distance in the
control panels: click Customize, then drag the
Twin Trawl Spread Diagram to the page.
The diagram is displayed. -
Deactivate the Customize mode when you have finished
customizing pages: click Menu > Customize again.
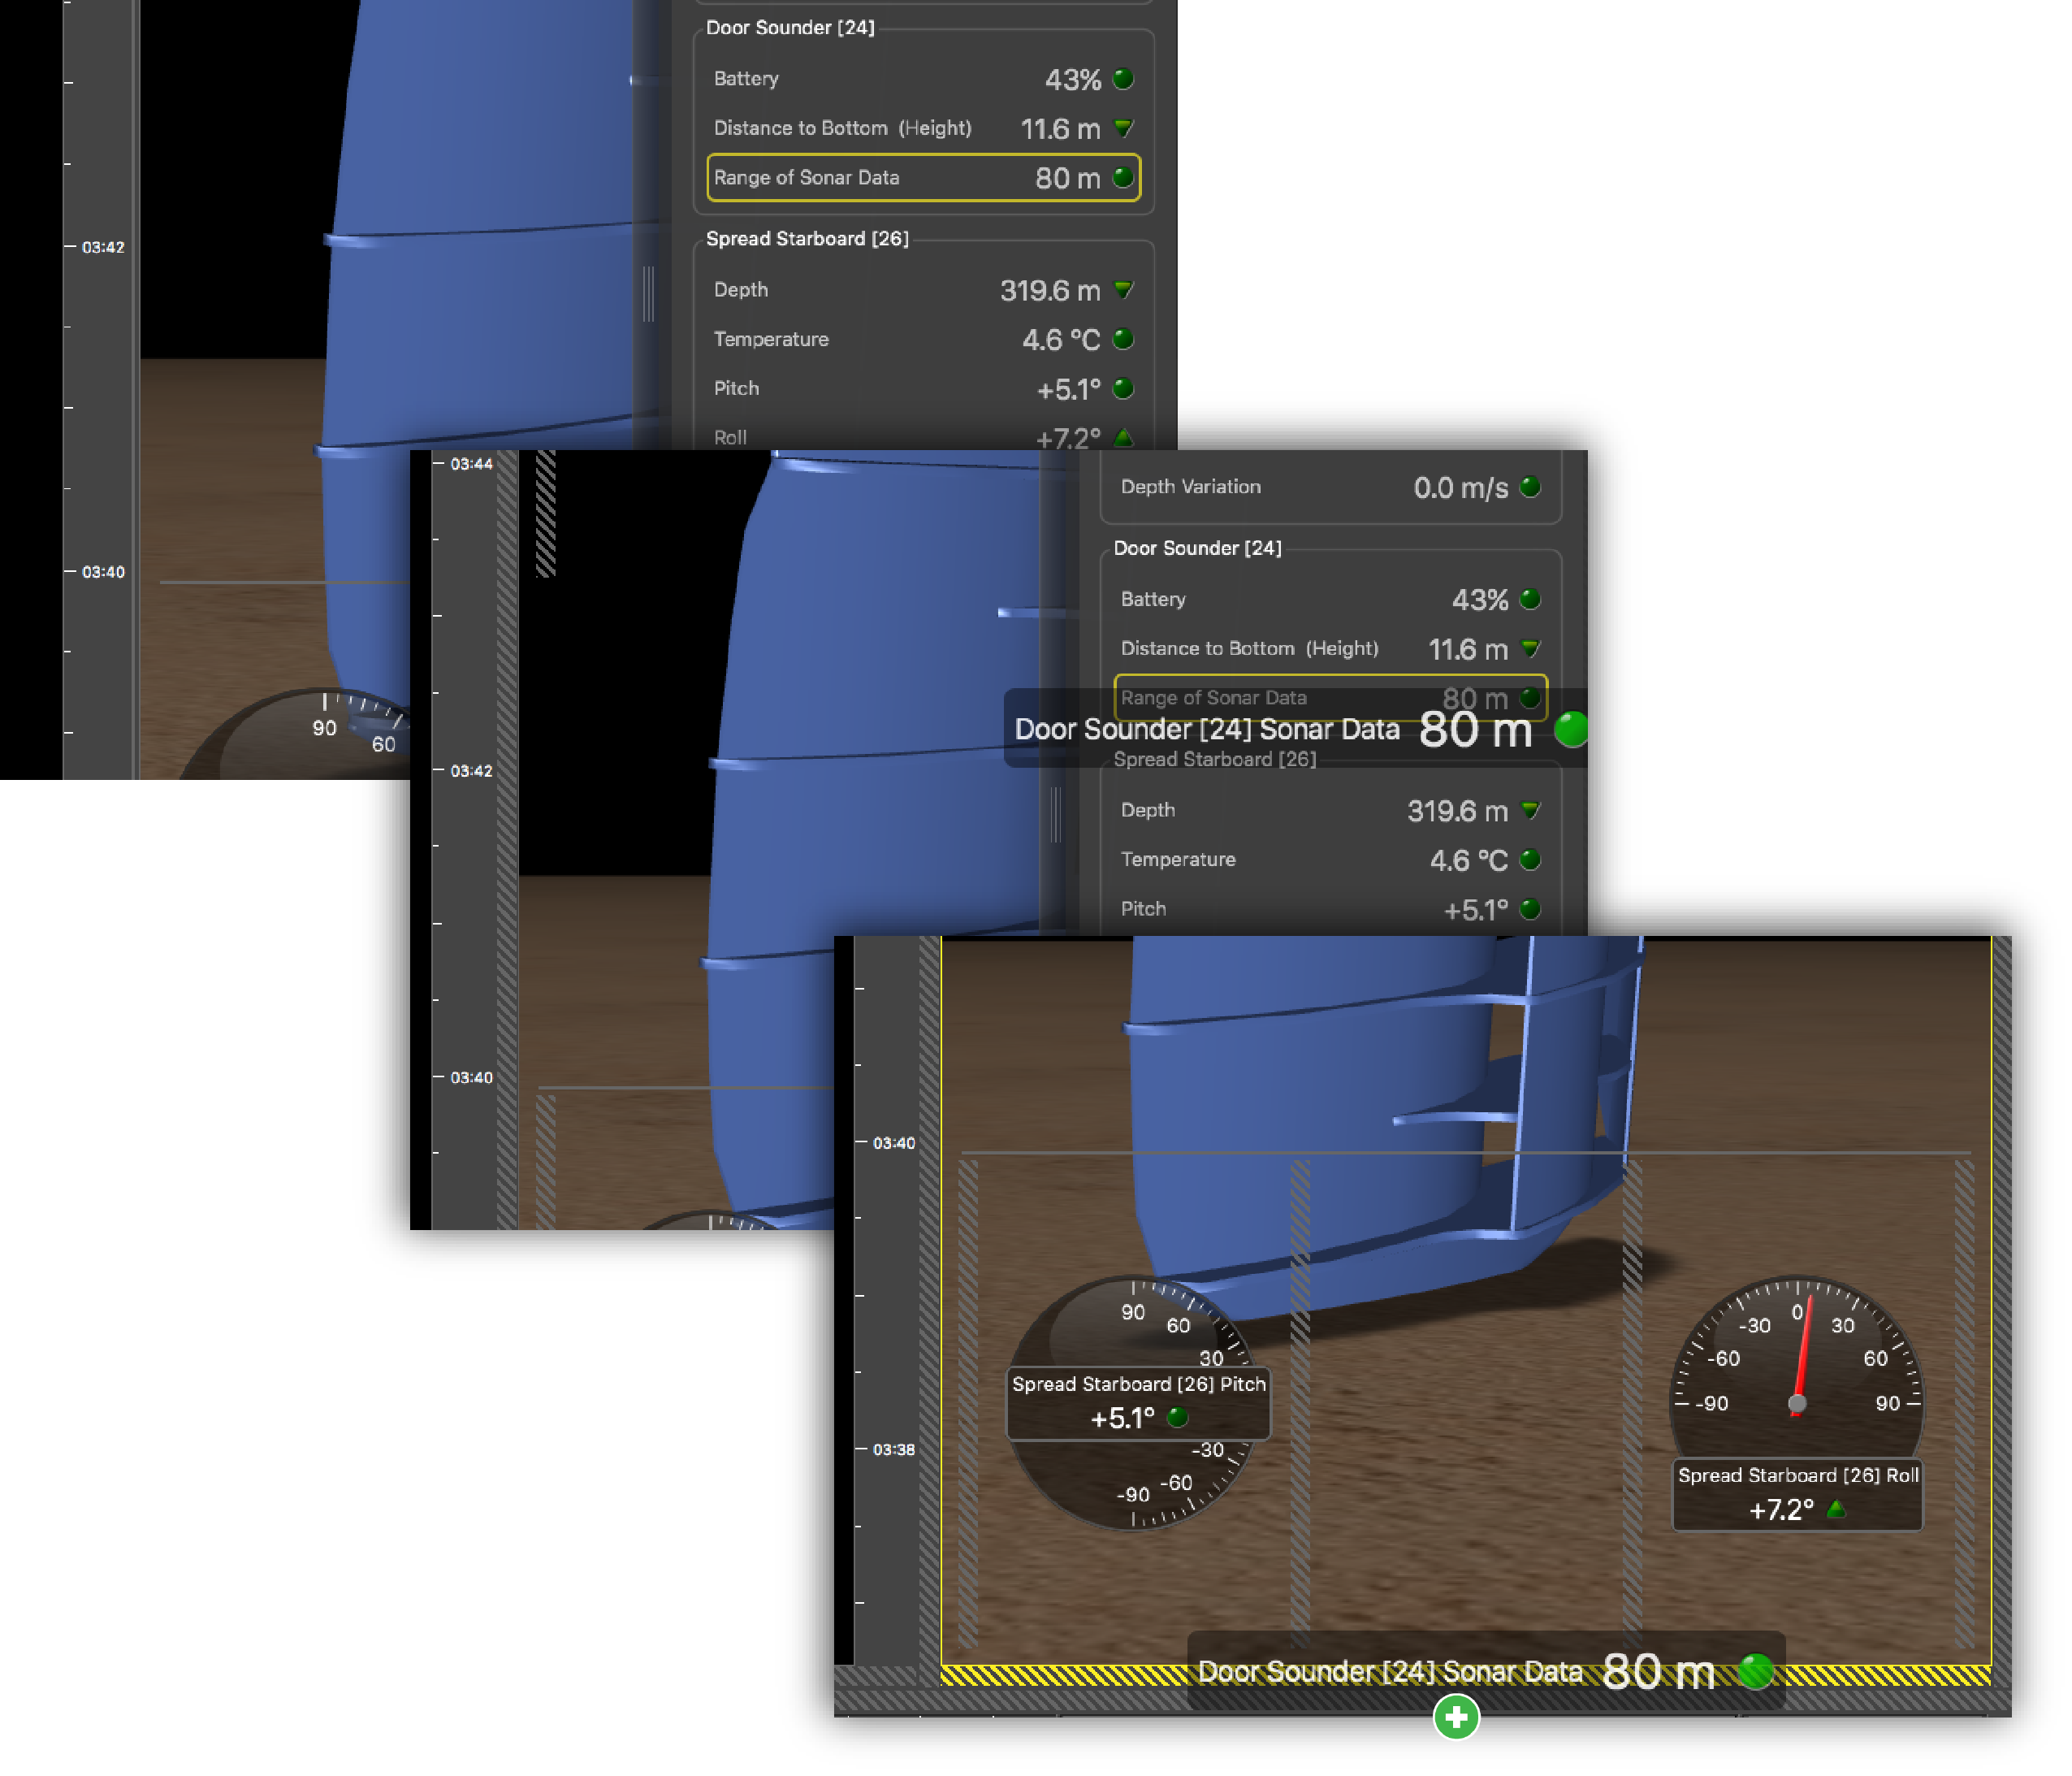
Displaying Door Sounder Echograms
You can display echograms from Door Sounder sensors in order to see how doors are placed above the sea bottom.
Procedure
-
From the top left corner of the screen, click Menu > Customize and enter the password
eureka.
-
Go to the control panels and from the Mx tab,In , click + hold Sonar Data from a Door Sounder or Bottom Explorer (Door Sounder with target strength calibration) and drag
it to the page display.
The echogram is displayed.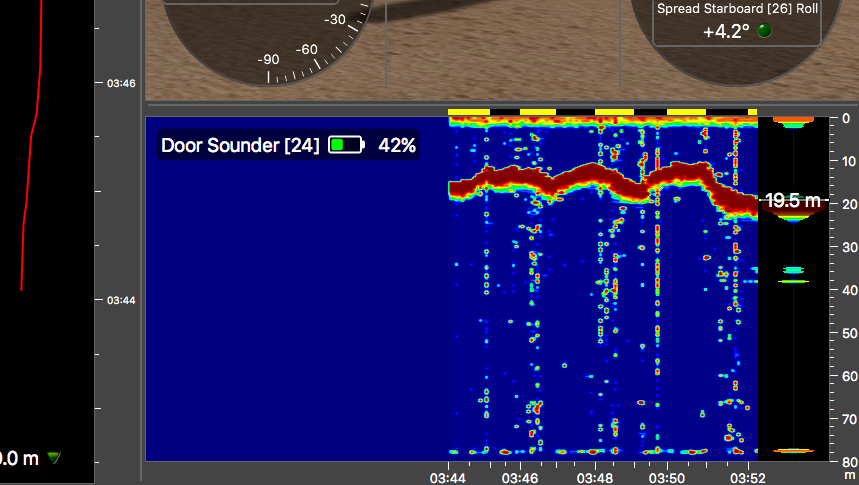
-
Deactivate the Customize mode when you have finished
customizing pages: click Menu > Customize again.
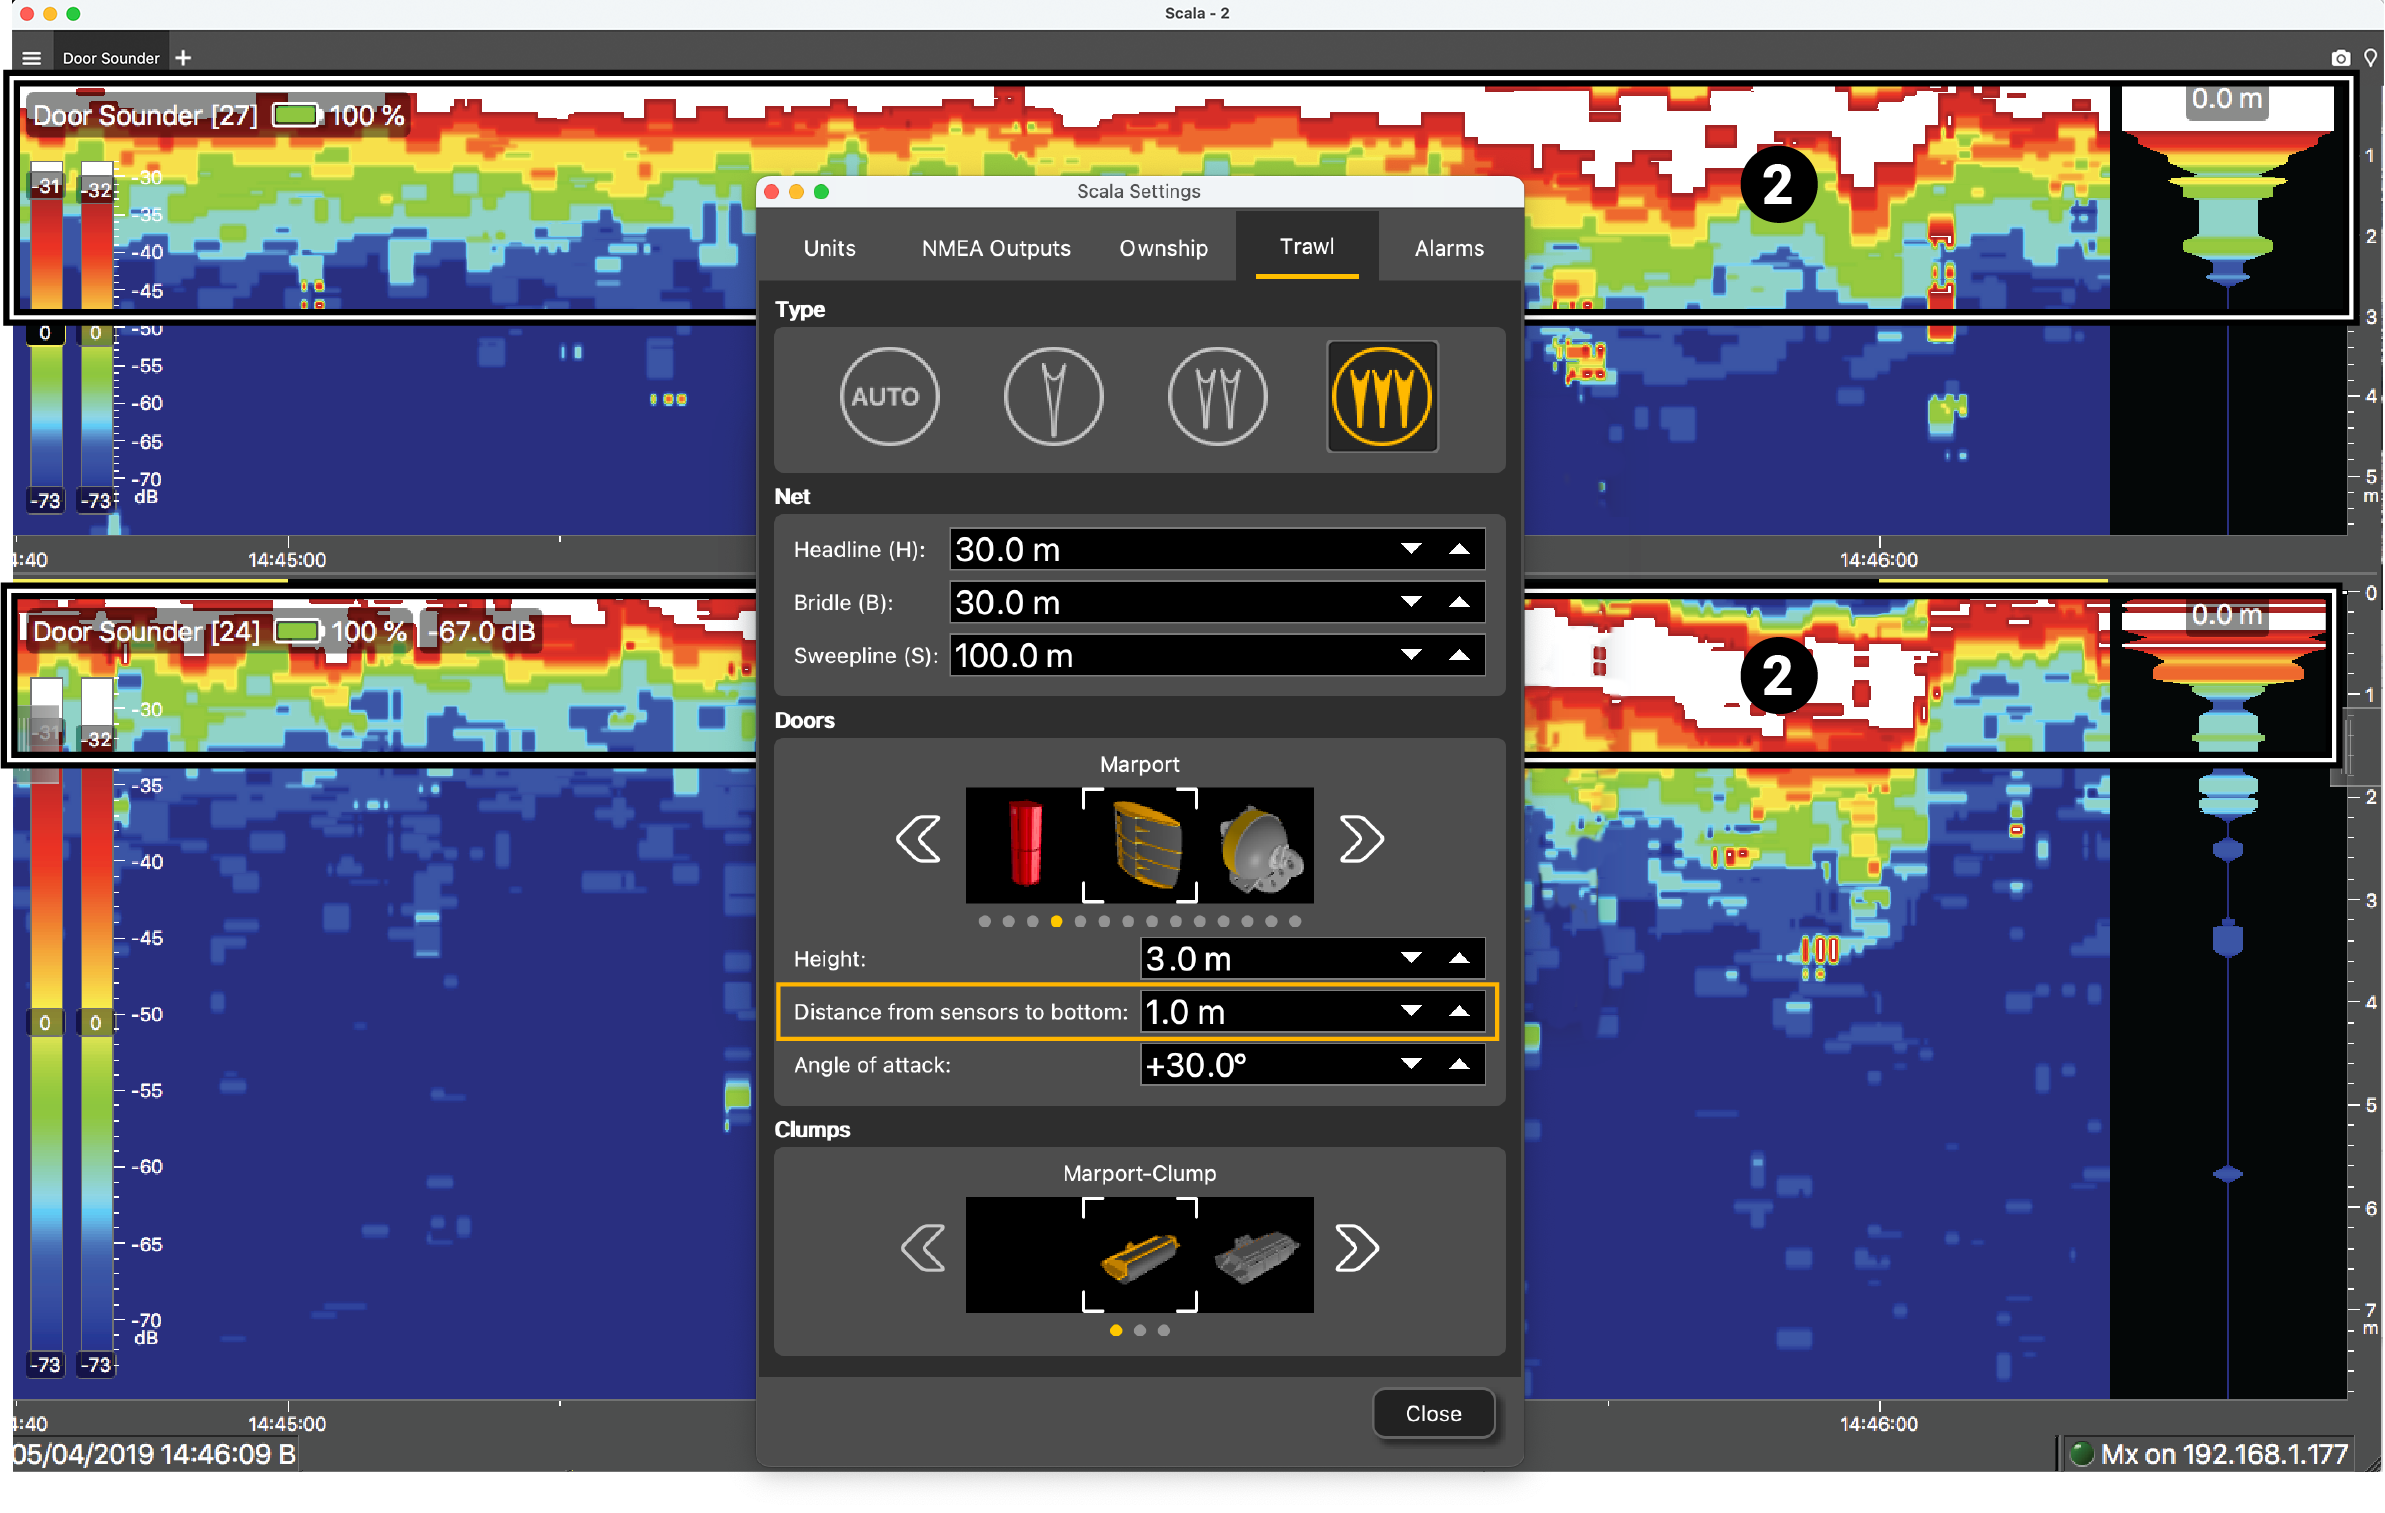
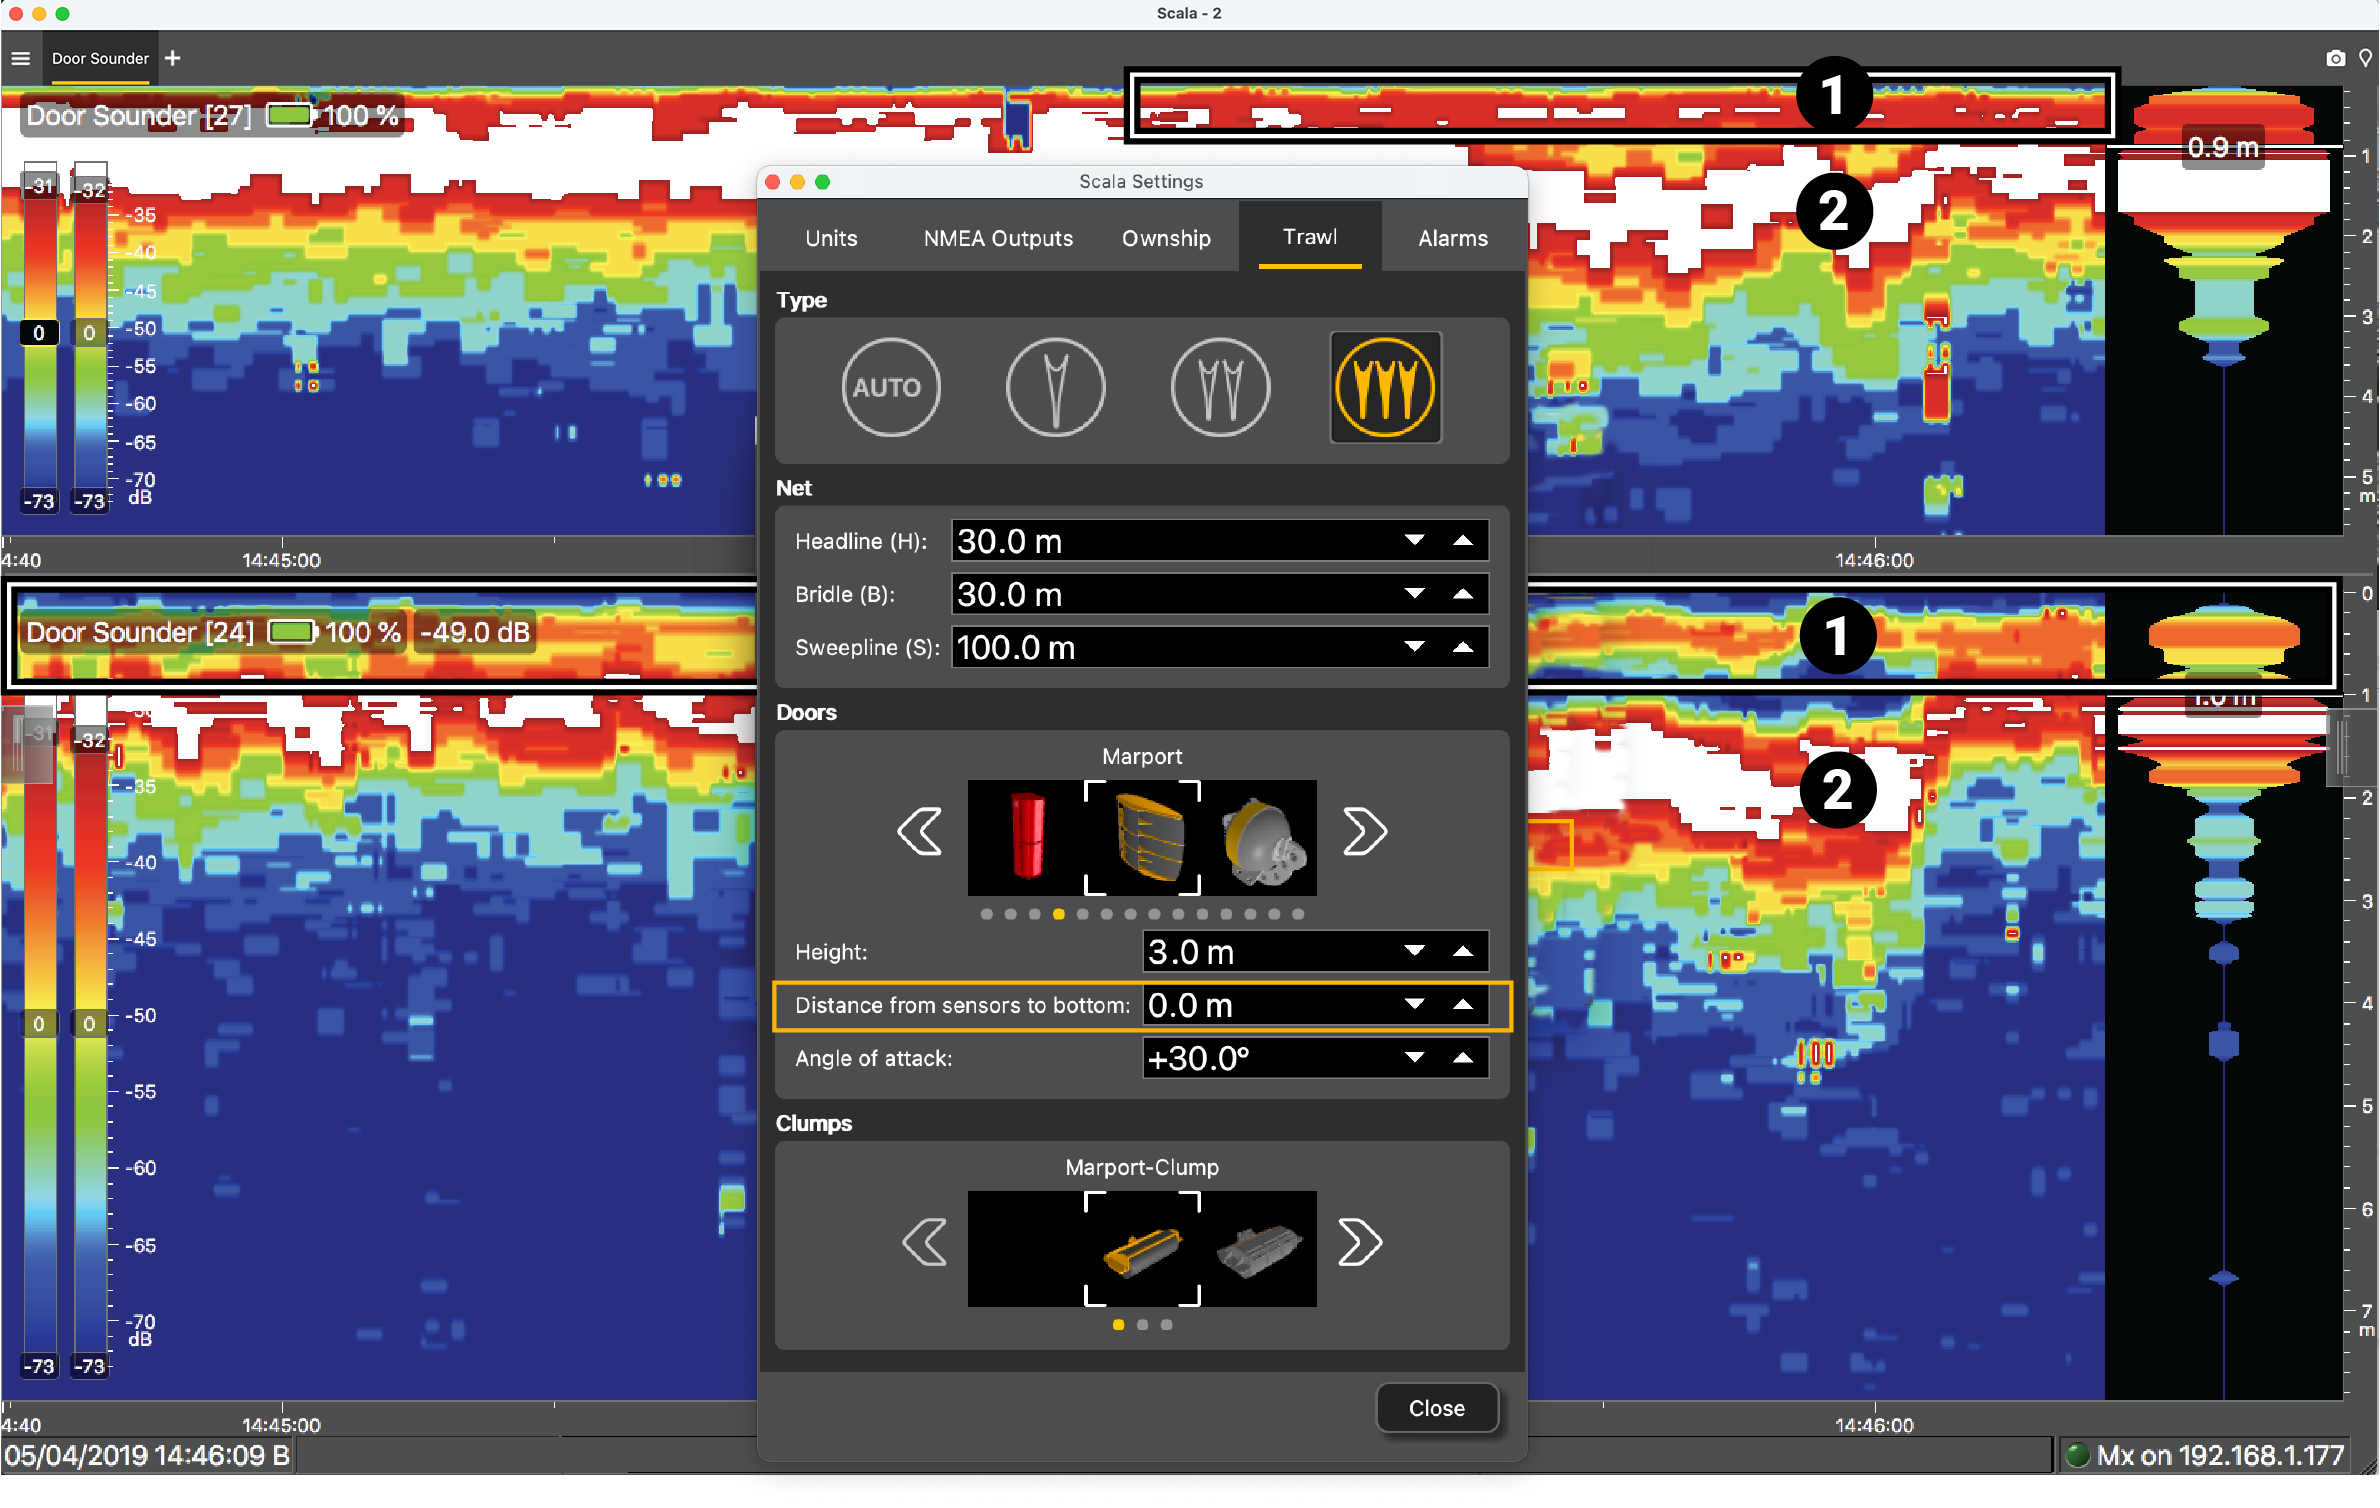
 Changing the Distance from the Door Sounder to the Bottom
You can change the distance at which the Door Sounder echogram begins.
About this task
- Have distance to bottom values beginning from the shoes, instead of from the sensor position.
- Remove the echo of the shoes from the echogram
Procedure
-
Click Menu > Settings, then go to the
Trawl tab.
-
In , enter the distance of the Door Sounder
sensors from the door shoes.
The echoes of the shoes do not appear anymore on the echogram.The image below shows the default echogram from Door Sounder sensors. You can see that the echoes of the shoes (1) appear above the echo of the ground (2).
 The image below shows the echogram received from Door Sounder sensors when a distance is added. Now, you can only see the echo of the ground (2).