Configuring Sensor Display on Scala2
You can display on pages in Scala2 measurements (e.g. speed, pitch and roll...) taken by the sensors.
About this task
Sensor measurements are displayed in the control panels, under Sensors DataMx. Data title should be:
- TE/TS for a Speed Explorer
- Trawl Speed or 3N1 (from Scala2 version 01.06.06) for Symmetry, Grid and Trawl Speed sensors.
The title is followed by the node where the sensor was placed when added to the system. Data displayed (e.g. pitch & roll, water speed) depends on the firmware installed.
Procedure
-
From the top left corner of the screen, click
Menu
 > Customize and enter the password eureka.
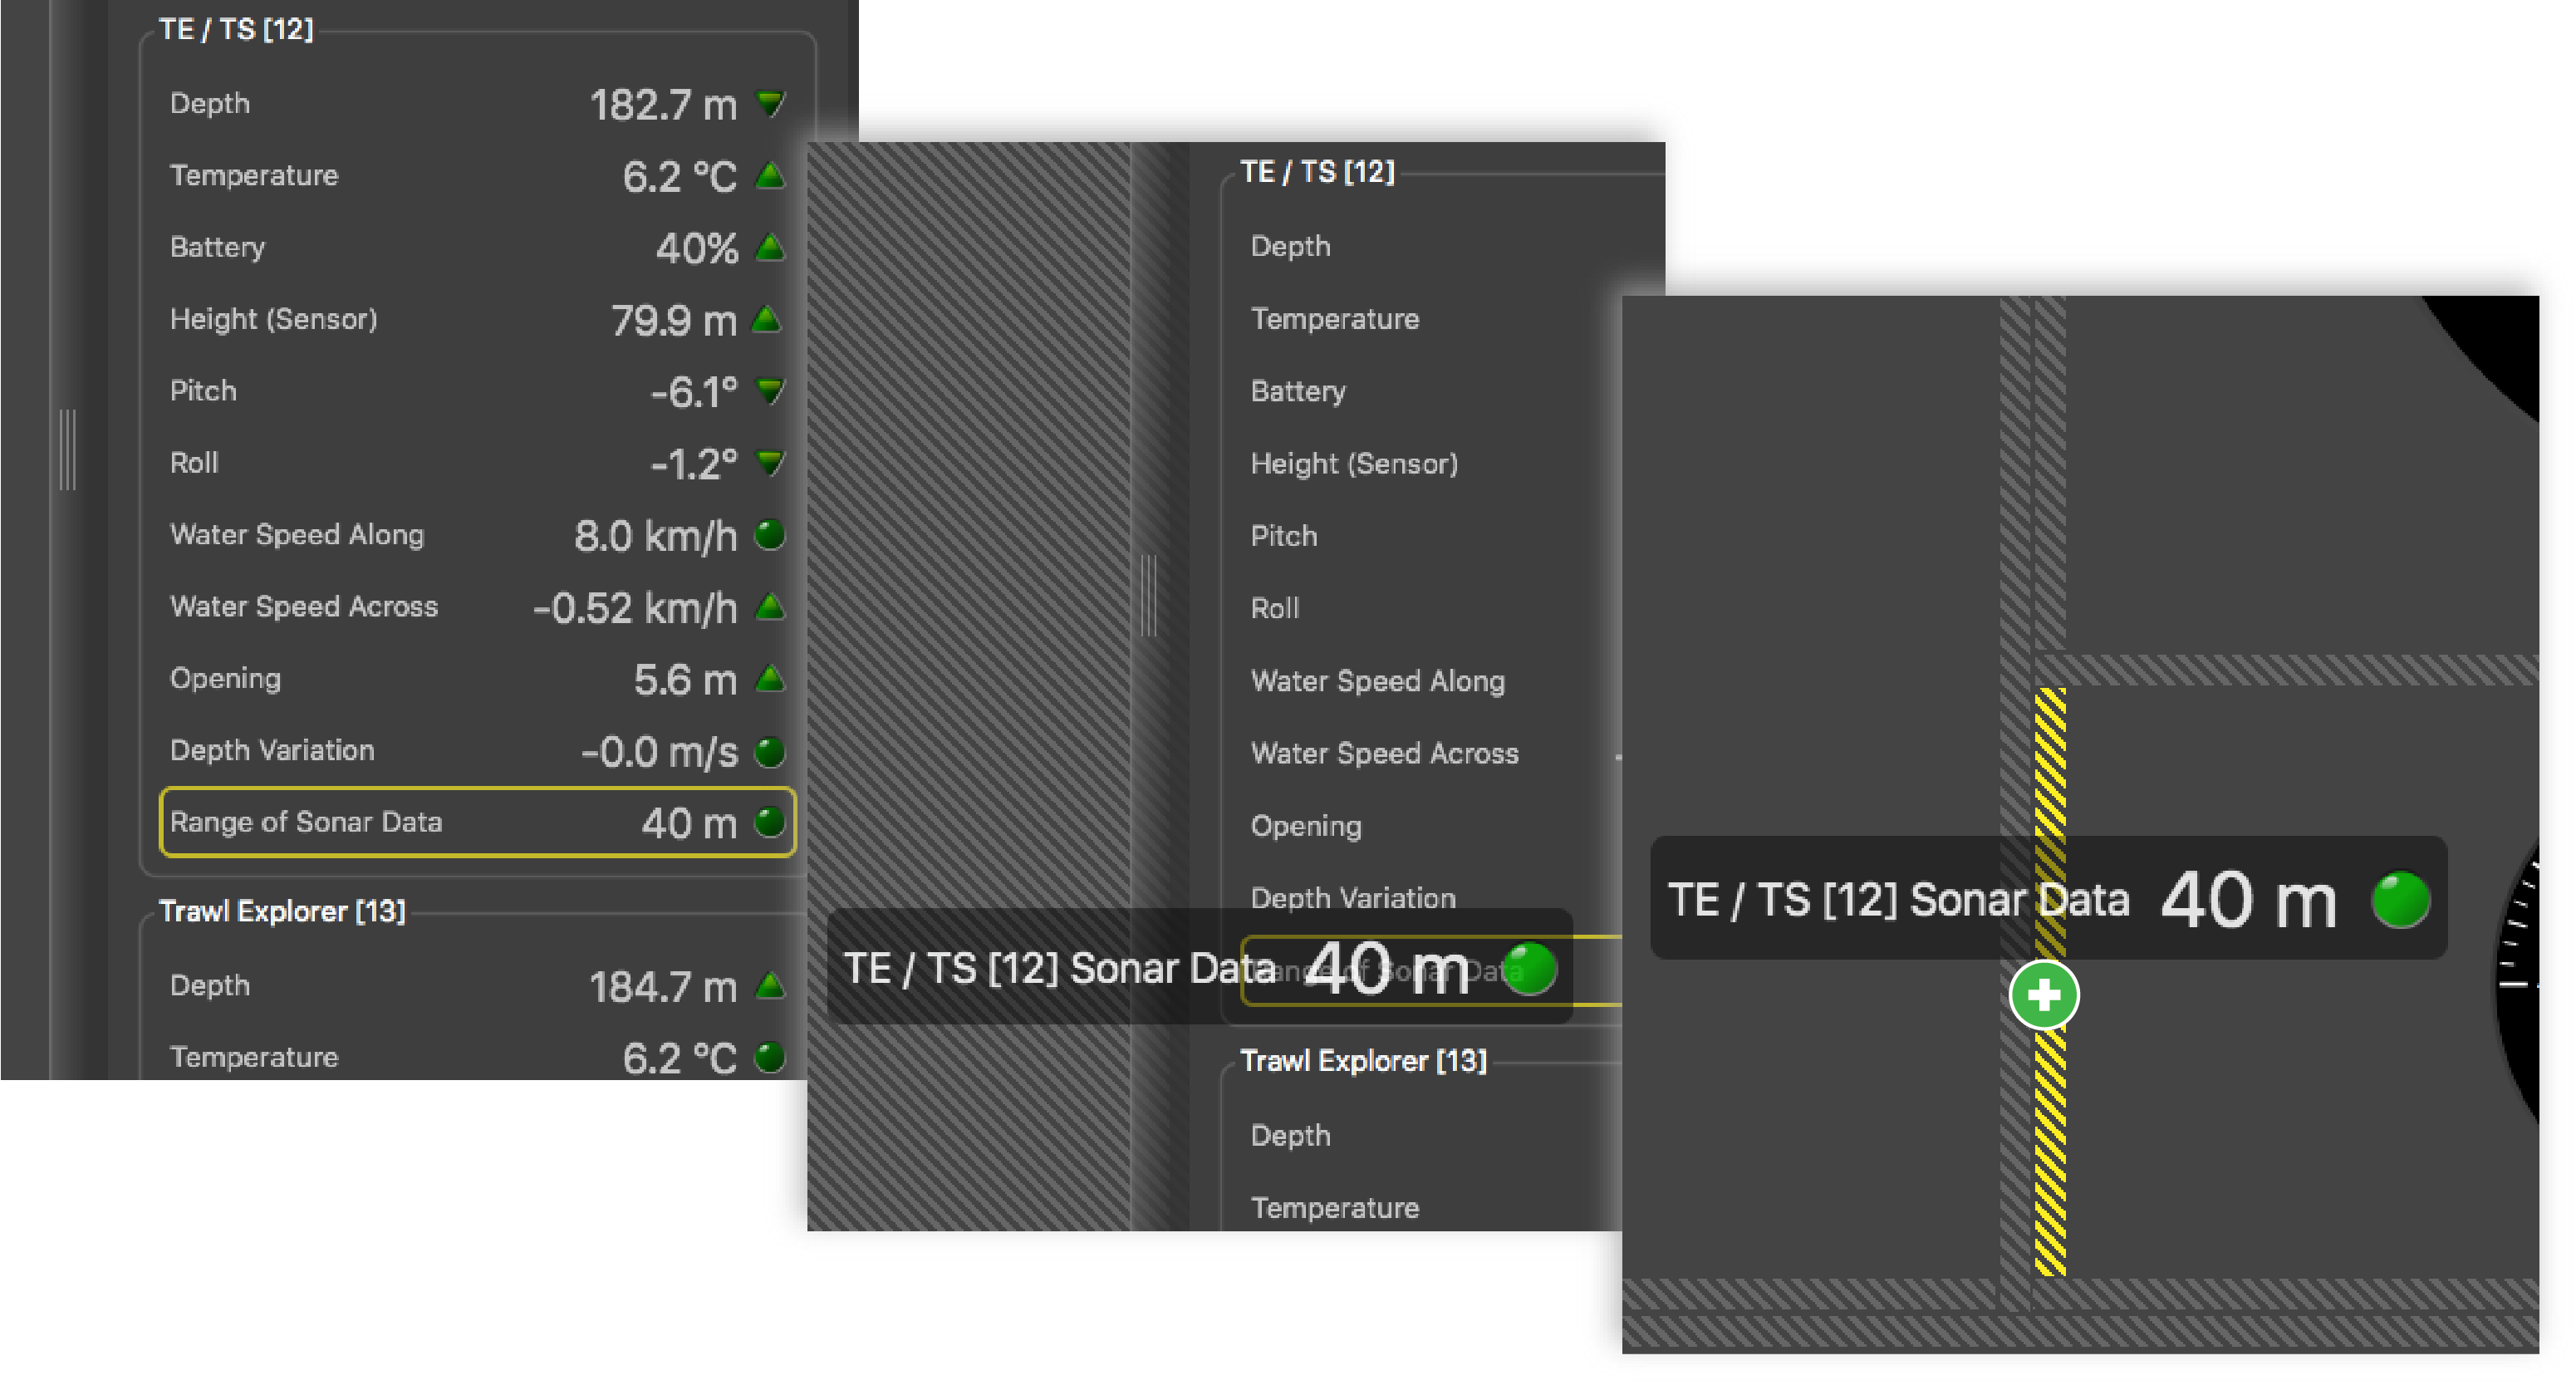
- Open the control panel, then go to Sensors DataMx.
-
Click + drag to a page Sonar Data
to display the echogram of a Speed Explorer.
-
 To display the target strength, from the
top left corner of the echogram, right-click the Speed Explorer
name and select Display Target
Strength. Hover the
mouse over the echogram.
To display the target strength, from the
top left corner of the echogram, right-click the Speed Explorer
name and select Display Target
Strength. Hover the
mouse over the echogram.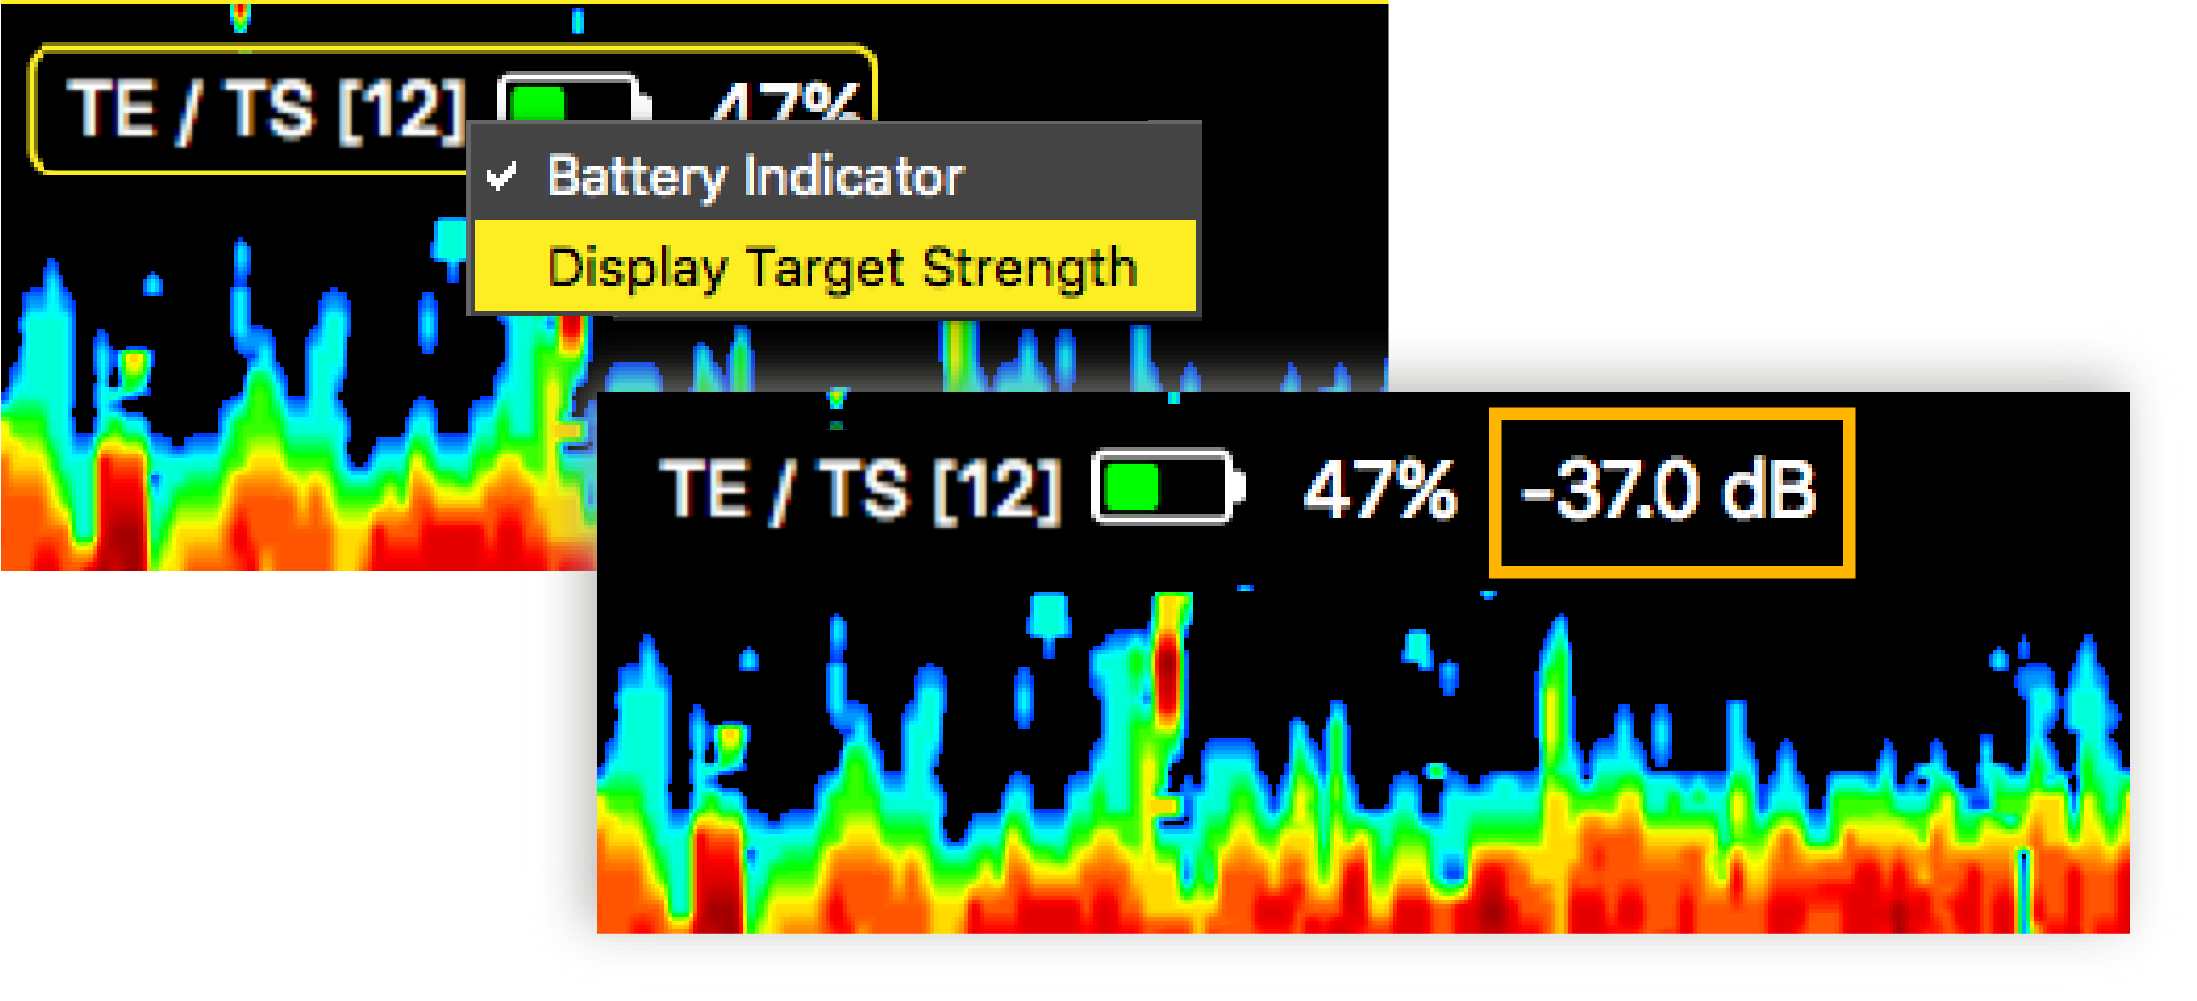 The target strength of the element where you place your mouse is displayed next to the Speed Explorer name. The higher the target strength, the bigger the target.
 -
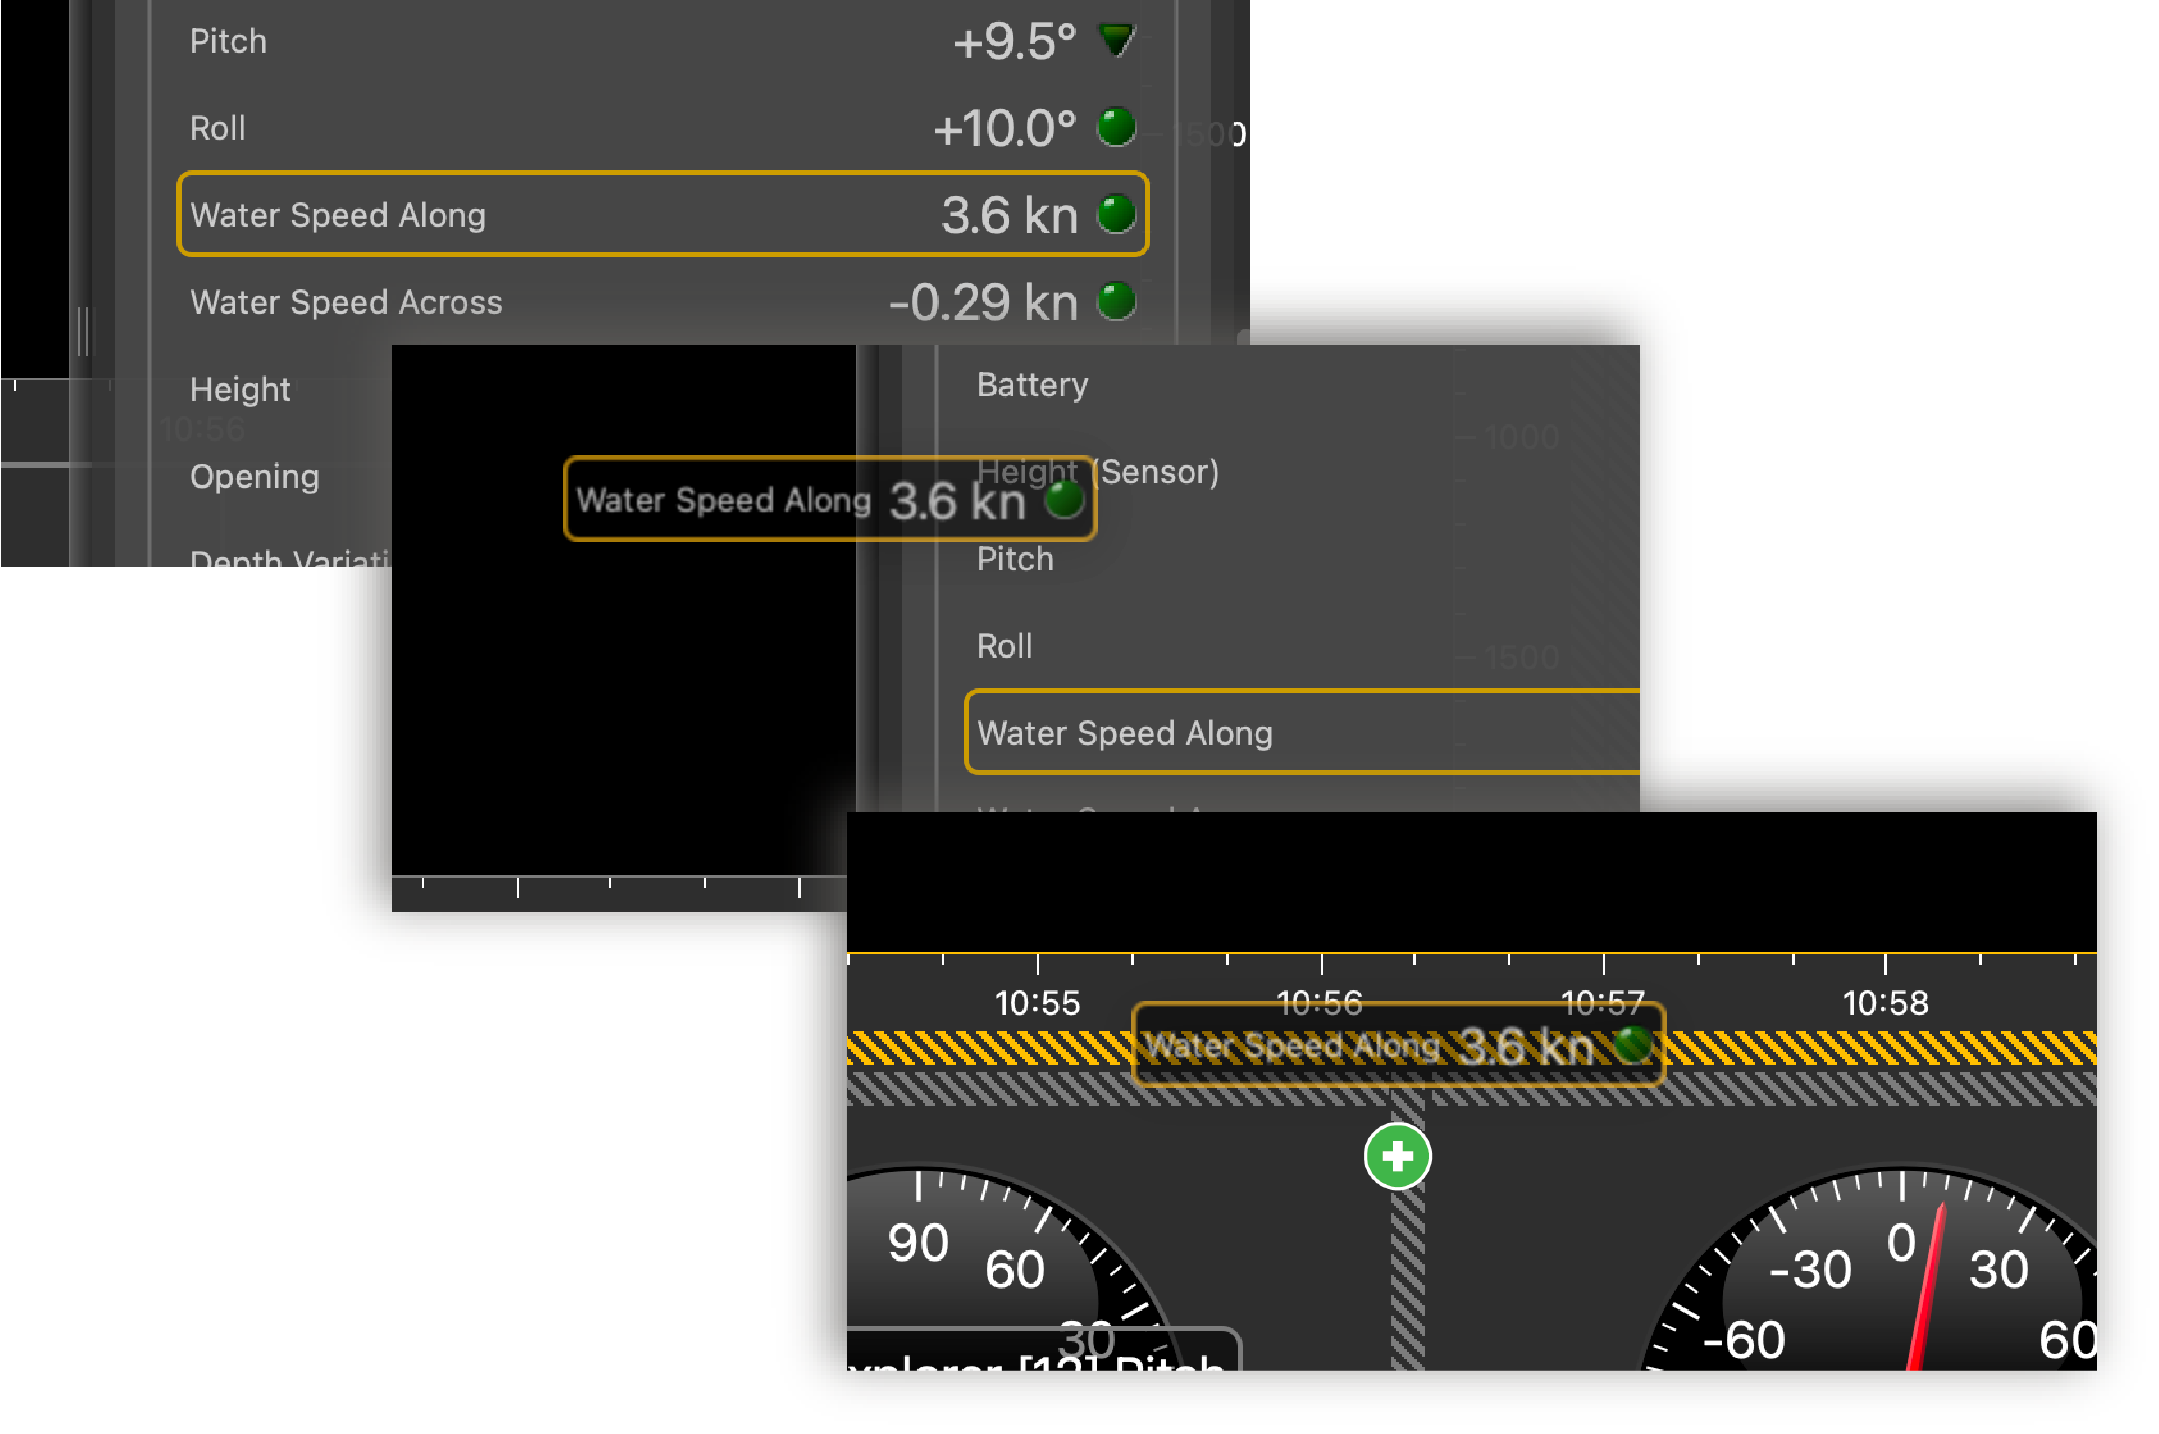
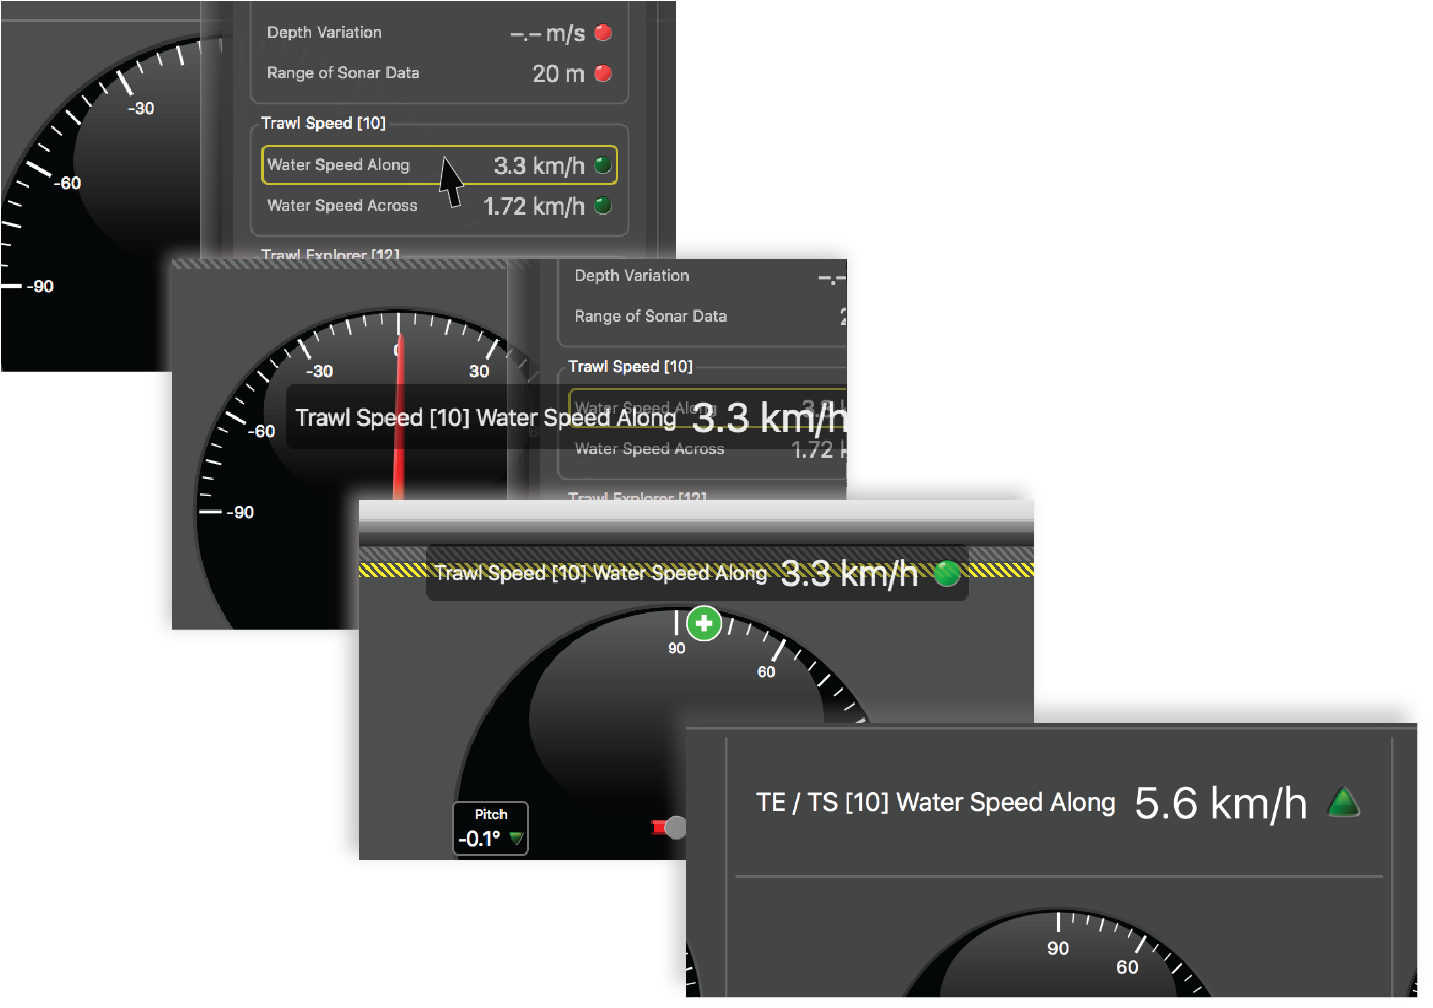
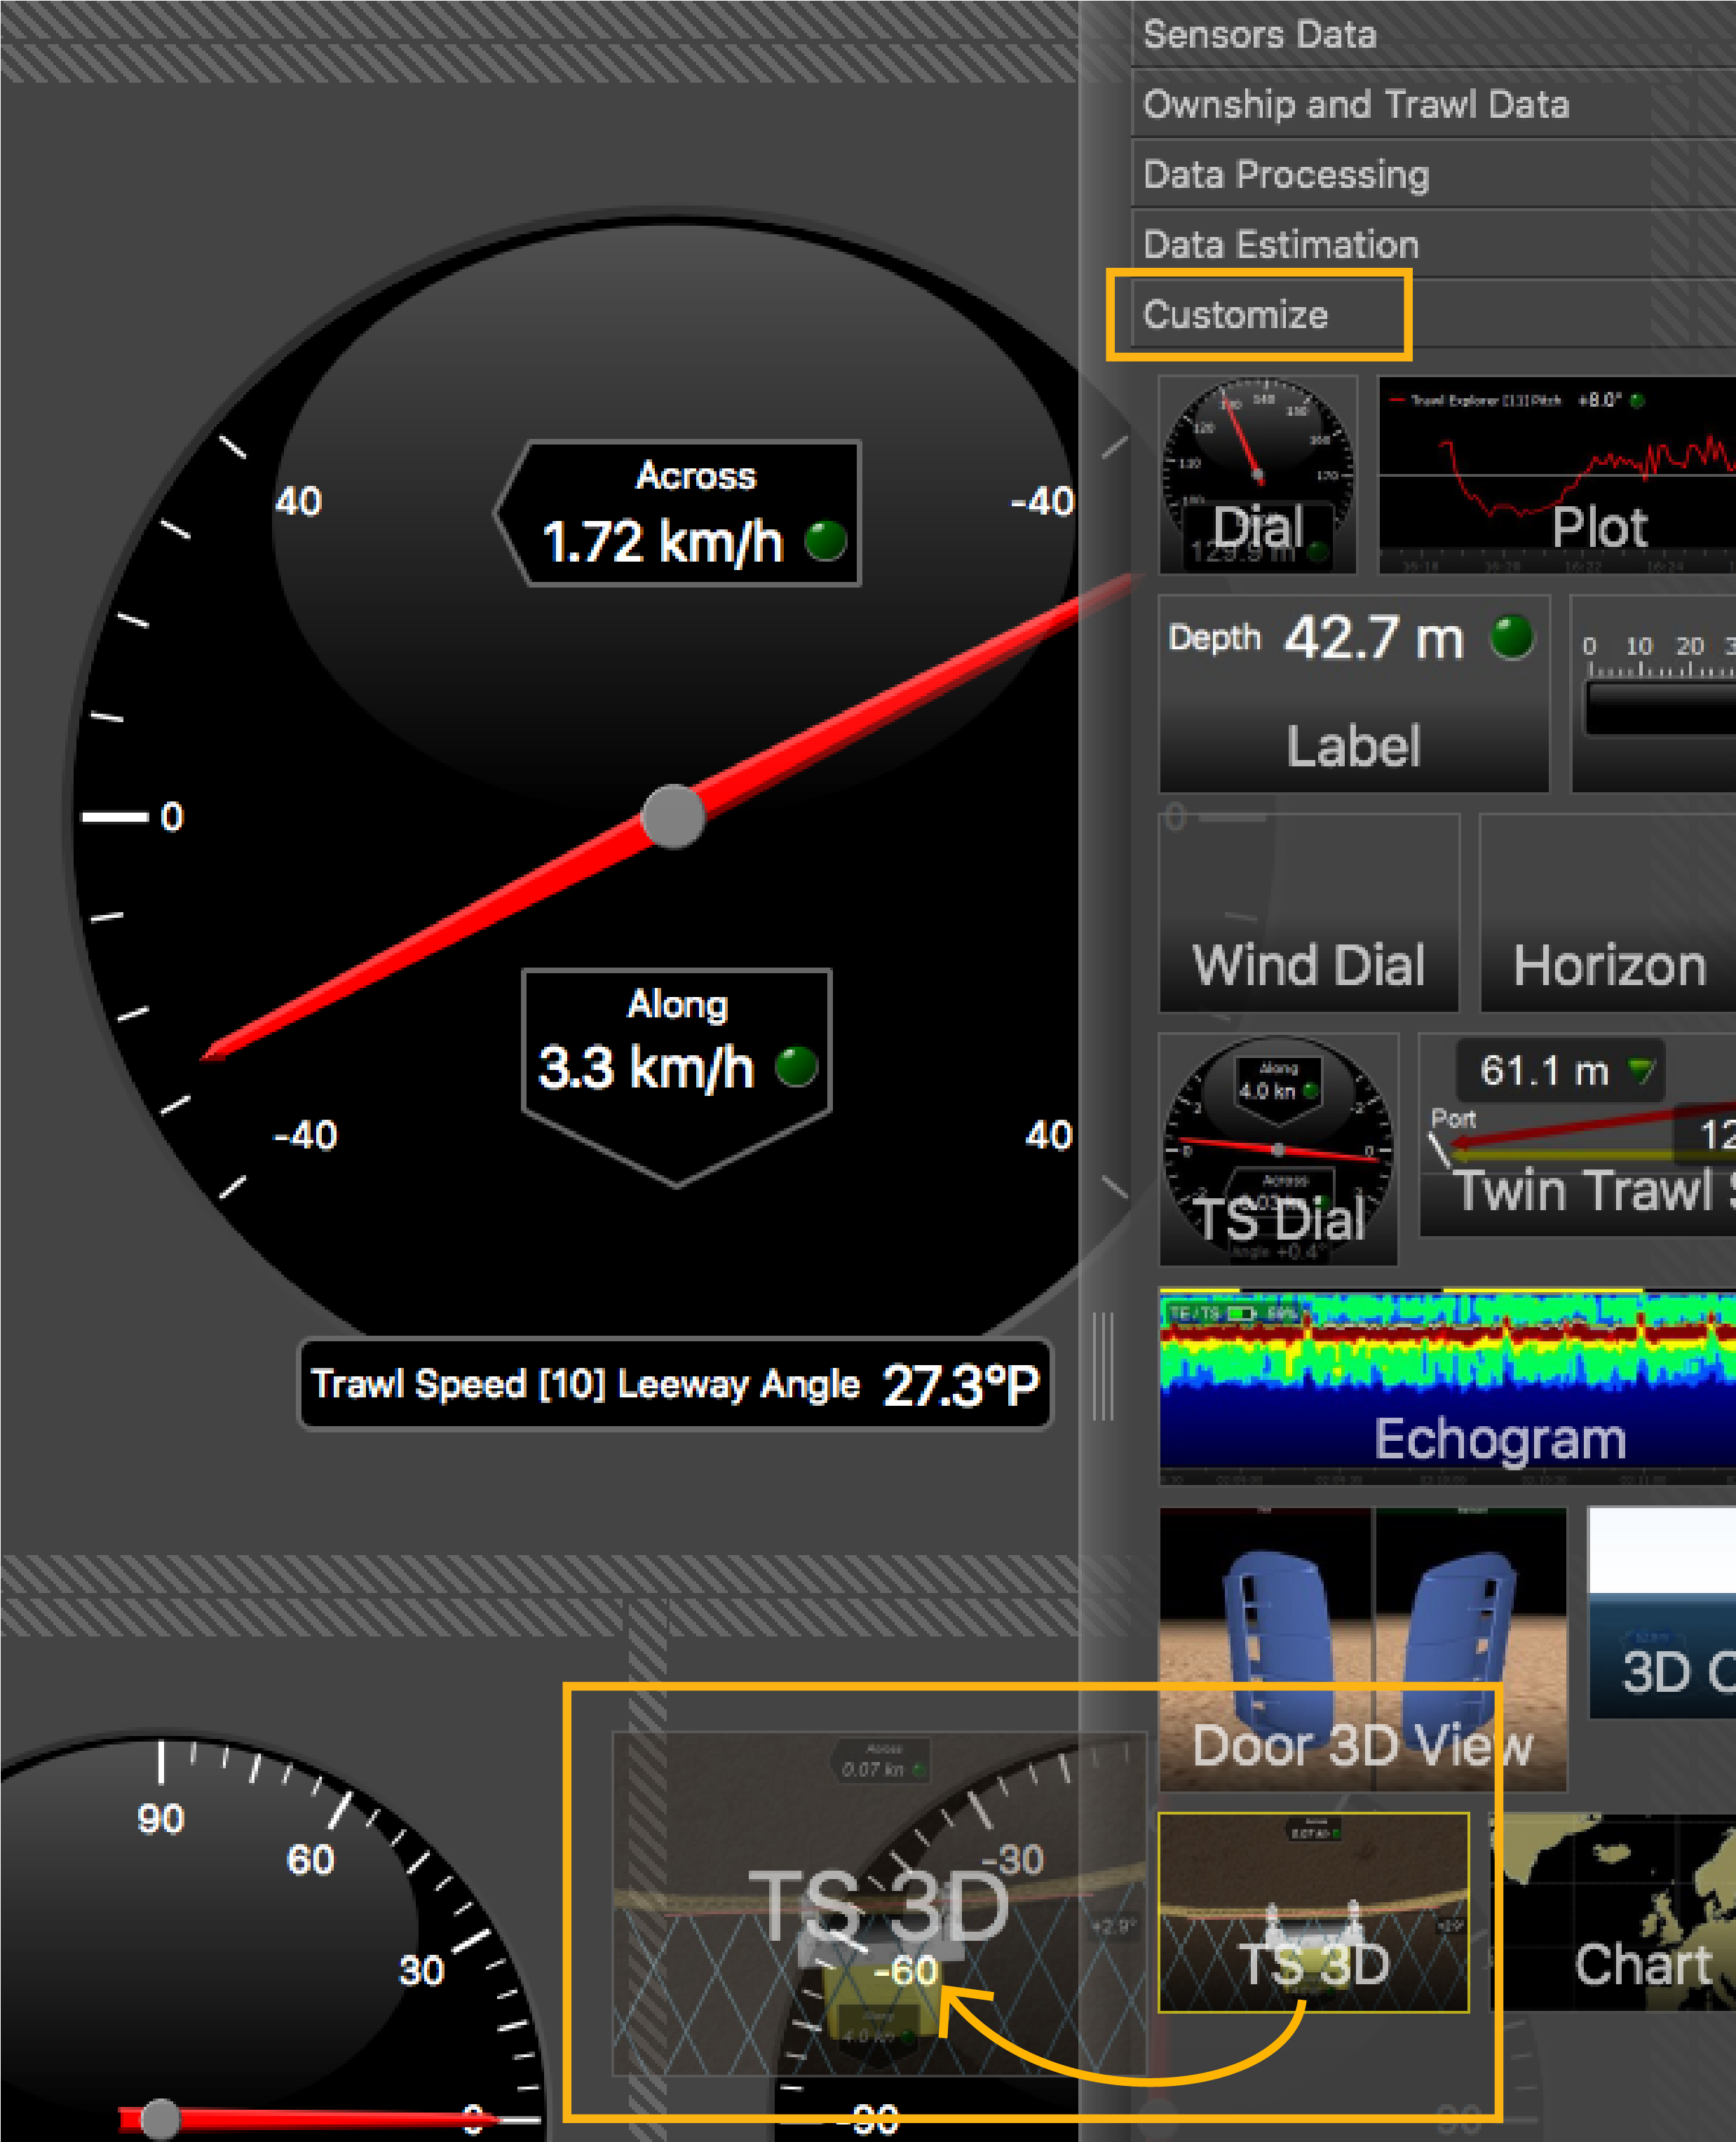
Click + drag to a page Water Speed Along or
Water Speed
Across data from a speed
sensor. From Choose new Gauge
Type, select the
type of display:
TS Dial Note: Bearing angle is negative when the sensor is oriented toward port and positive when oriented toward starboard.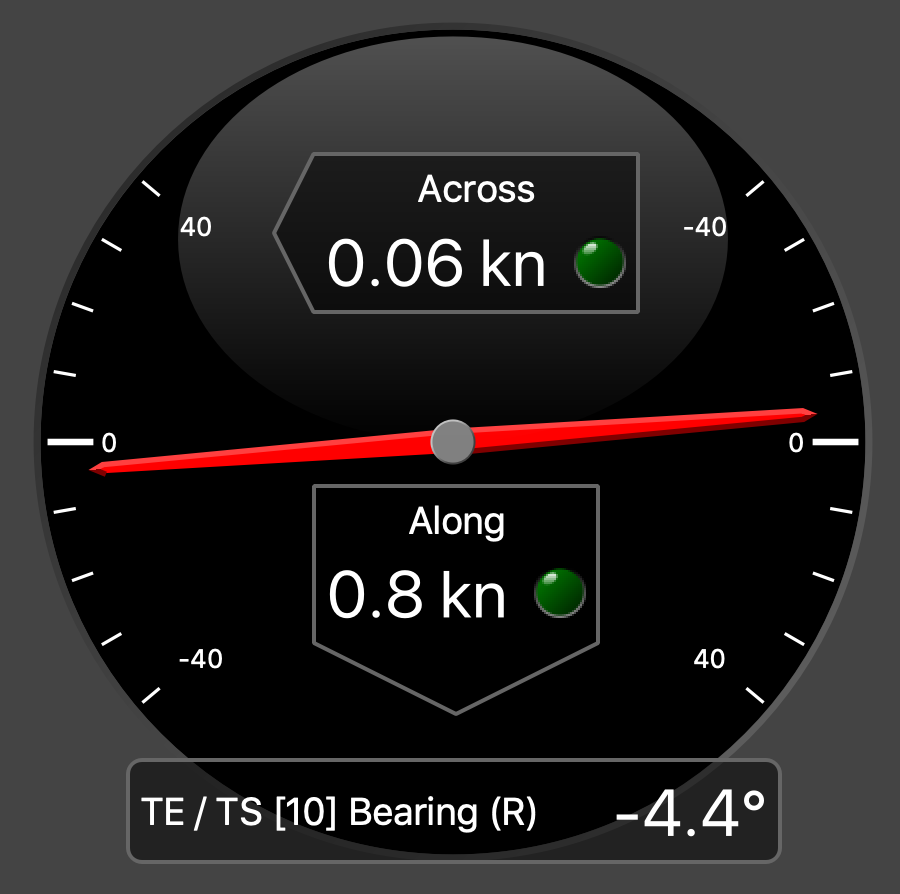
TS 3D 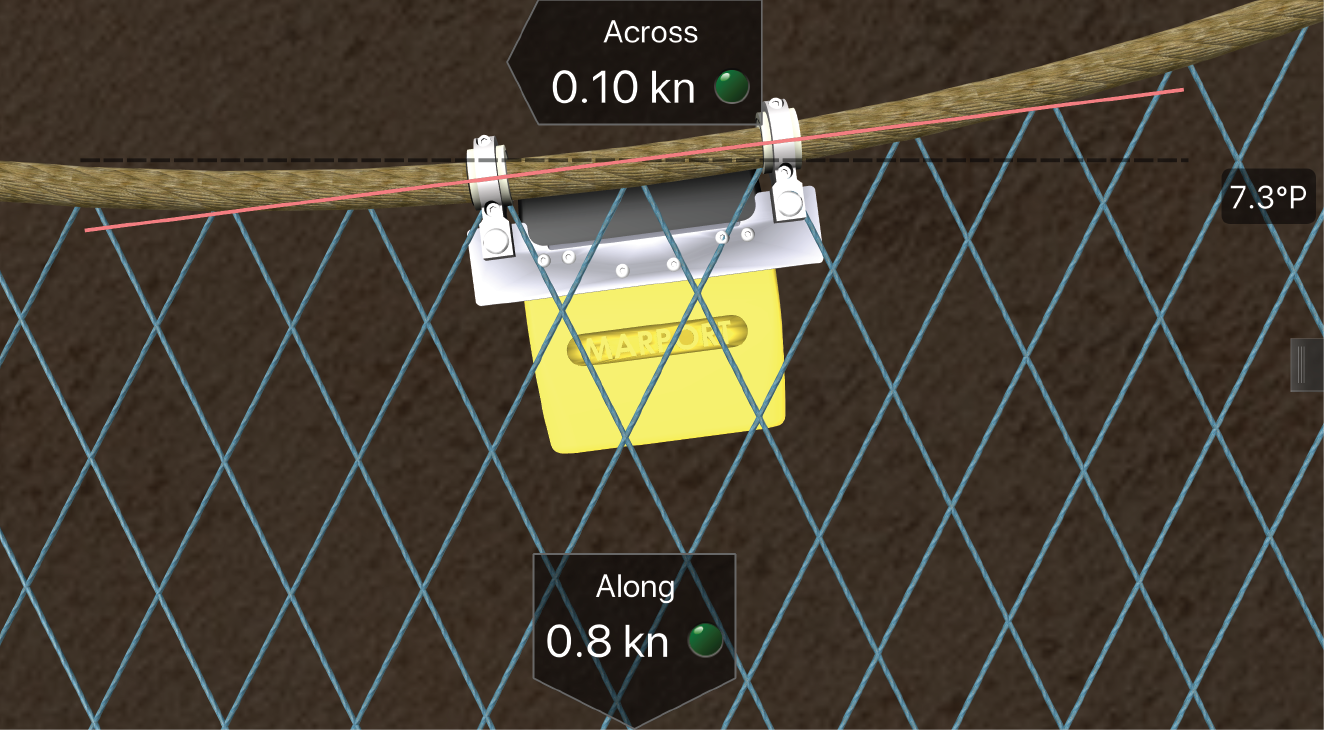 Note: The along speed is not displayed for a Symmetry sensor
 -
To display the angle of a Grid
sensor, drag Grid Angle data to a page
and select Dial:
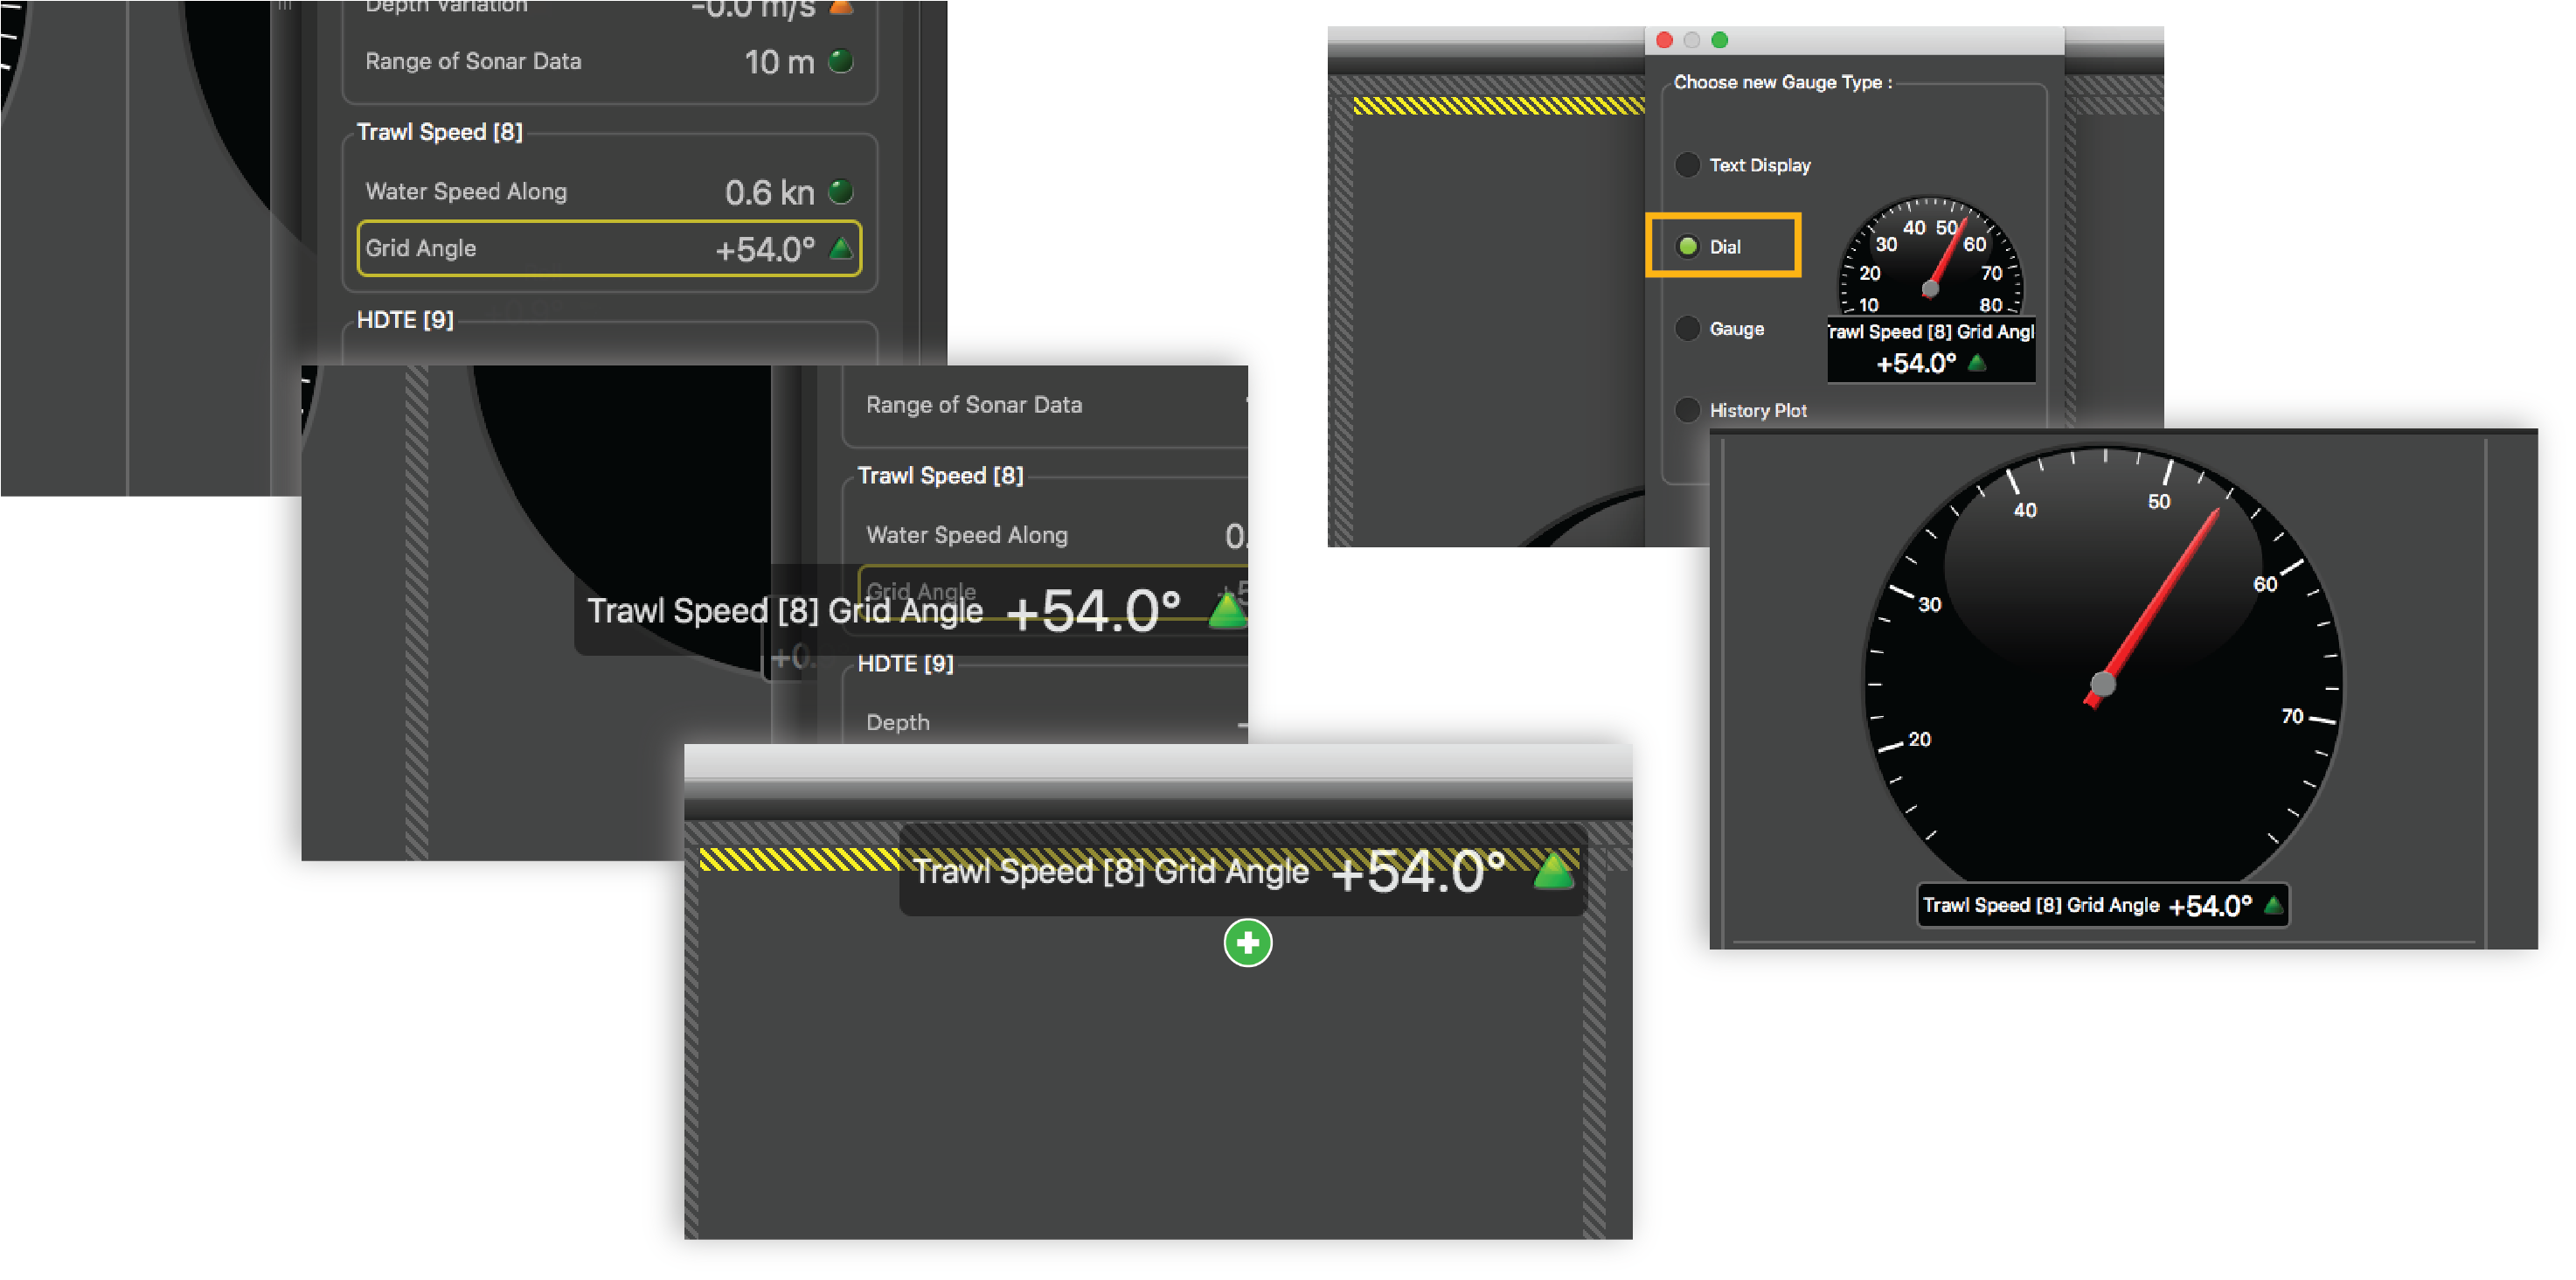 Note: The angle displayed should be 45° when the grid is correctly placed. In this example, the grid angle is slightly too high. If the grid angle is too high, non-targeted species may also be caught in the grid. If the grid angle is too low, targeted species may not enter.
 -
Open the control panels and go to Sensors
DataMx. Click + hold data for 3 seconds, until a rectangle
appears and drag it to a page in the middle of the screen.
- For example, this is how to display the echogram of a Speed Explorer:
- To display the target strength, from the top
left corner of the echogram, right-click the Speed Explorer name and select Display Target
Strength.
Hover the mouse over the echogram.The target strength of the element where you
place your mouse is displayed next to the Speed Explorer name. The higher the target strength, the bigger the target.
- How to display the water along and across speeds as text:
- How to display the water along, across speeds and leeway
angle:
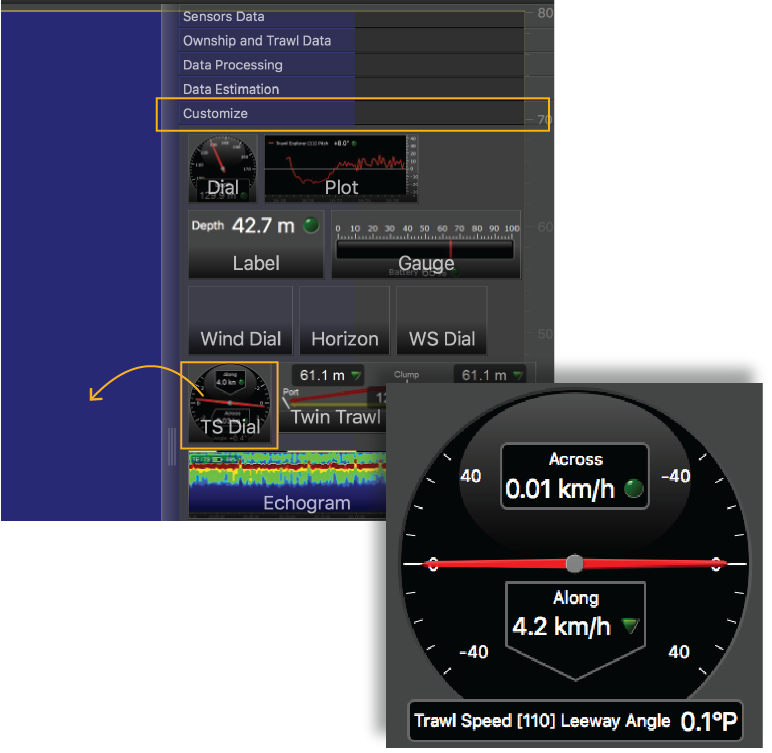 Note: Leeway angle is displayed for port (P) and starboard (S).
 - How to display a 3D view of a Trawl Speed or Symmetry sensor on the headrope:
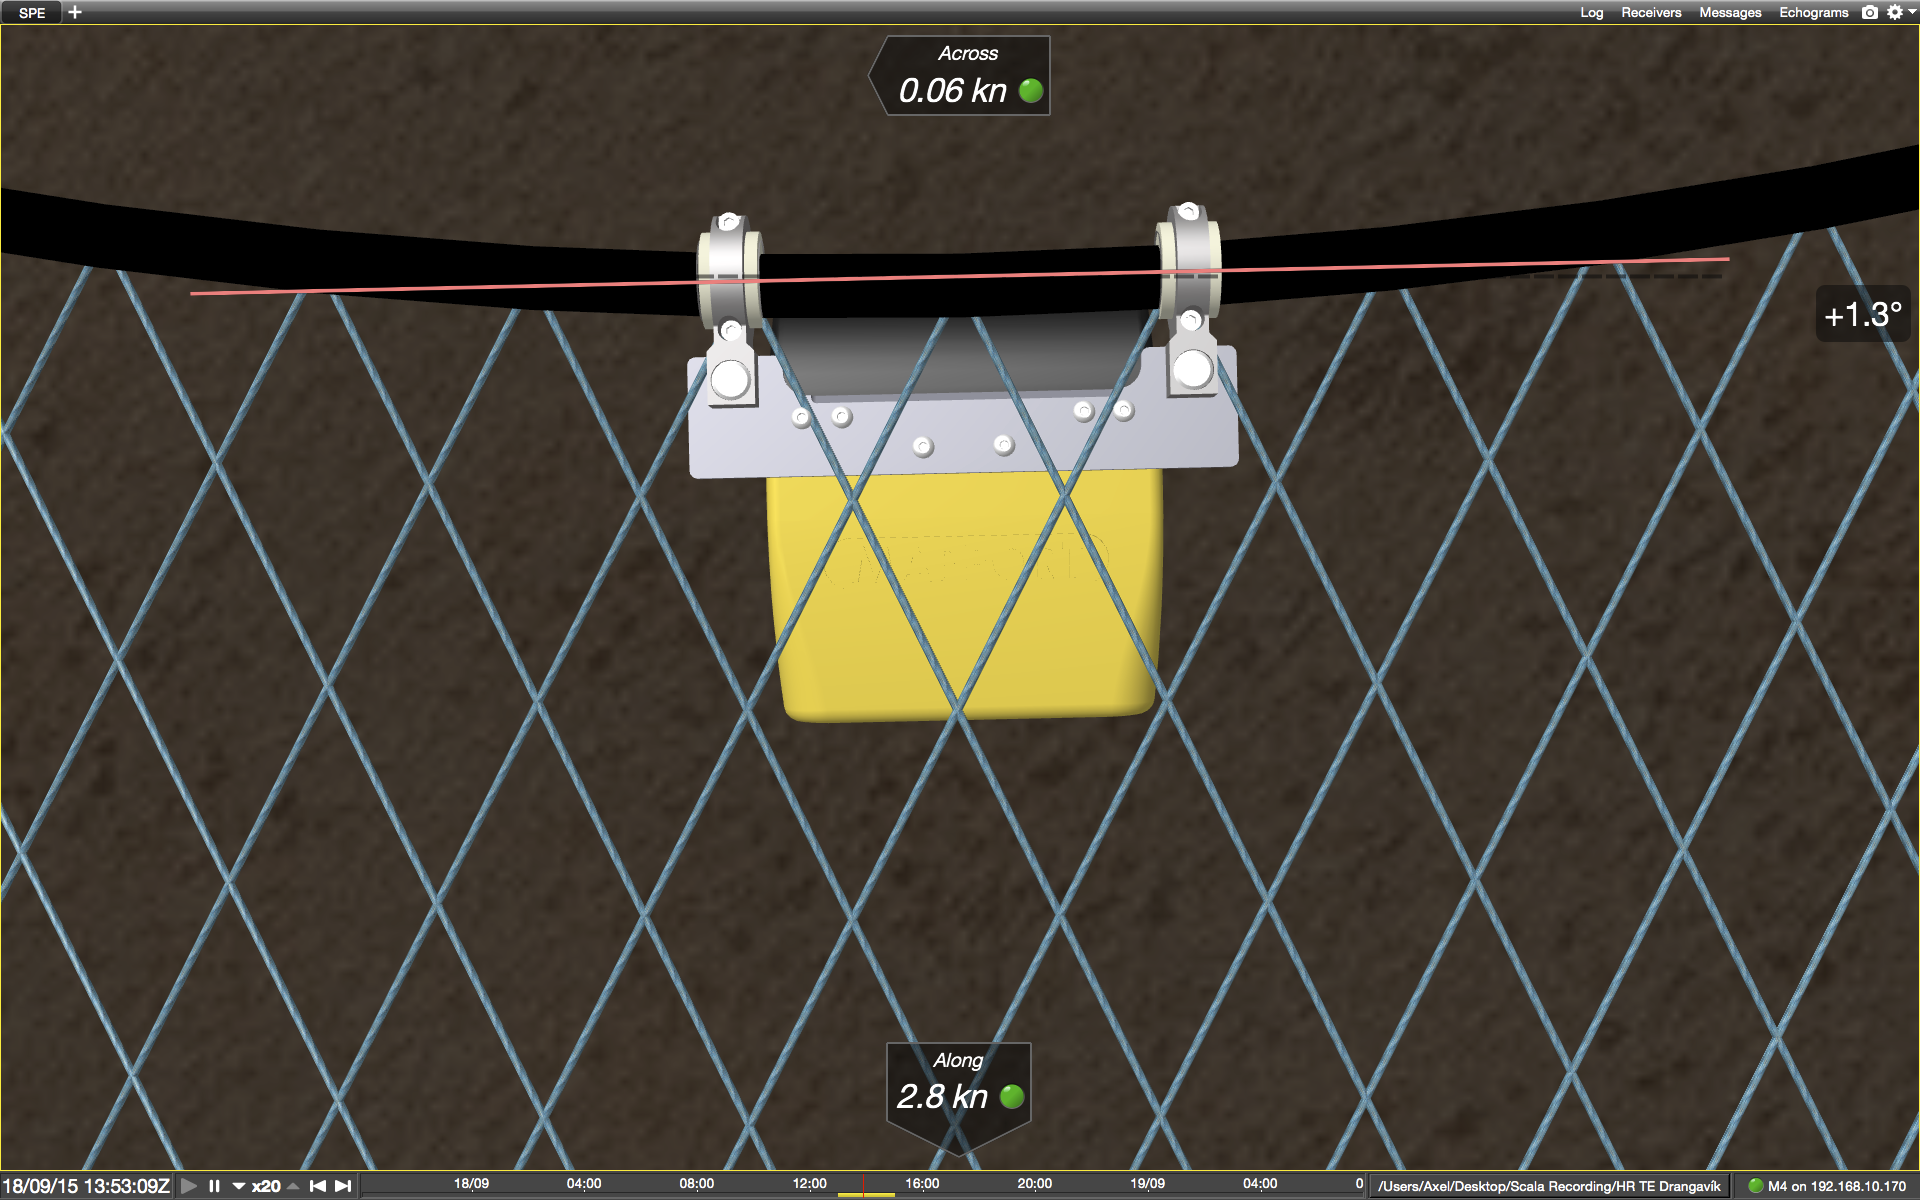 Note: The along speed is not displayed for a Symmetry sensor
 - How to display the angle of a Grid sensor: The angle displayed should be 45° when
the grid is correctly placed. In this example, the grid angle is
slightly too high. If the grid angle is too high, non-targeted
species may also be caught in the grid. If the grid angle is too
low, targeted species may not enter.
- For example, this is how to display the echogram of a Speed Explorer:
-
Deactivate the Customize mode when you have finished
customizing pages: click Menu > Customize again.