
Configuring Data Display in Scala2
You can display the sensor's measurements and echograms on Scala2 pages.
Before you begin
Procedure
- Open the control panels and go to the Mx tab.
-
To display the echograms, click + hold Sonar Data from a Catch Navigator NX sensor and drag it to the page
display.
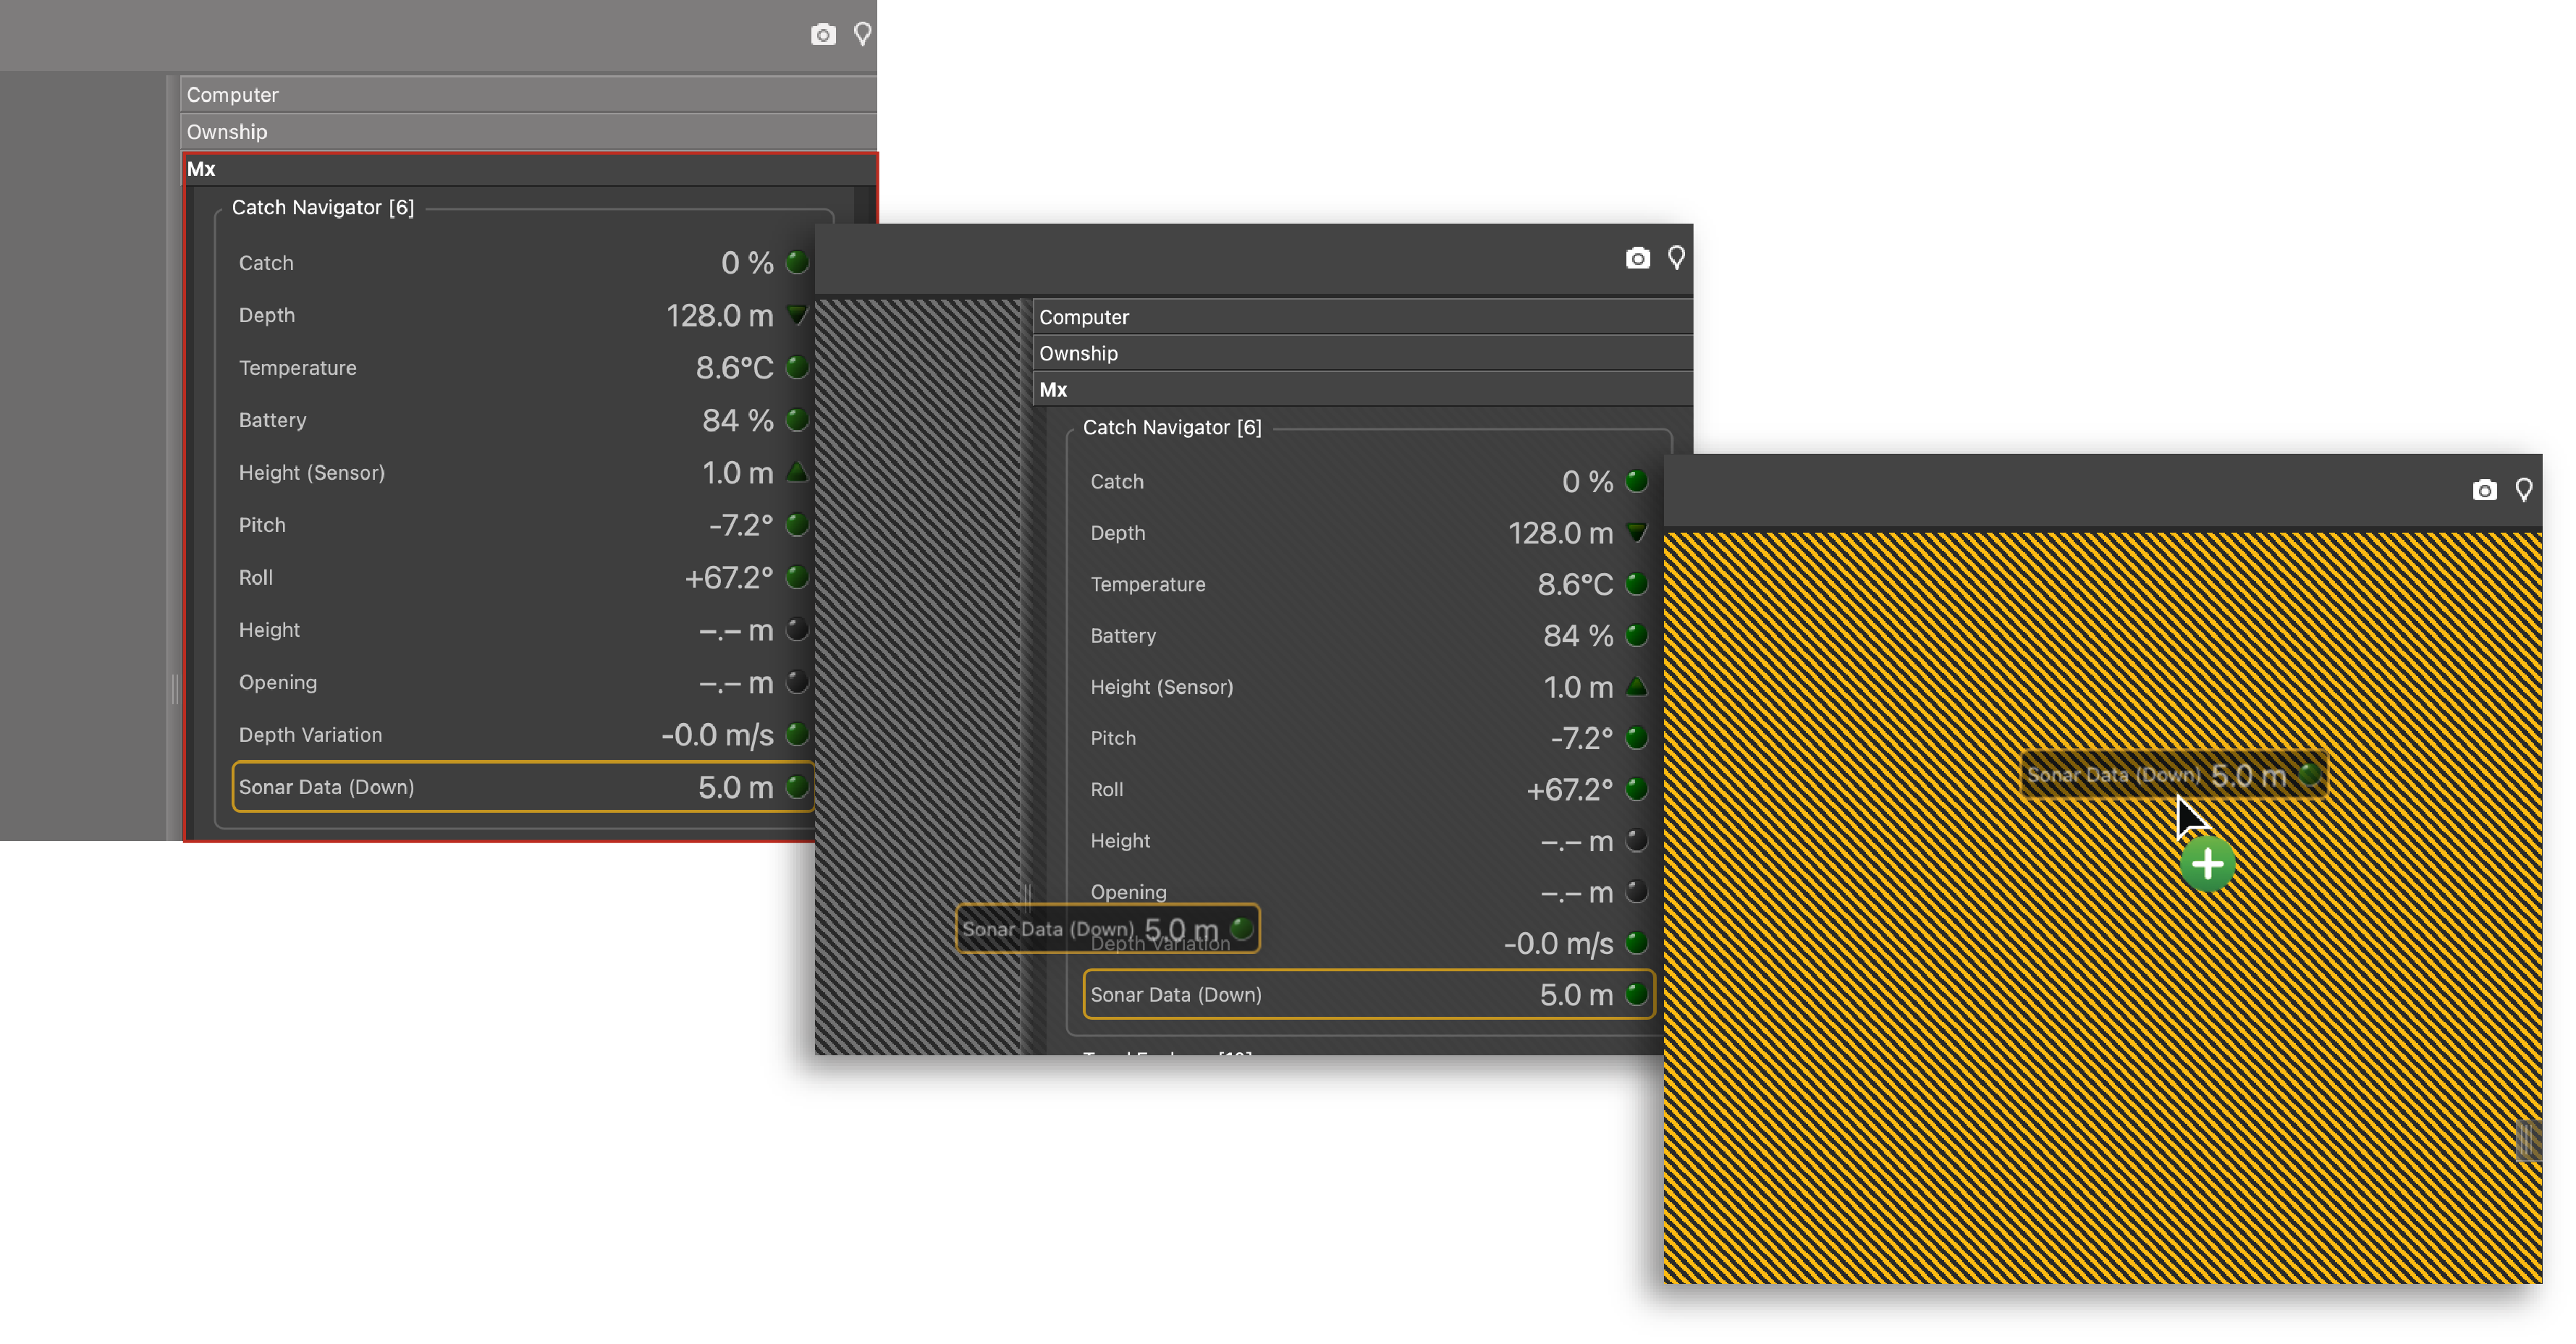
-
To know if the trawl is filling up:
-
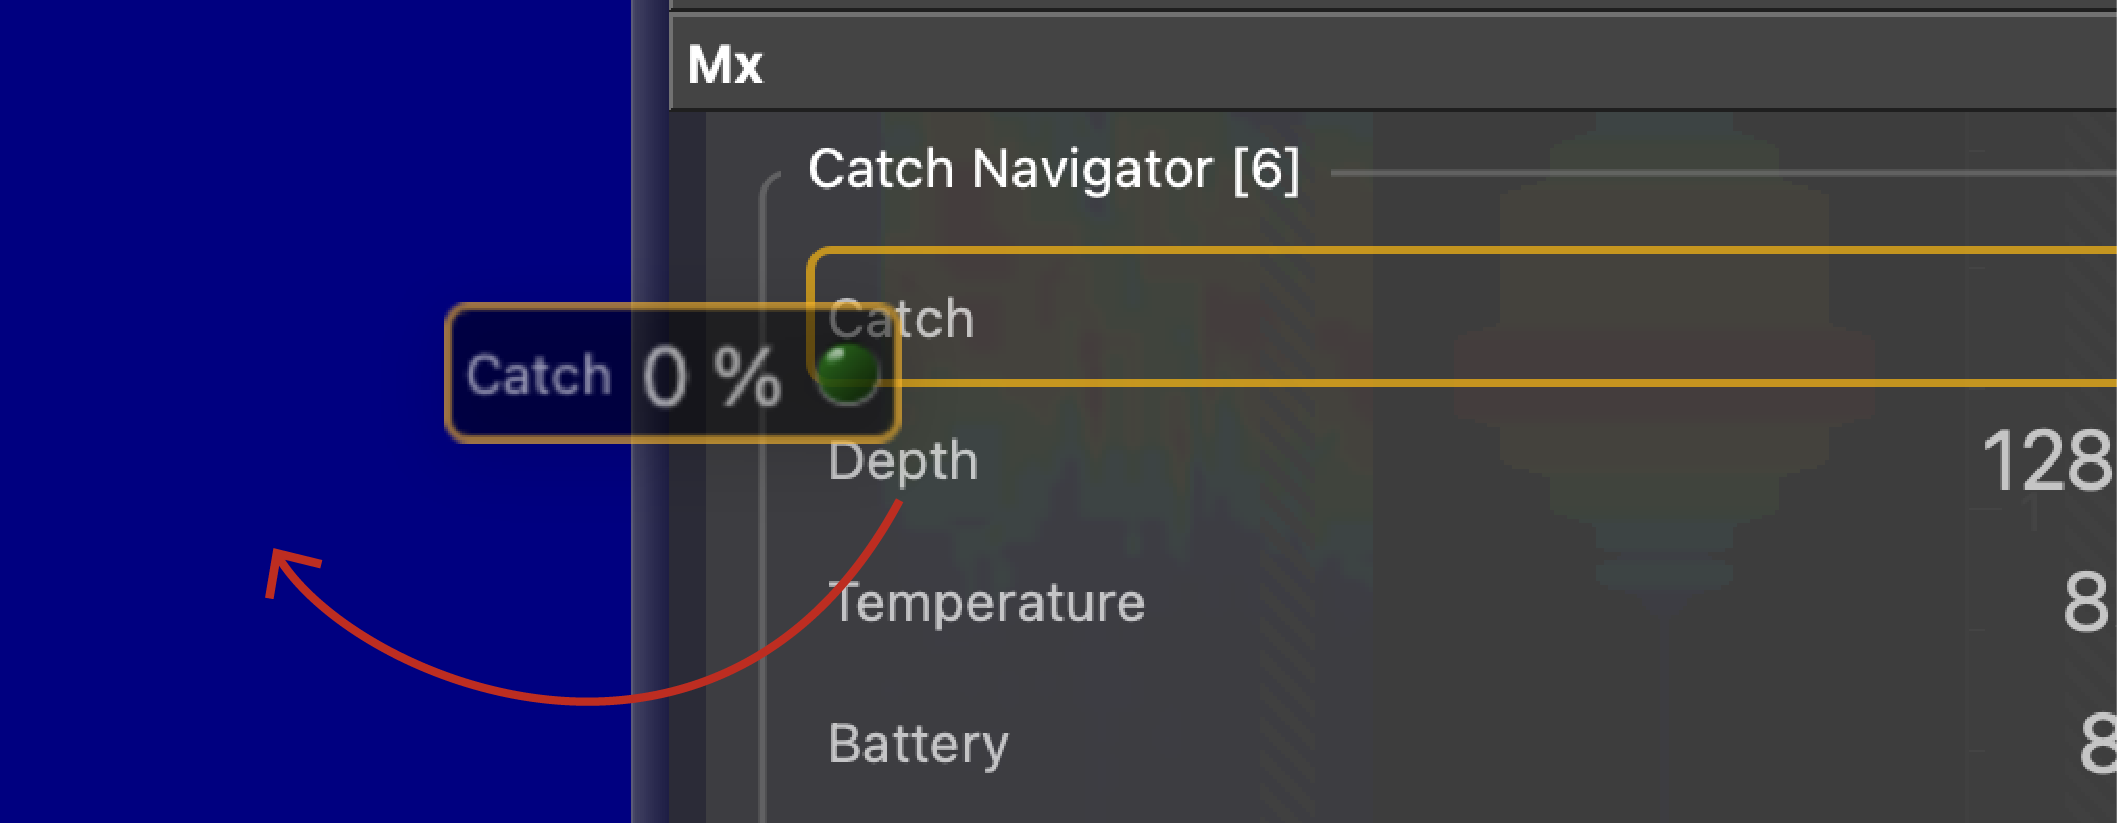
Open the control panels and drag
Catch data to a page.
When the codend is empty, the history plot looks like this: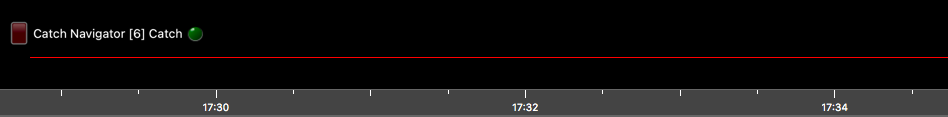 When the codend is filling up:
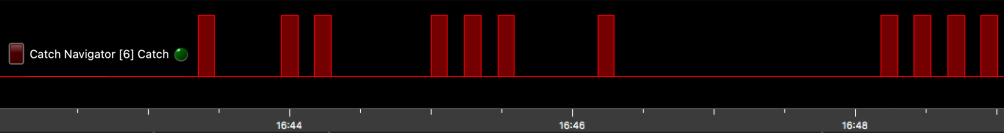 When the codend is full:
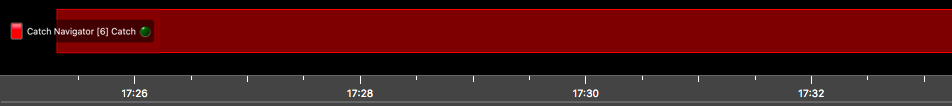
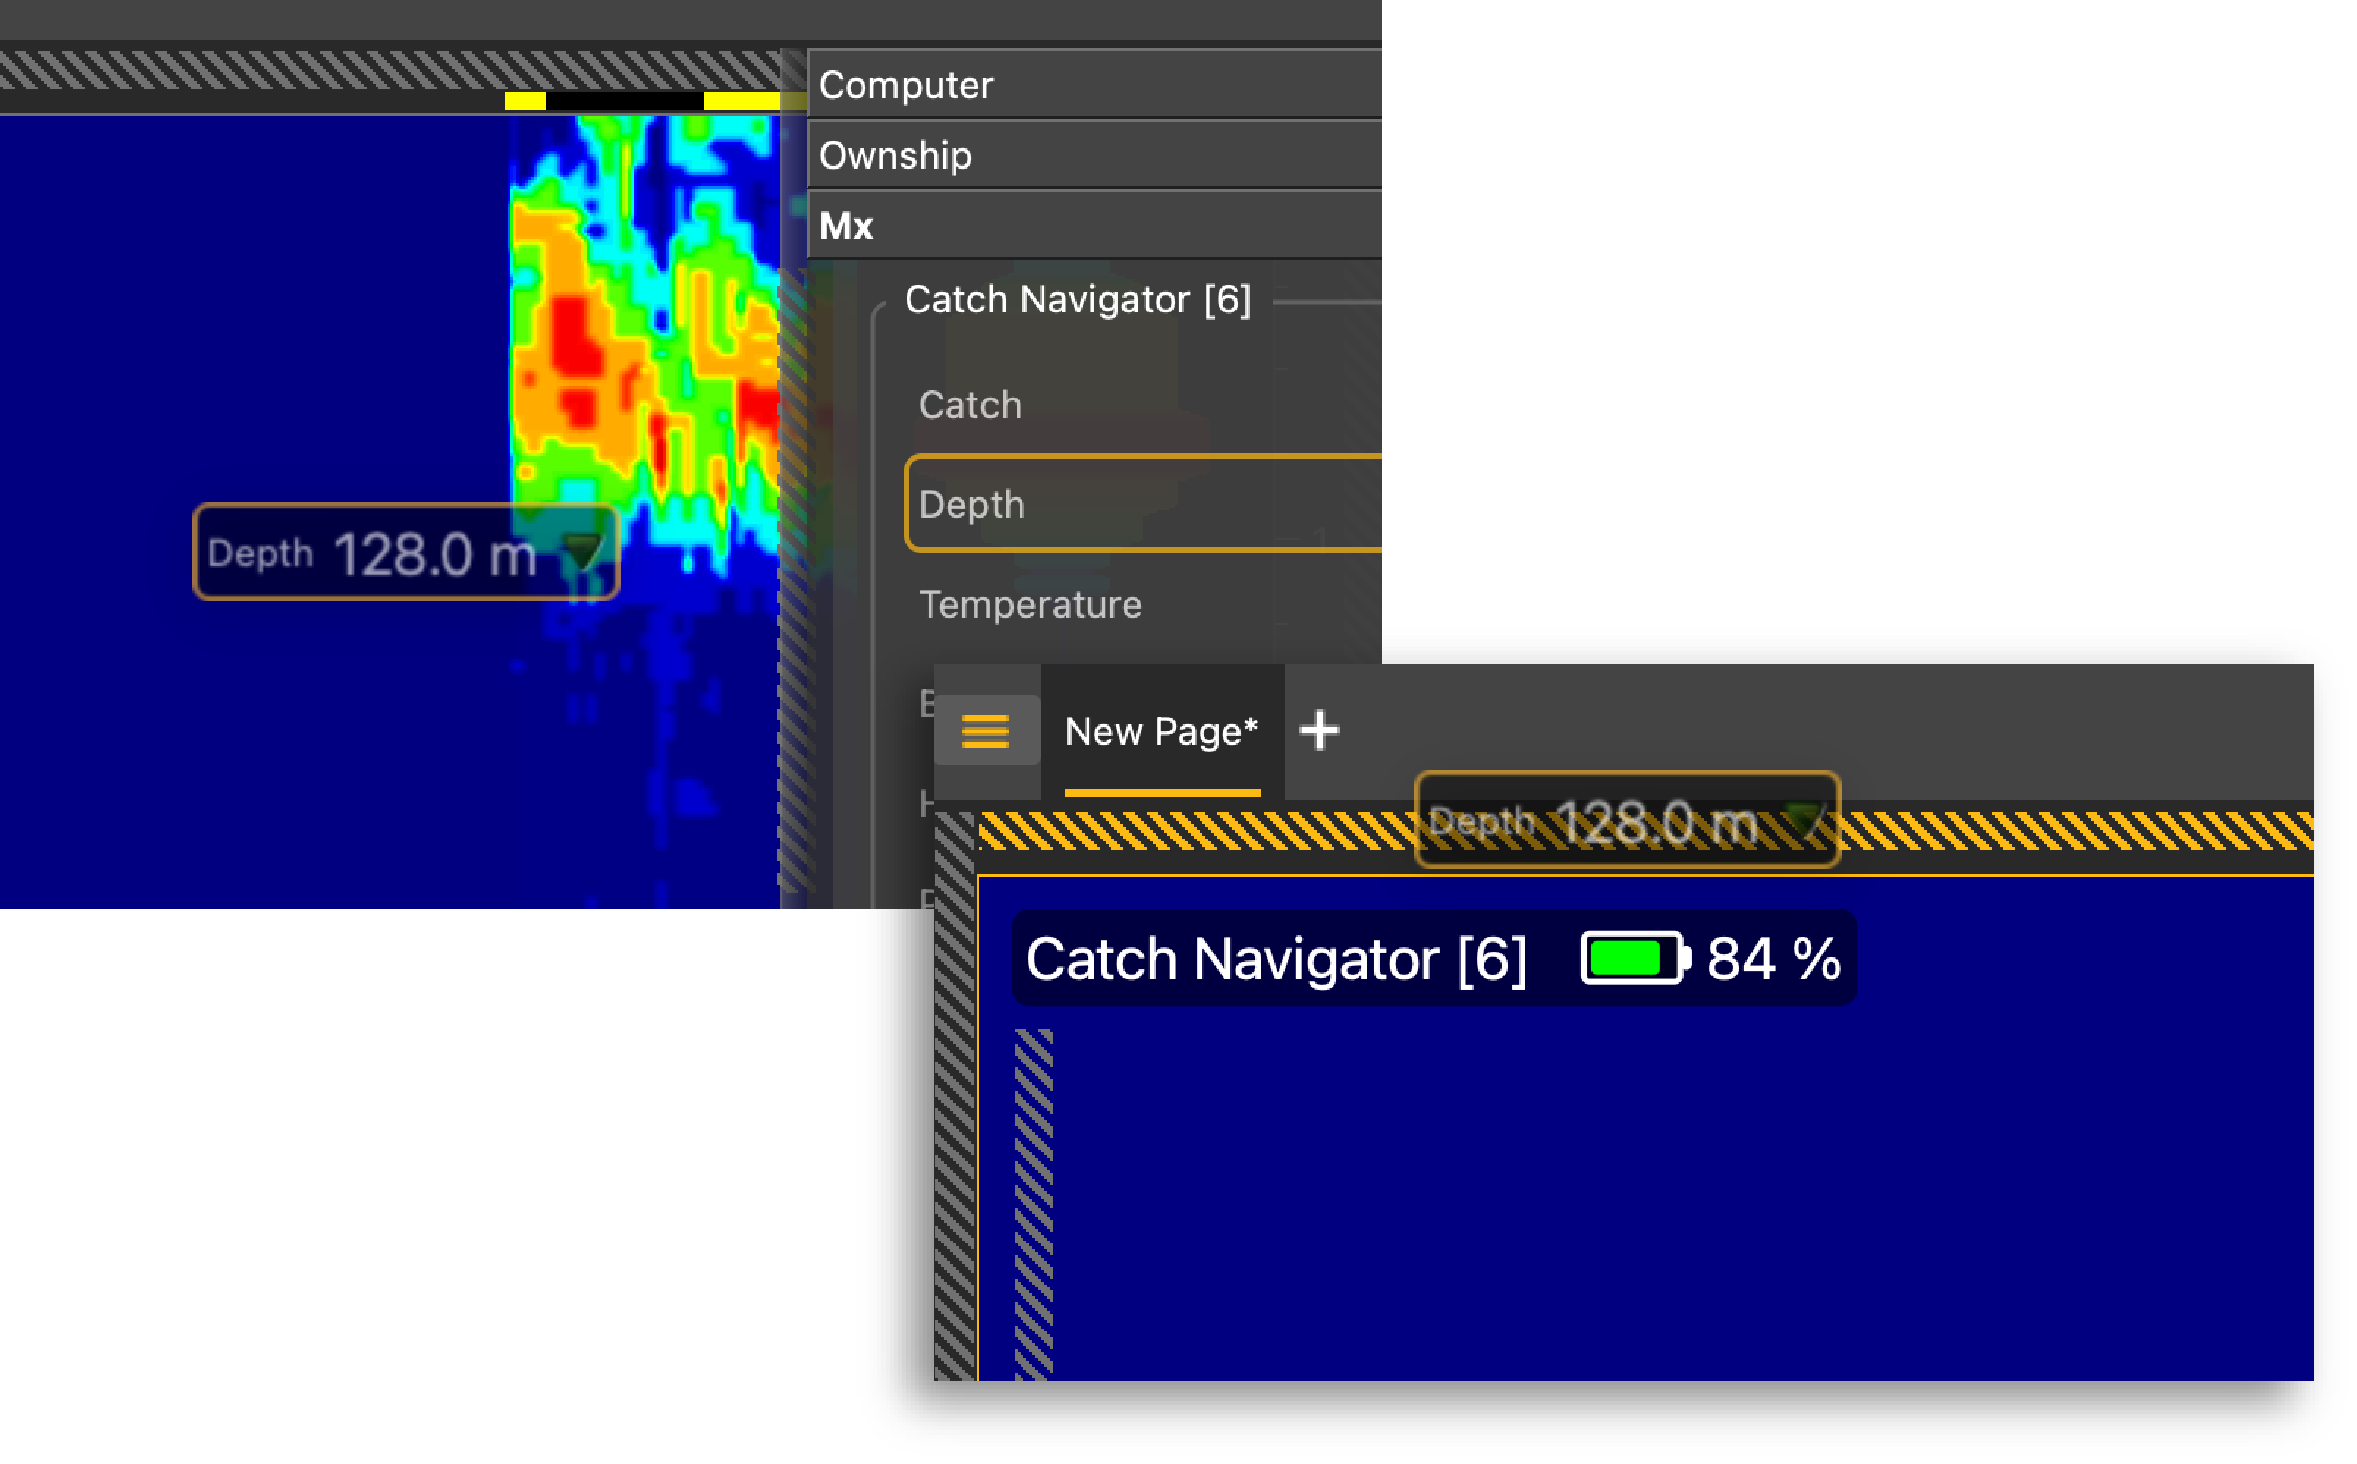
-
Open the control panels and drag
Catch data to a page.
-
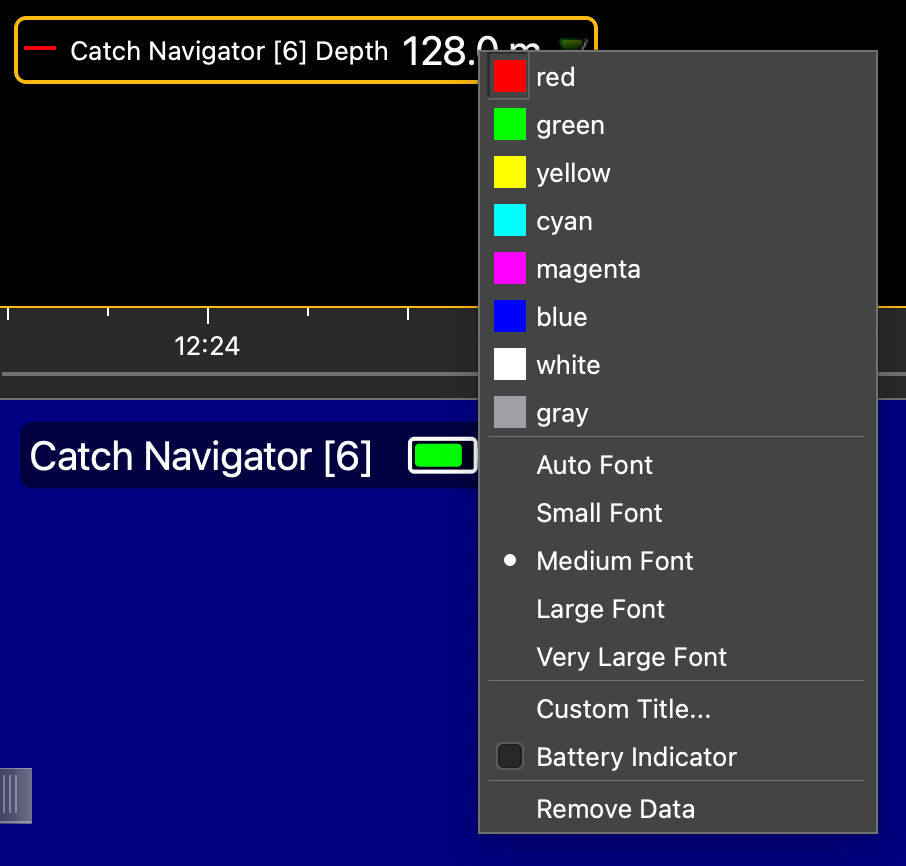
Click + hold other data, such as depth, pitch, roll, and drag it as well to the
page display.
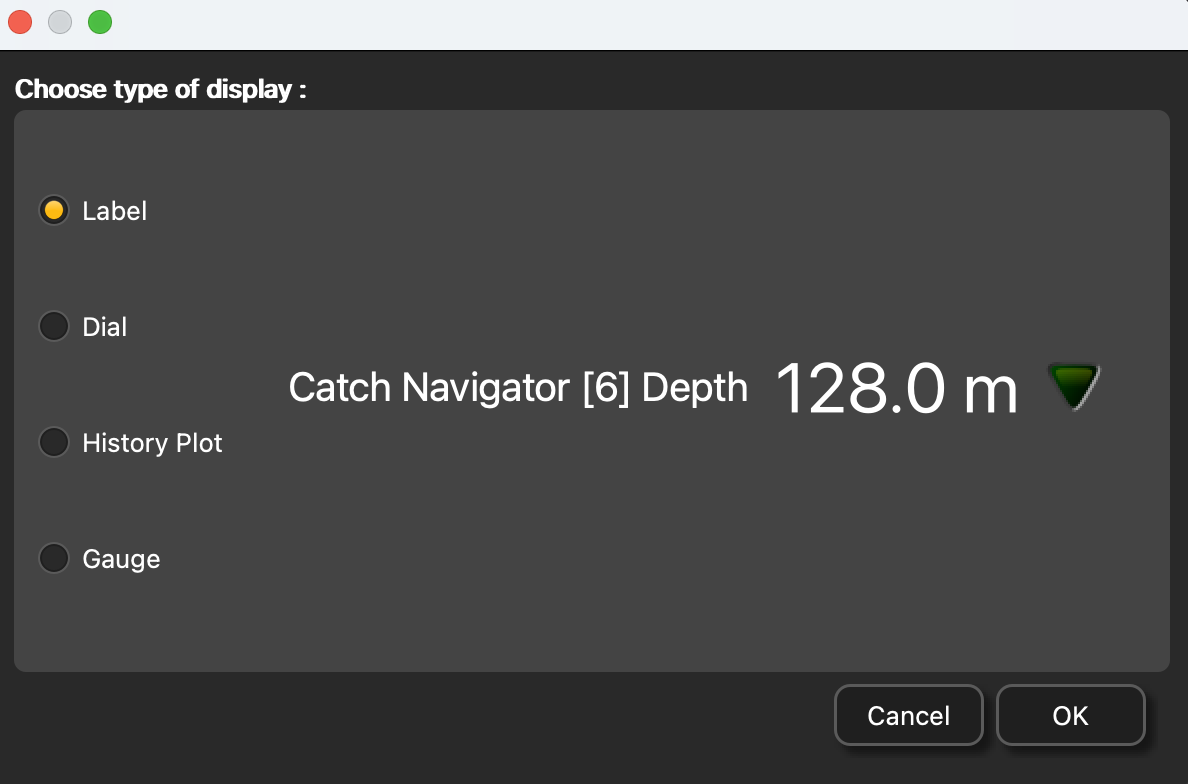
-
Select the type of display.
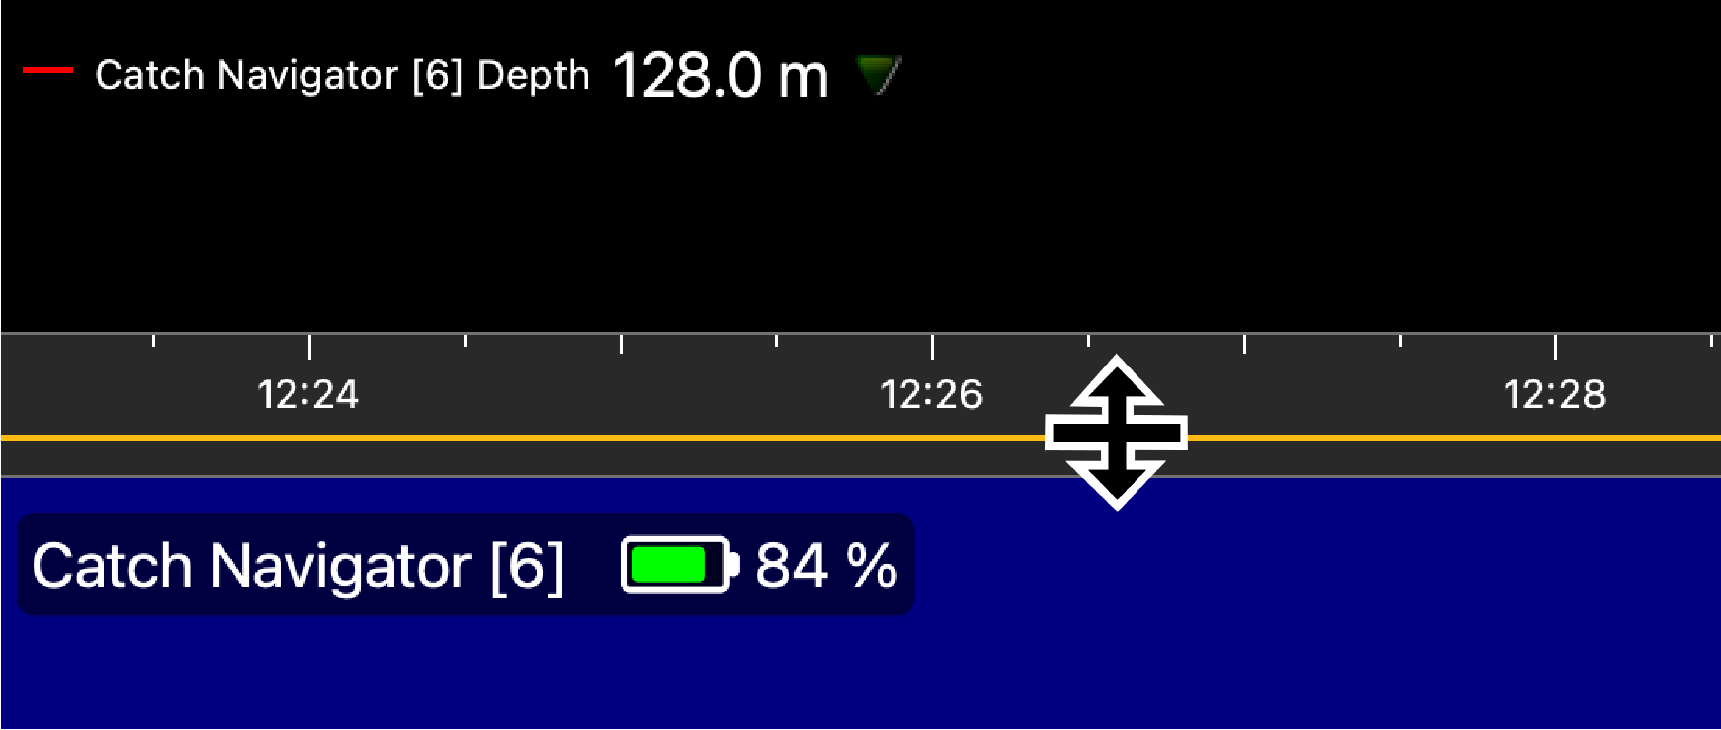
-
Drag the lines around the blocks of data to resize
them.
-
-
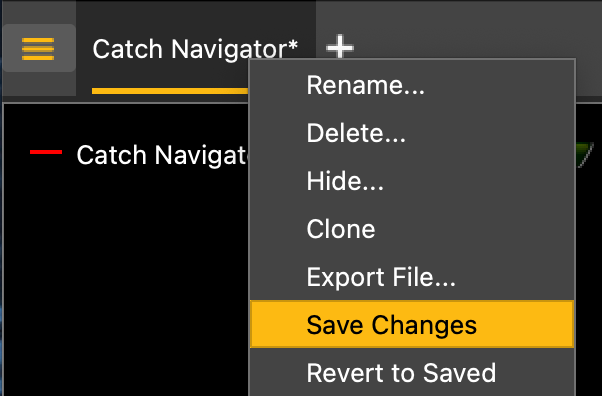
To save the changes, right-click the
tab with the name of the page and click Save Changes.
-
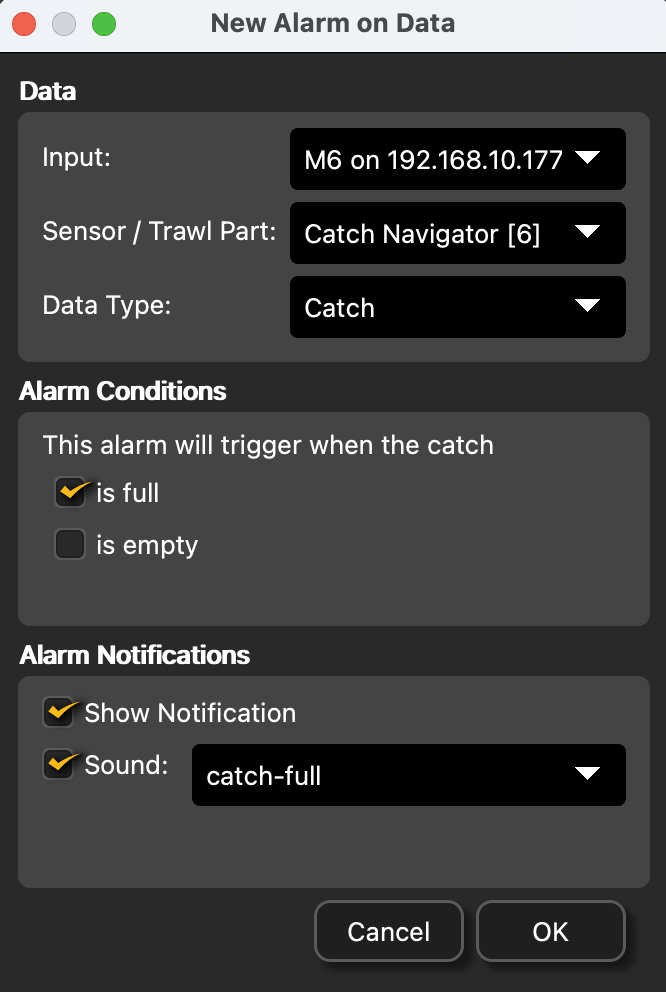
To be alerted when the trawl is full:
-
From the top left corner of the screen, click Menu
 > Settings.
- From the Settings dialog box, go to the Alarms tab.
- Click Add.
-
In Alarm Data and Alarm
Conditions, enter the
following settings:
-
From the top left corner of the screen, click Menu