Checking Noise Interference
You can use the spectrum analyzer to check the noise level of the hydrophones and check for interference.
About this task
Procedure
- Click and enter the password copernic.
- Again in the menu, click Receivers.
-
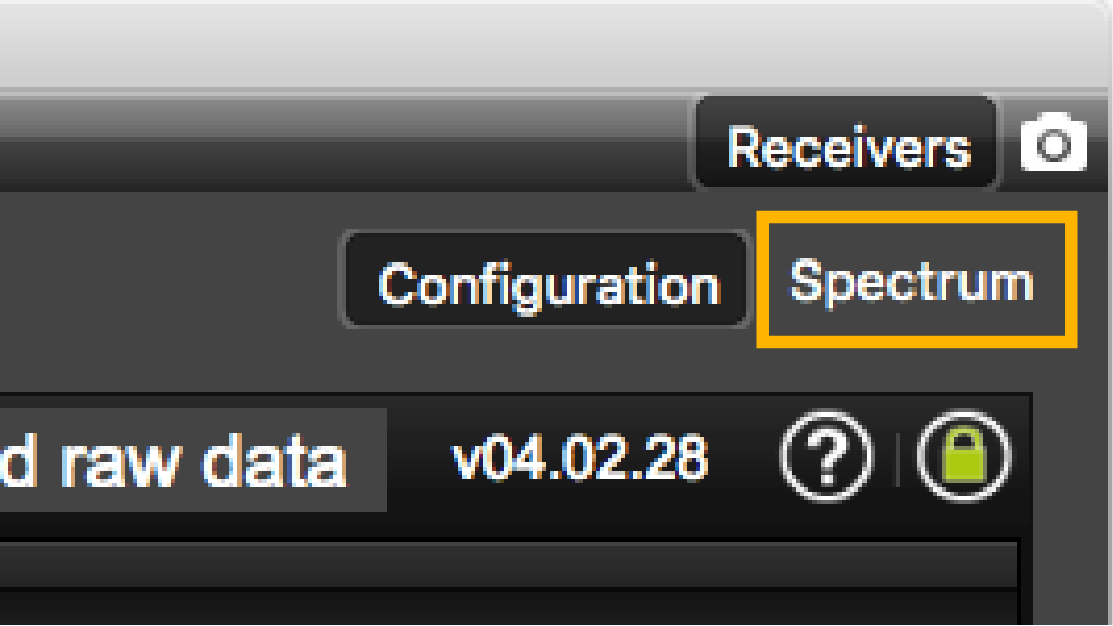
From the top right corner of the screen, click
Spectrum.
-
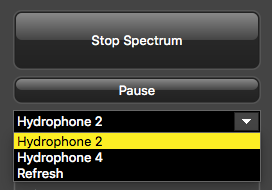
Select the hydrophone you want to test. Only the hydrophones that are switched
on are displayed. Select refresh to update the list.
-
From the top left corner of the screen, click Start
Spectrum.
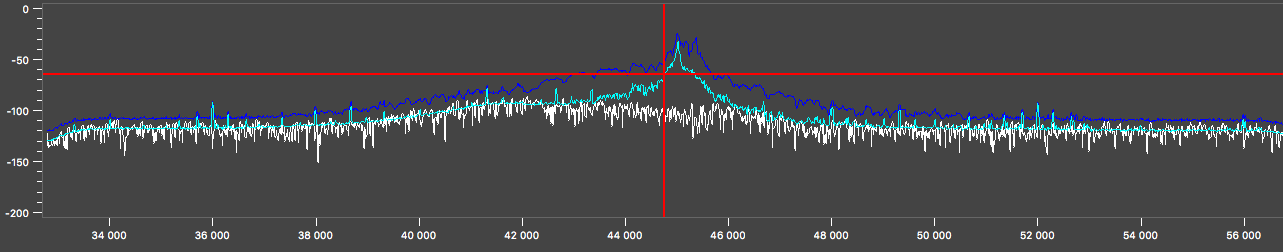
The graph at the bottom of the page shows three levels of noise in dBV:
- RealTime (white): level of noise recorded in real time.
- Mean (cyan): mean recorded level of noise. It is useful to assess the noise floor.
- Max (dark blue): shows the latest highest level
of noise recorded. It is useful to see on which frequencies are the
sensors.
The acceptable average level of noise depends on the conditions (distance from the sensor to the hydrophone, fishing method, type of hydrophone). You can have better performance with the following levels:
- Active wideband hydrophone with high/low gain: below -100 dBV
- Active narrowband: NC-1-04 below -80 dBV / NC-1-07 below -100 dBv
- Passive hydrophone: below -110 dBV
-
To see the maximum, mean and real time measures of noise level at a specific
frequency, select Marker on the left side of the screen
and move the mouse over the graph.
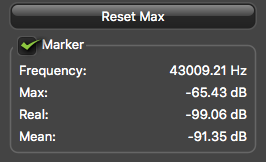 Frequency and levels of noise (dB) at the mouse pointer location are displayed under Marker.
 -
Under Peak, you can check:
- RealTime: the latest highest level of noise recorded.
- Max.: the highest level of noise recorded since the beginning of the spectrum.
- Check that there is more than 12dBV between the maximum noise level (dark blue line) and the average noise level (light blue line) on the peak of sensor frequencies.
- If you changed the configuration of the hydrophone or sensors, click Reset Max to reset the dark blue line showing the maximum level of noise.
-
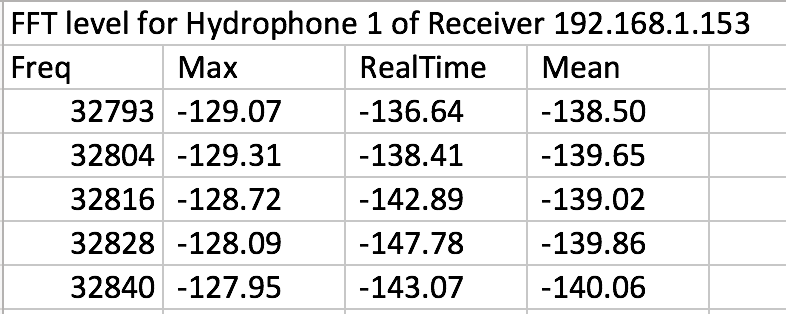
To save data recorded by the spectrum in a *.txt file, click Save
FFT.
The FFT file lists for the entire bandwidth used by the hydrophone (frequencies are in Hz) the maximum and mean levels of noise since the FFT export has started and the last real time level of noise before the export (dBV).
- When you have enough data, click Stop Spectrum.