Filtering Examples on Echograms
Here are examples of the effects of some filters on echograms..
Echosounder Interference Reduction Filter
On a TE/TS echogram: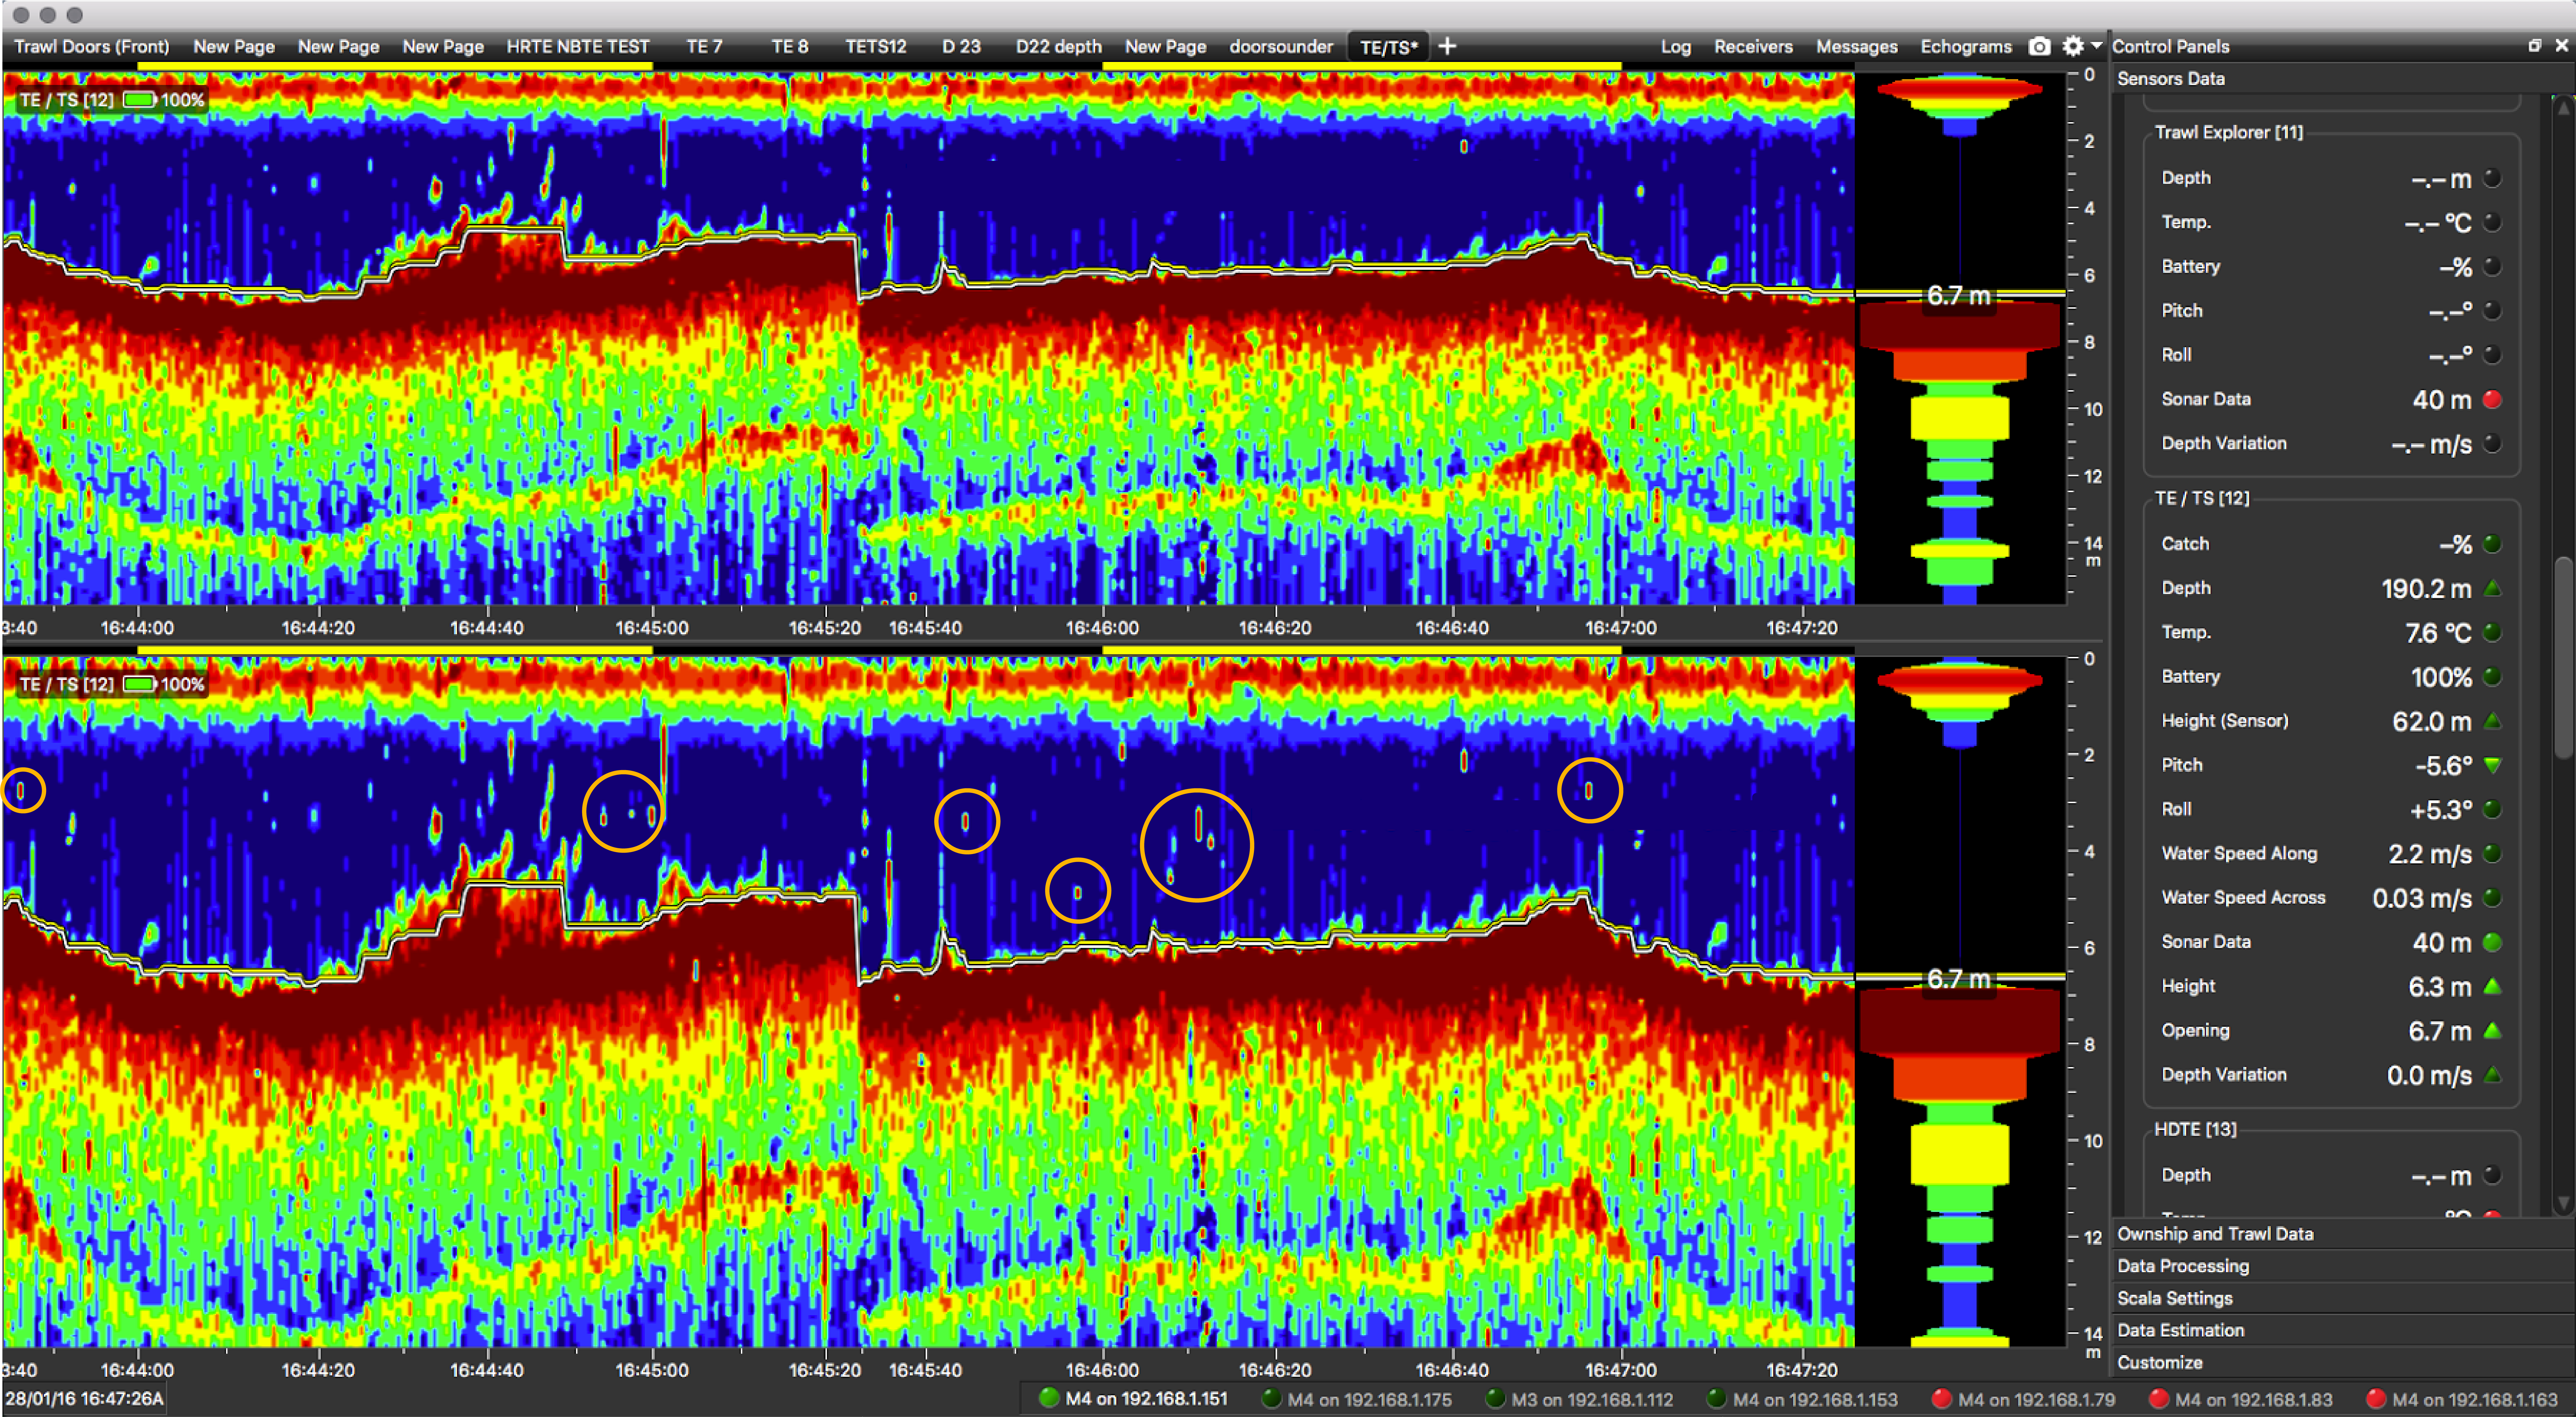
The echogram above has filtered data and echogram below has raw data.
You can see on the second echogram that there are interferences due to an echosounder (circled in orange). These interferences are mostly removed when the Echosounder Interference Reduction filter is applied (first echogram).

Signal Interference Reduction Medium Filter
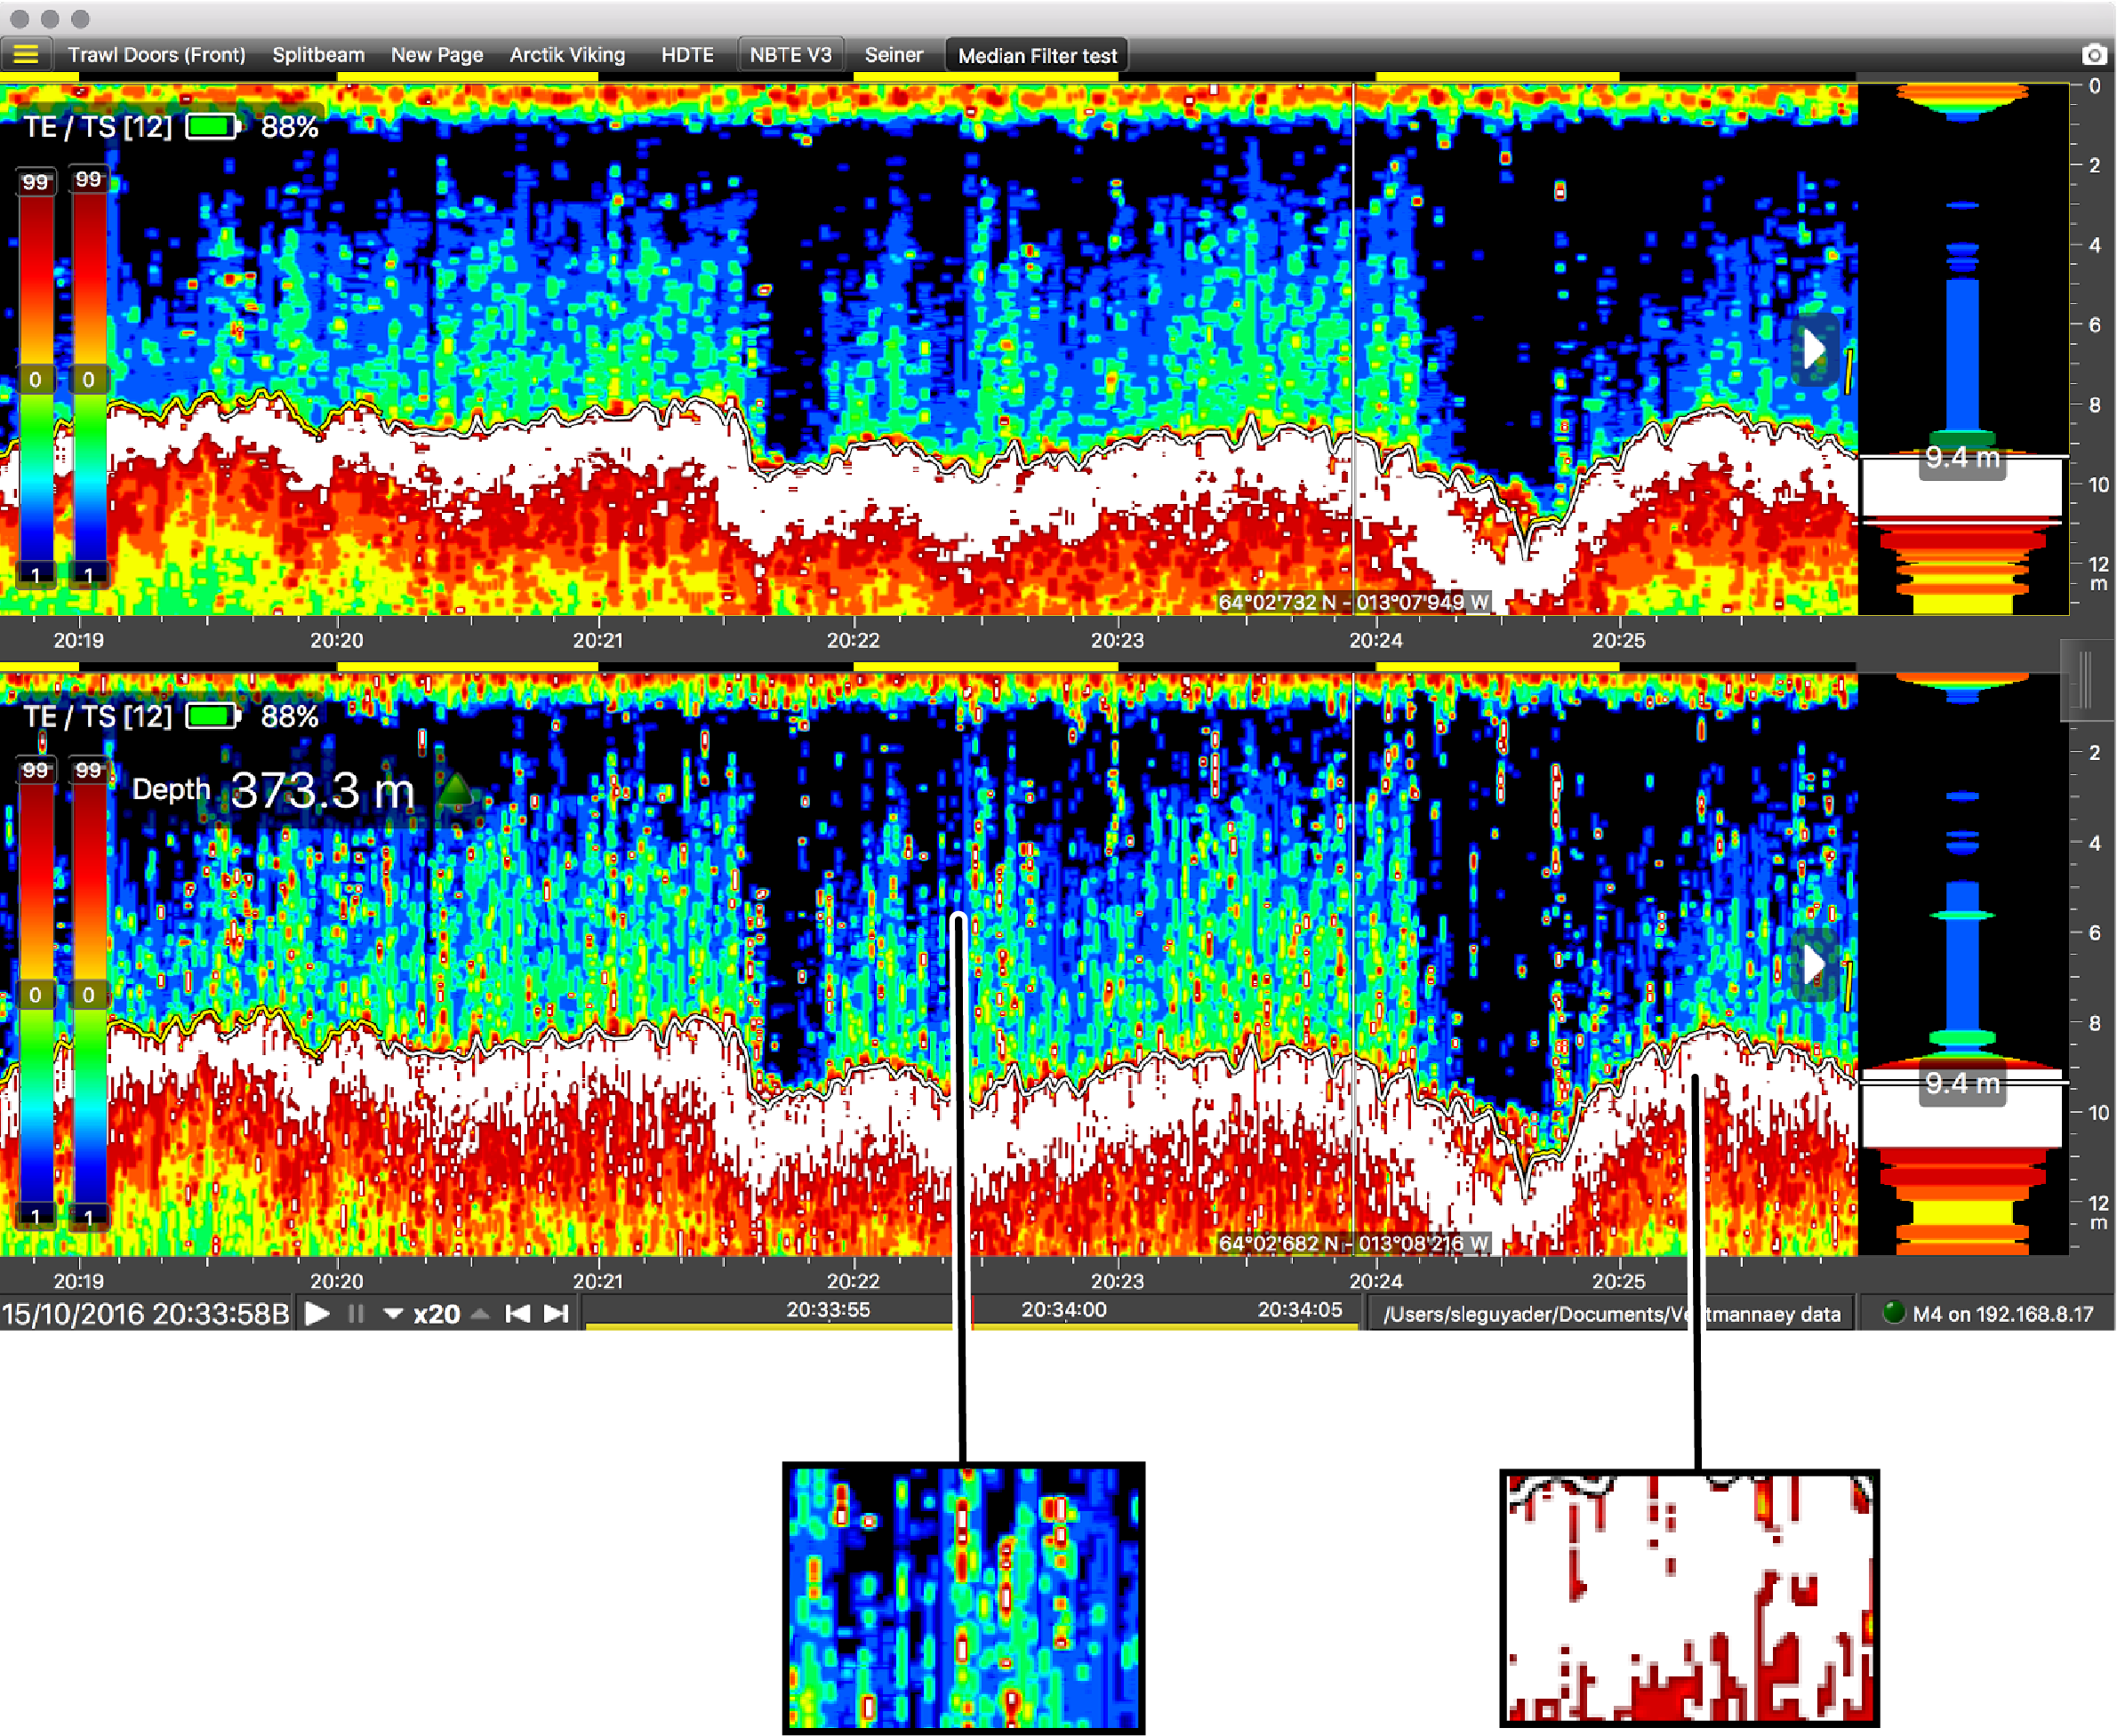
The echogram above has filtered data and echogram below has raw data.
You can see on the second echogram small red points or lines in the water column and sea bottom that are interferences due to a noisy environment or to an echosounder. These interferences are mostly removed when Signal Interference Reduction filter is applied. The Medium level of the filter means data are moderately smoothed.