Types of Filters
This table shows the filters available, as well as dependencies when some filters are set as active (in some cases they work in combination).
Data Filters
| Filter | Definition | Filters Also Active |
|---|---|---|
| Min/Max | Removes data that is too high and not coherent with the maximum conditions of the vessel. This filter is particularly useful for depth or spread data. | None by default, but you can also select Rate of Change, Some Smoothing and More Smoothing in Advanced tab. |
| Rate of Change | Applies a limit of how fast data can change when sent and displayed on the user interface. It removes incoherent variations. It is useful on all data. | Min/Max |
| Some Smoothing | Smoothens data and prevents jumps in the display. This can add some delay to
the information displayed. This filter is particularly useful on pitch/roll,
spread, depth. It uses a Median filter to remove acoustic communication errors, and a Low-Pass filter to smoothen the form of the signal. |
Min/Max, Rate of Change |
| More Smoothing | Filters at higher grade than Some Smoothing. Creates more delay and detail in data may be lost. | Min/Max, Rate of Change |
| Debounced 2/3/4 | Only for catch sensors. Displays catch status as full when receiver has received 2, 3 or 4 "full" signals from catch sensor. You can also choose no filtering. | - |

Echogram Filters
- Signal Interference Reduction (Low, Medium, High)
- Echosounder Interference Reduction
- Echosounder and Interference Reduction (Low, Medium, High)
Choose accordingly to the level of noise you have, and if you want to see more or less interferences on the echogram. For example, if you have a low level of noise you can choose Echosounder Interference Reduction. If you have a high level of noise, you can choose Echosounder and Interference Reduction. Then, adapt the level of filtering (low/medium/high).
Here are examples of the effects of filters on echograms:
- Echosounder Interference Reduction Filter on a
TE/TS echogram:
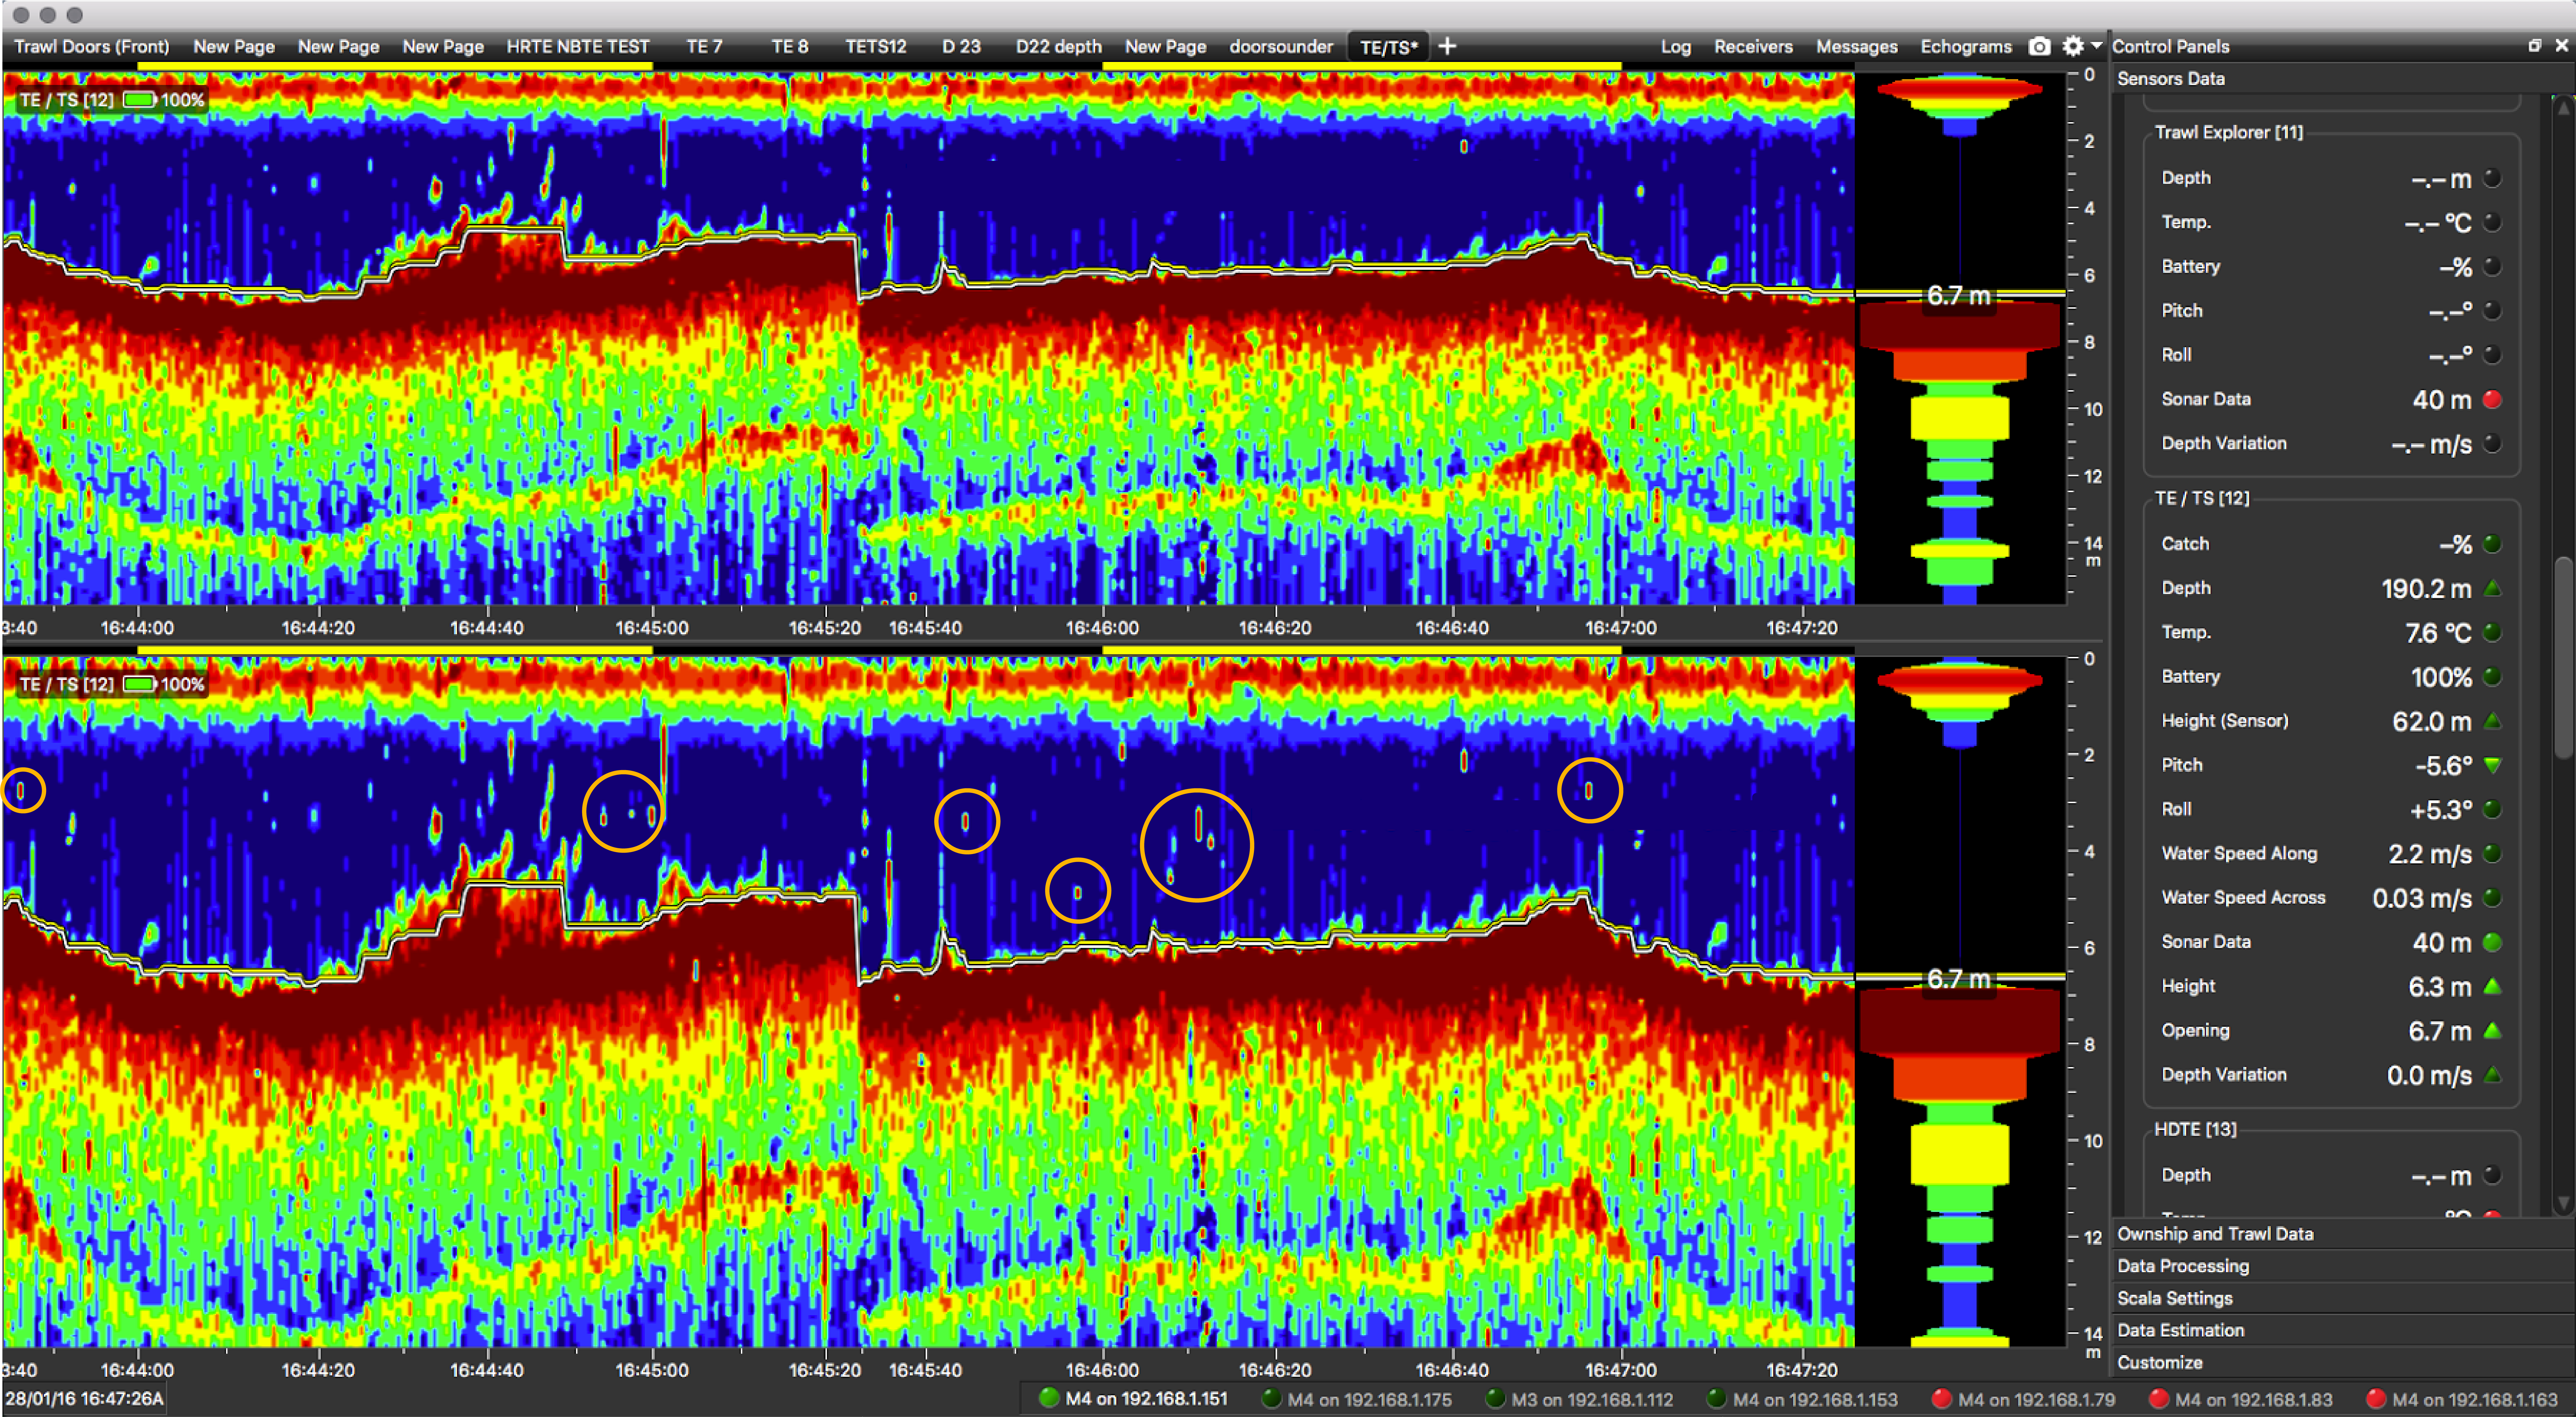
On the above picture, the top echogram has filtered data and the bottom echogram has raw data.
You can see on the second echogram that there are interferences due to an echosounder (circled in orange). These interferences are mostly removed when the Echosounder Interference Reduction filter is applied (first echogram).
- Signal Interference Reduction Medium Filter on a
TE/TS echogram:
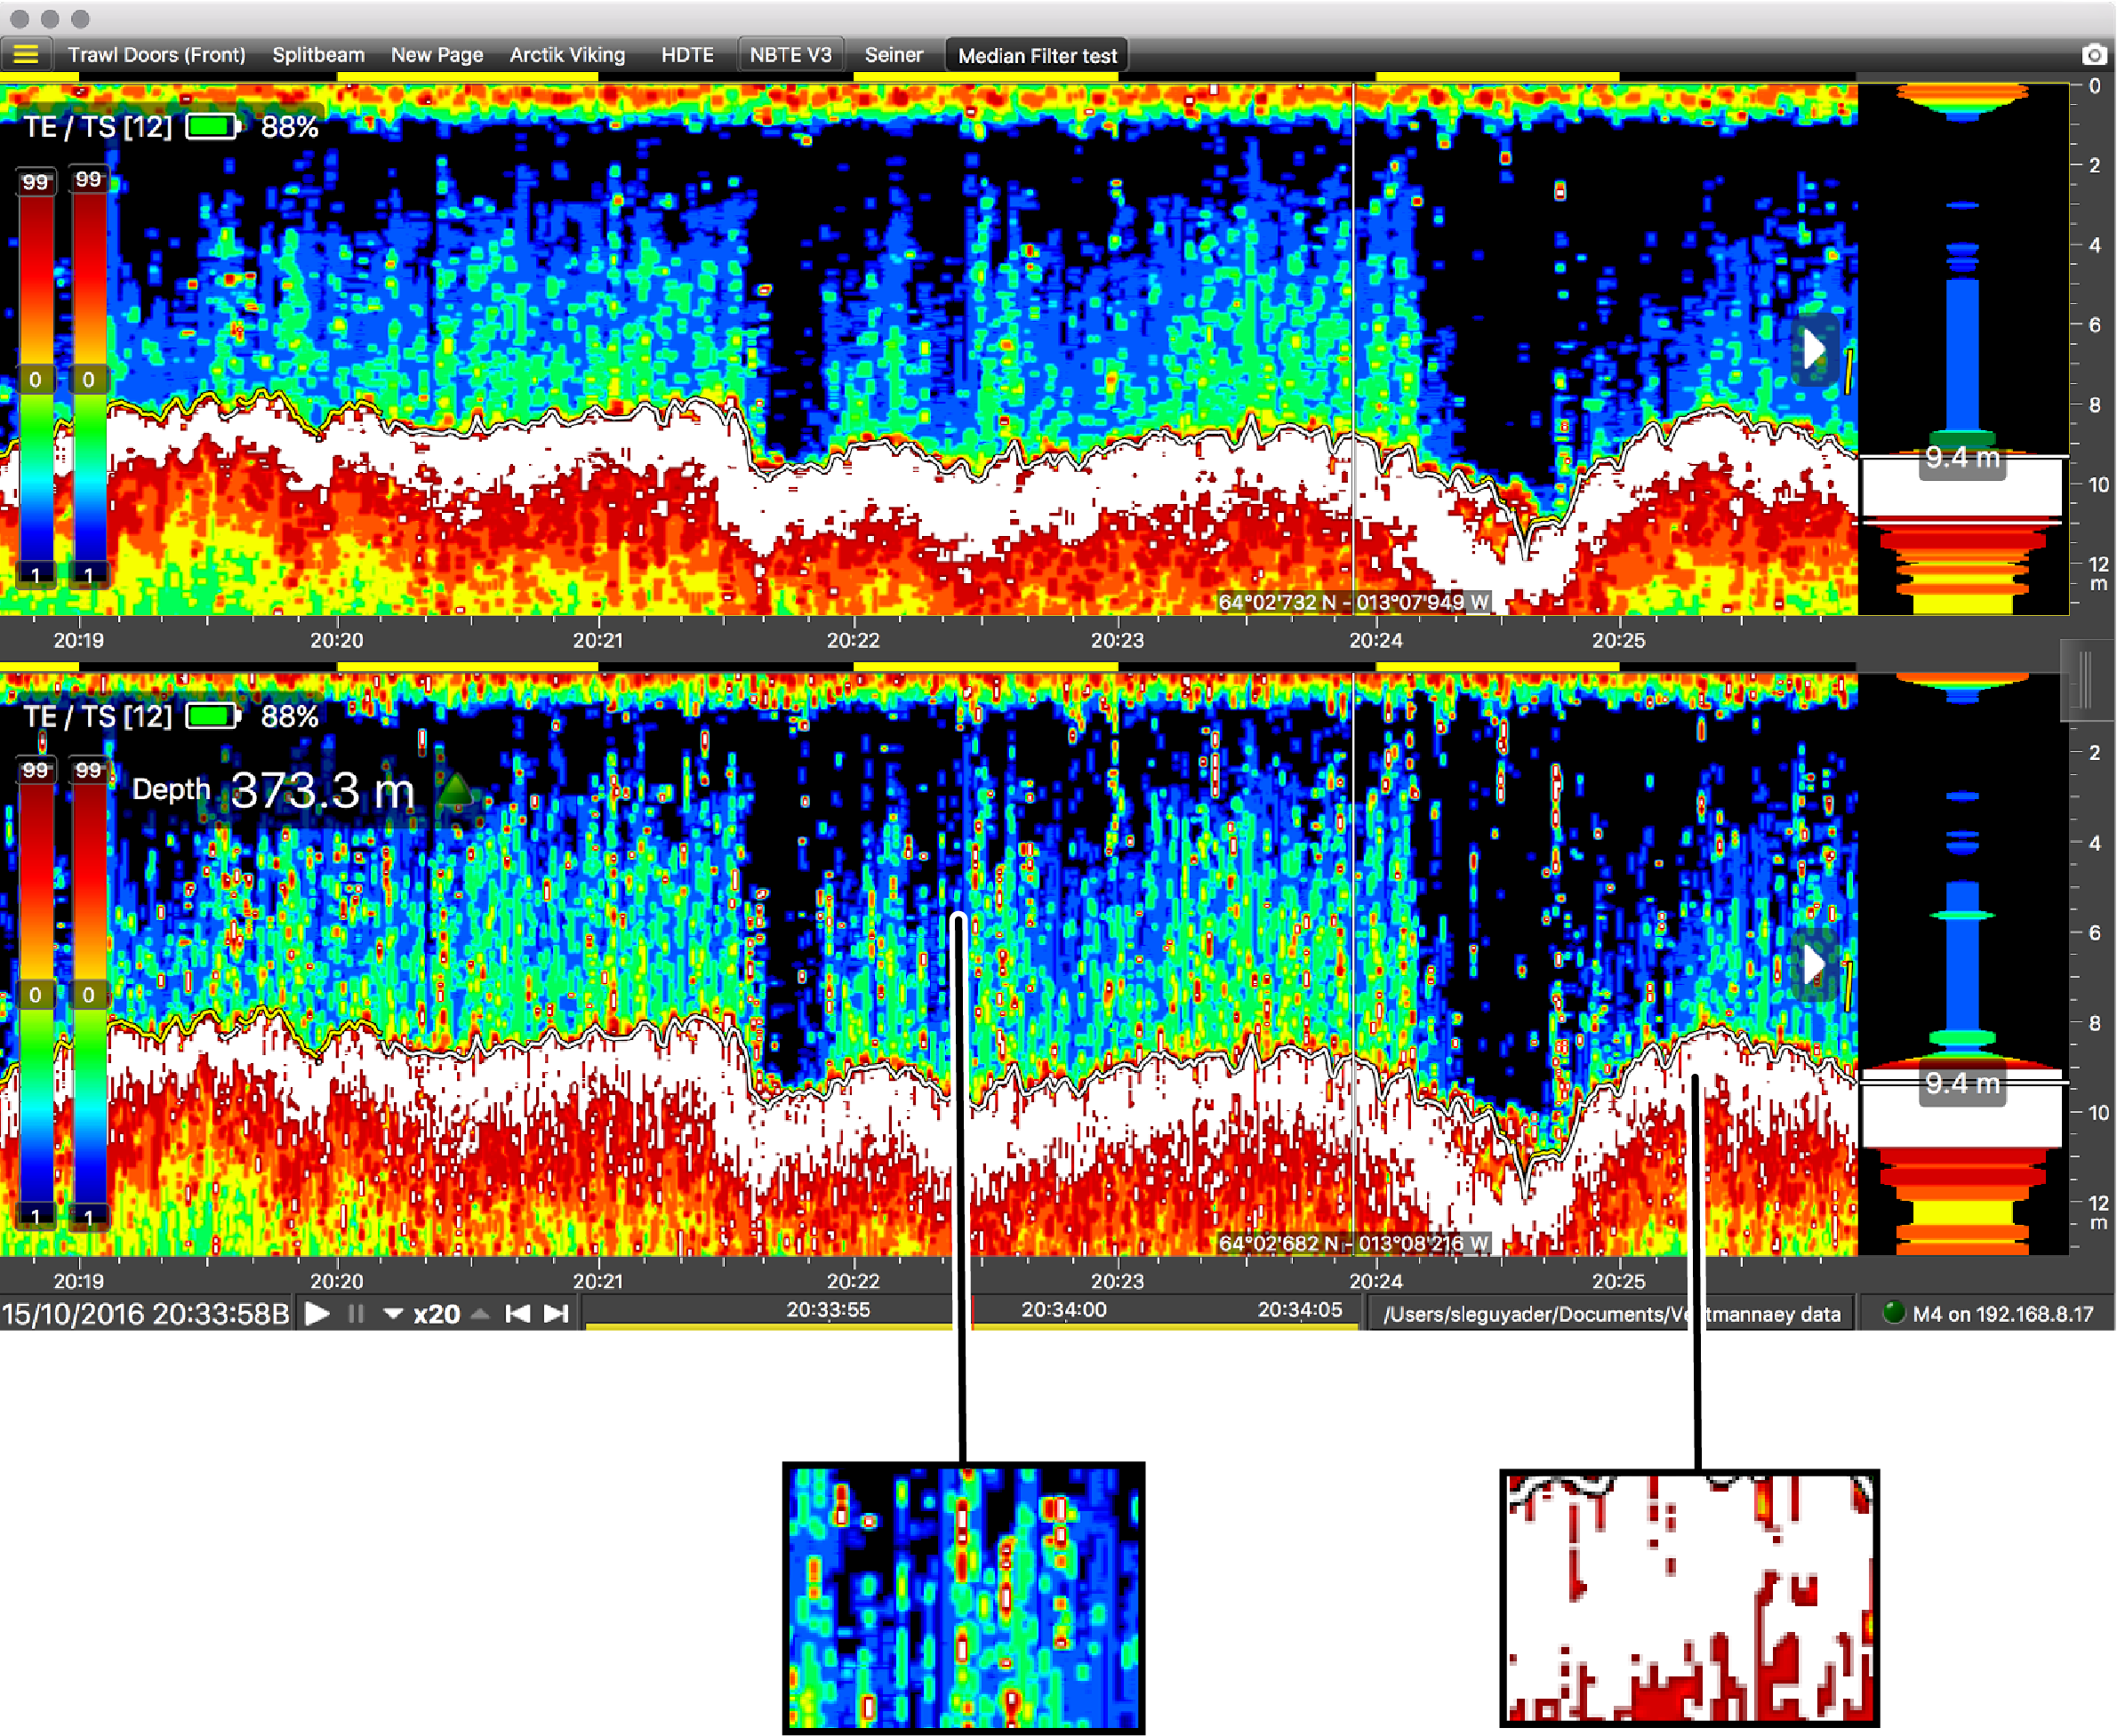
The echogram above has filtered data and echogram below has raw data.
You can see on the second echogram small red points or lines in the water column and sea bottom that are interferences due to a noisy environment or to an echosounder. These interferences are mostly removed when Signal Interference Reduction filter is applied. The Medium level of the filter means data are moderately smoothed.