Configuring Data Display on Scala2
You can display measurements of Seine sensors (e.g. depth, height, echogram...) on pages in Scala2.
About this task
Measurements taken by Seine sensors are displayed in
the control panels, under Mx. Data title
should be Trawl Explorer for a Seine Explorer and Depth or
Height for the other Seine
sensors. The title is followed by the node where the sensor was placed when added to
the system. Data displayed (e.g. depth, temperature, echogram) depend on the
firmware installed.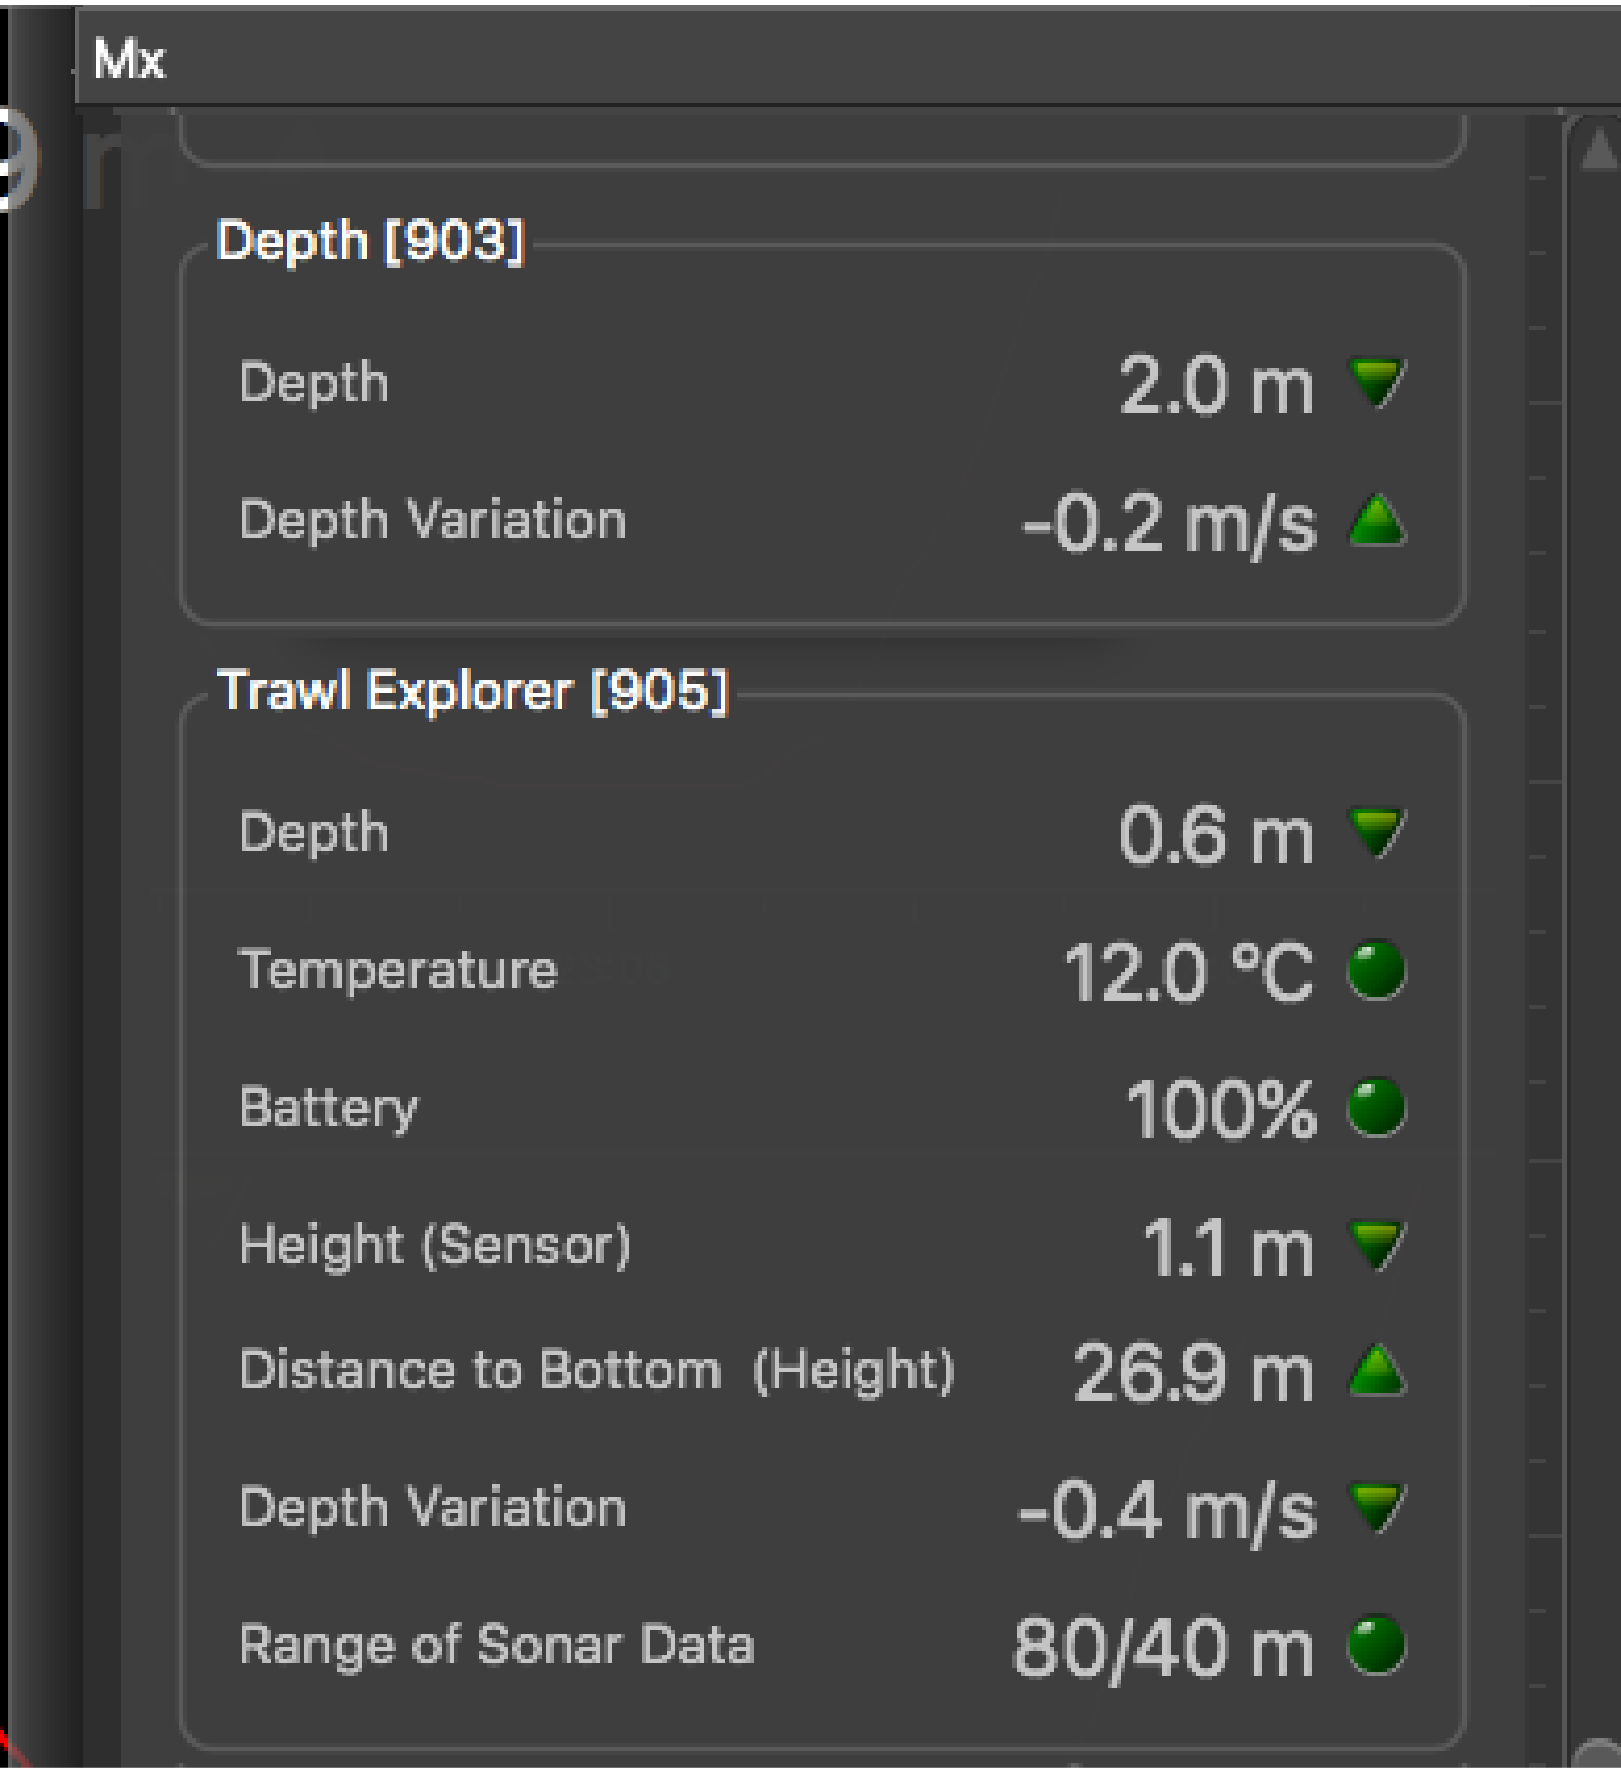 On Seine
sensors, the combination of depth and time allows you to know the descent rate of
the lead line.
On Seine
sensors, the combination of depth and time allows you to know the descent rate of
the lead line.
On Seine
sensors, the combination of depth and time allows you to know the descent rate of
the lead line.Procedure
-
From the top left corner of the screen, click
Menu
 > Customize and enter the password eureka.
-
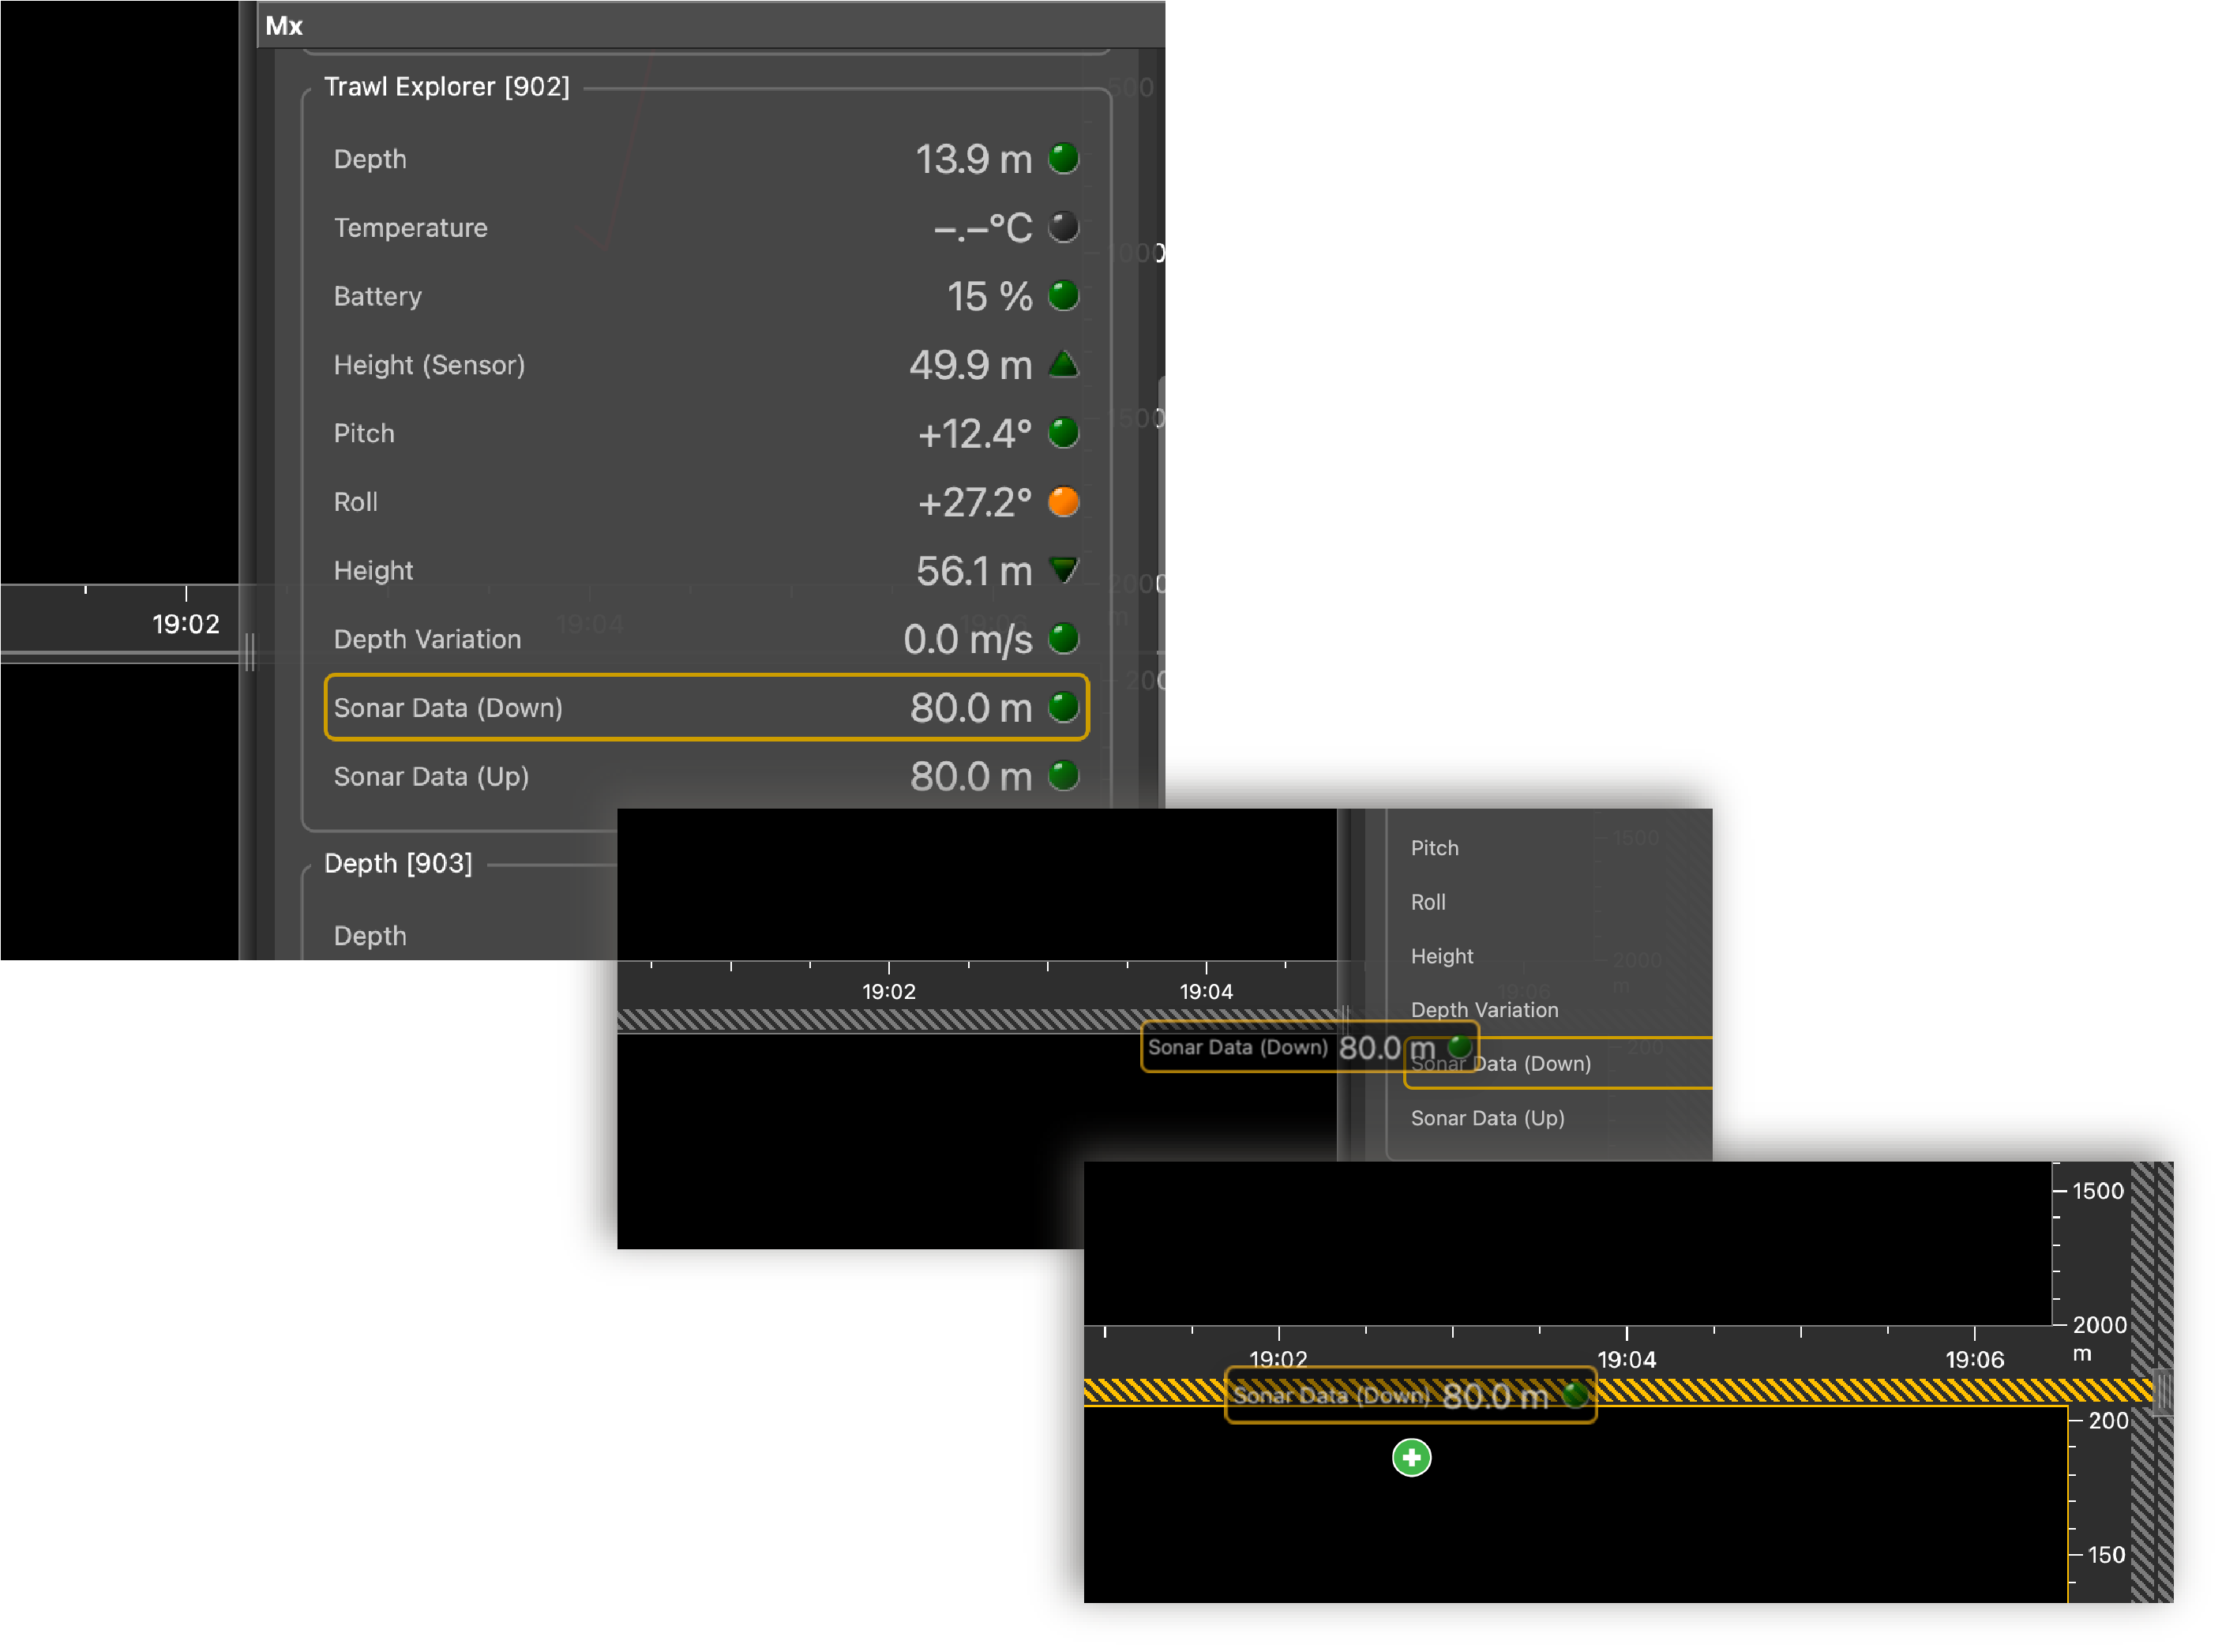
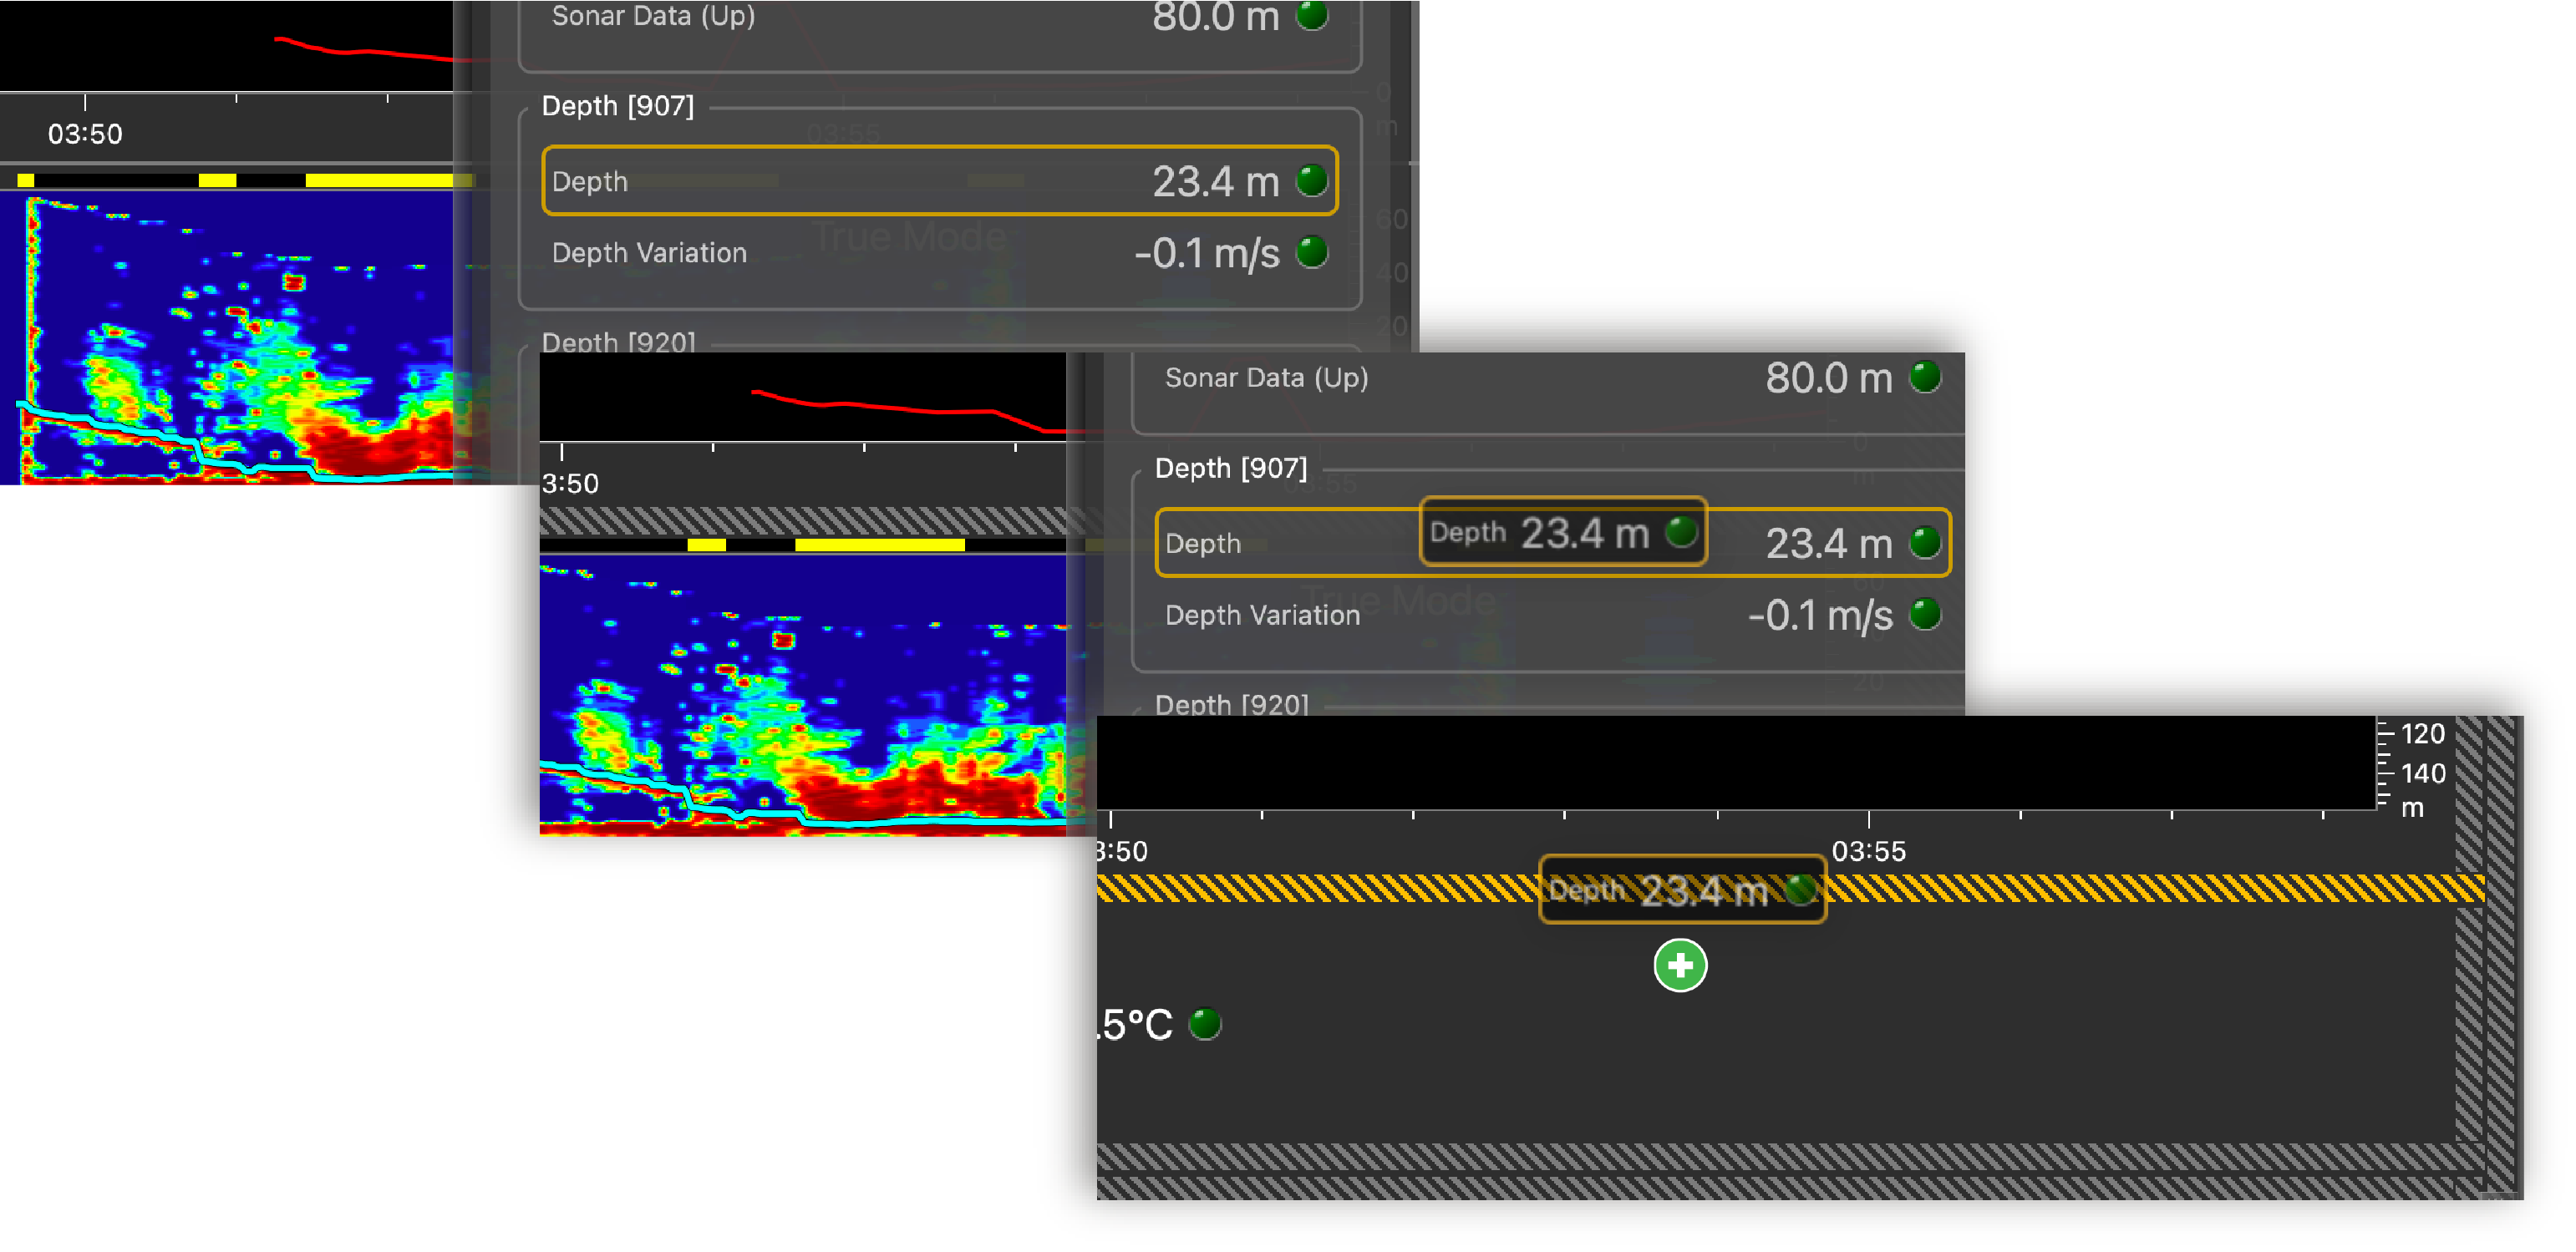
To display echogram images from a Seine Explorer: go to
Mx tab, then click + hold Sonar Data of the Trawl
Explorer and drag it to the page display.
-
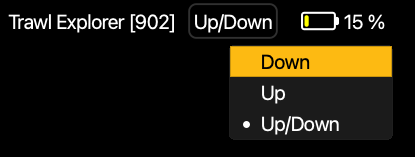
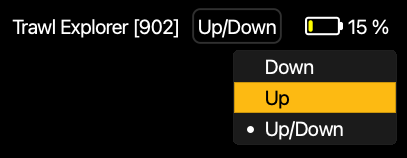
Drag Sonar Data from a Trawl Explorer to a page and change the sounding direction to
Down.
-
Click
 > True Mode to see the descent of the sensor.
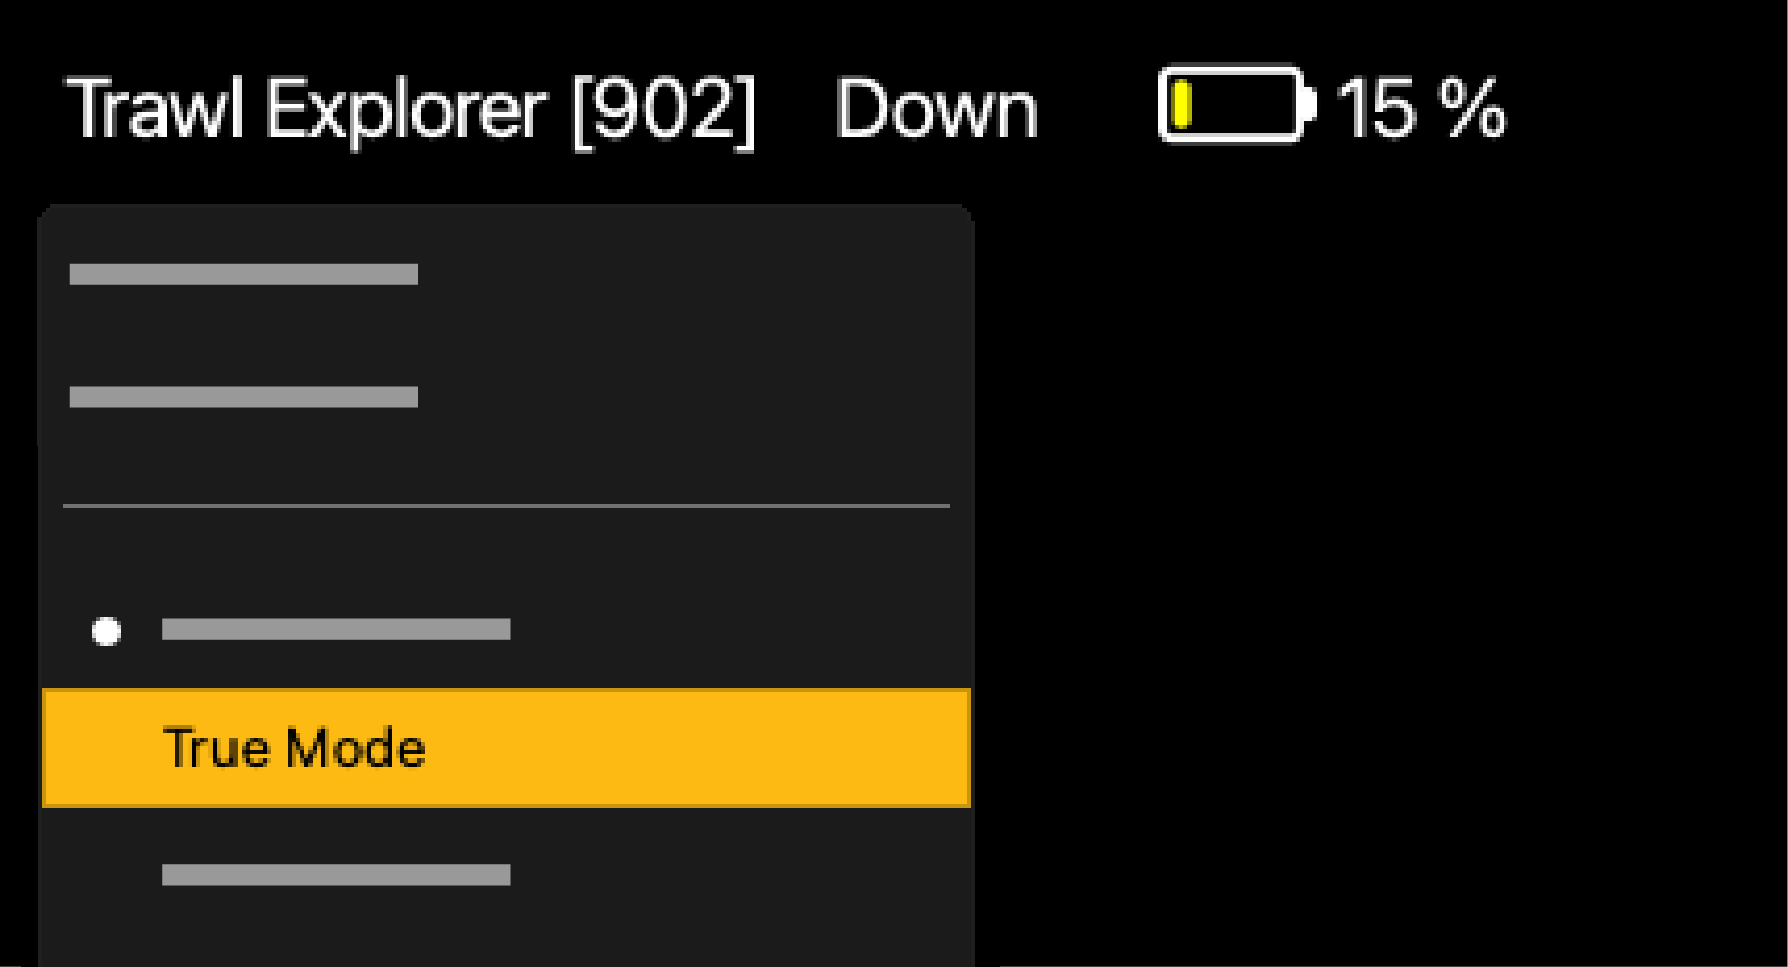 Note: When True Mode option is activated, the echogram is displayed beginning from the water surface (1). When the option is deactivated, the echogram is displayed beginning from the sensor position (2).
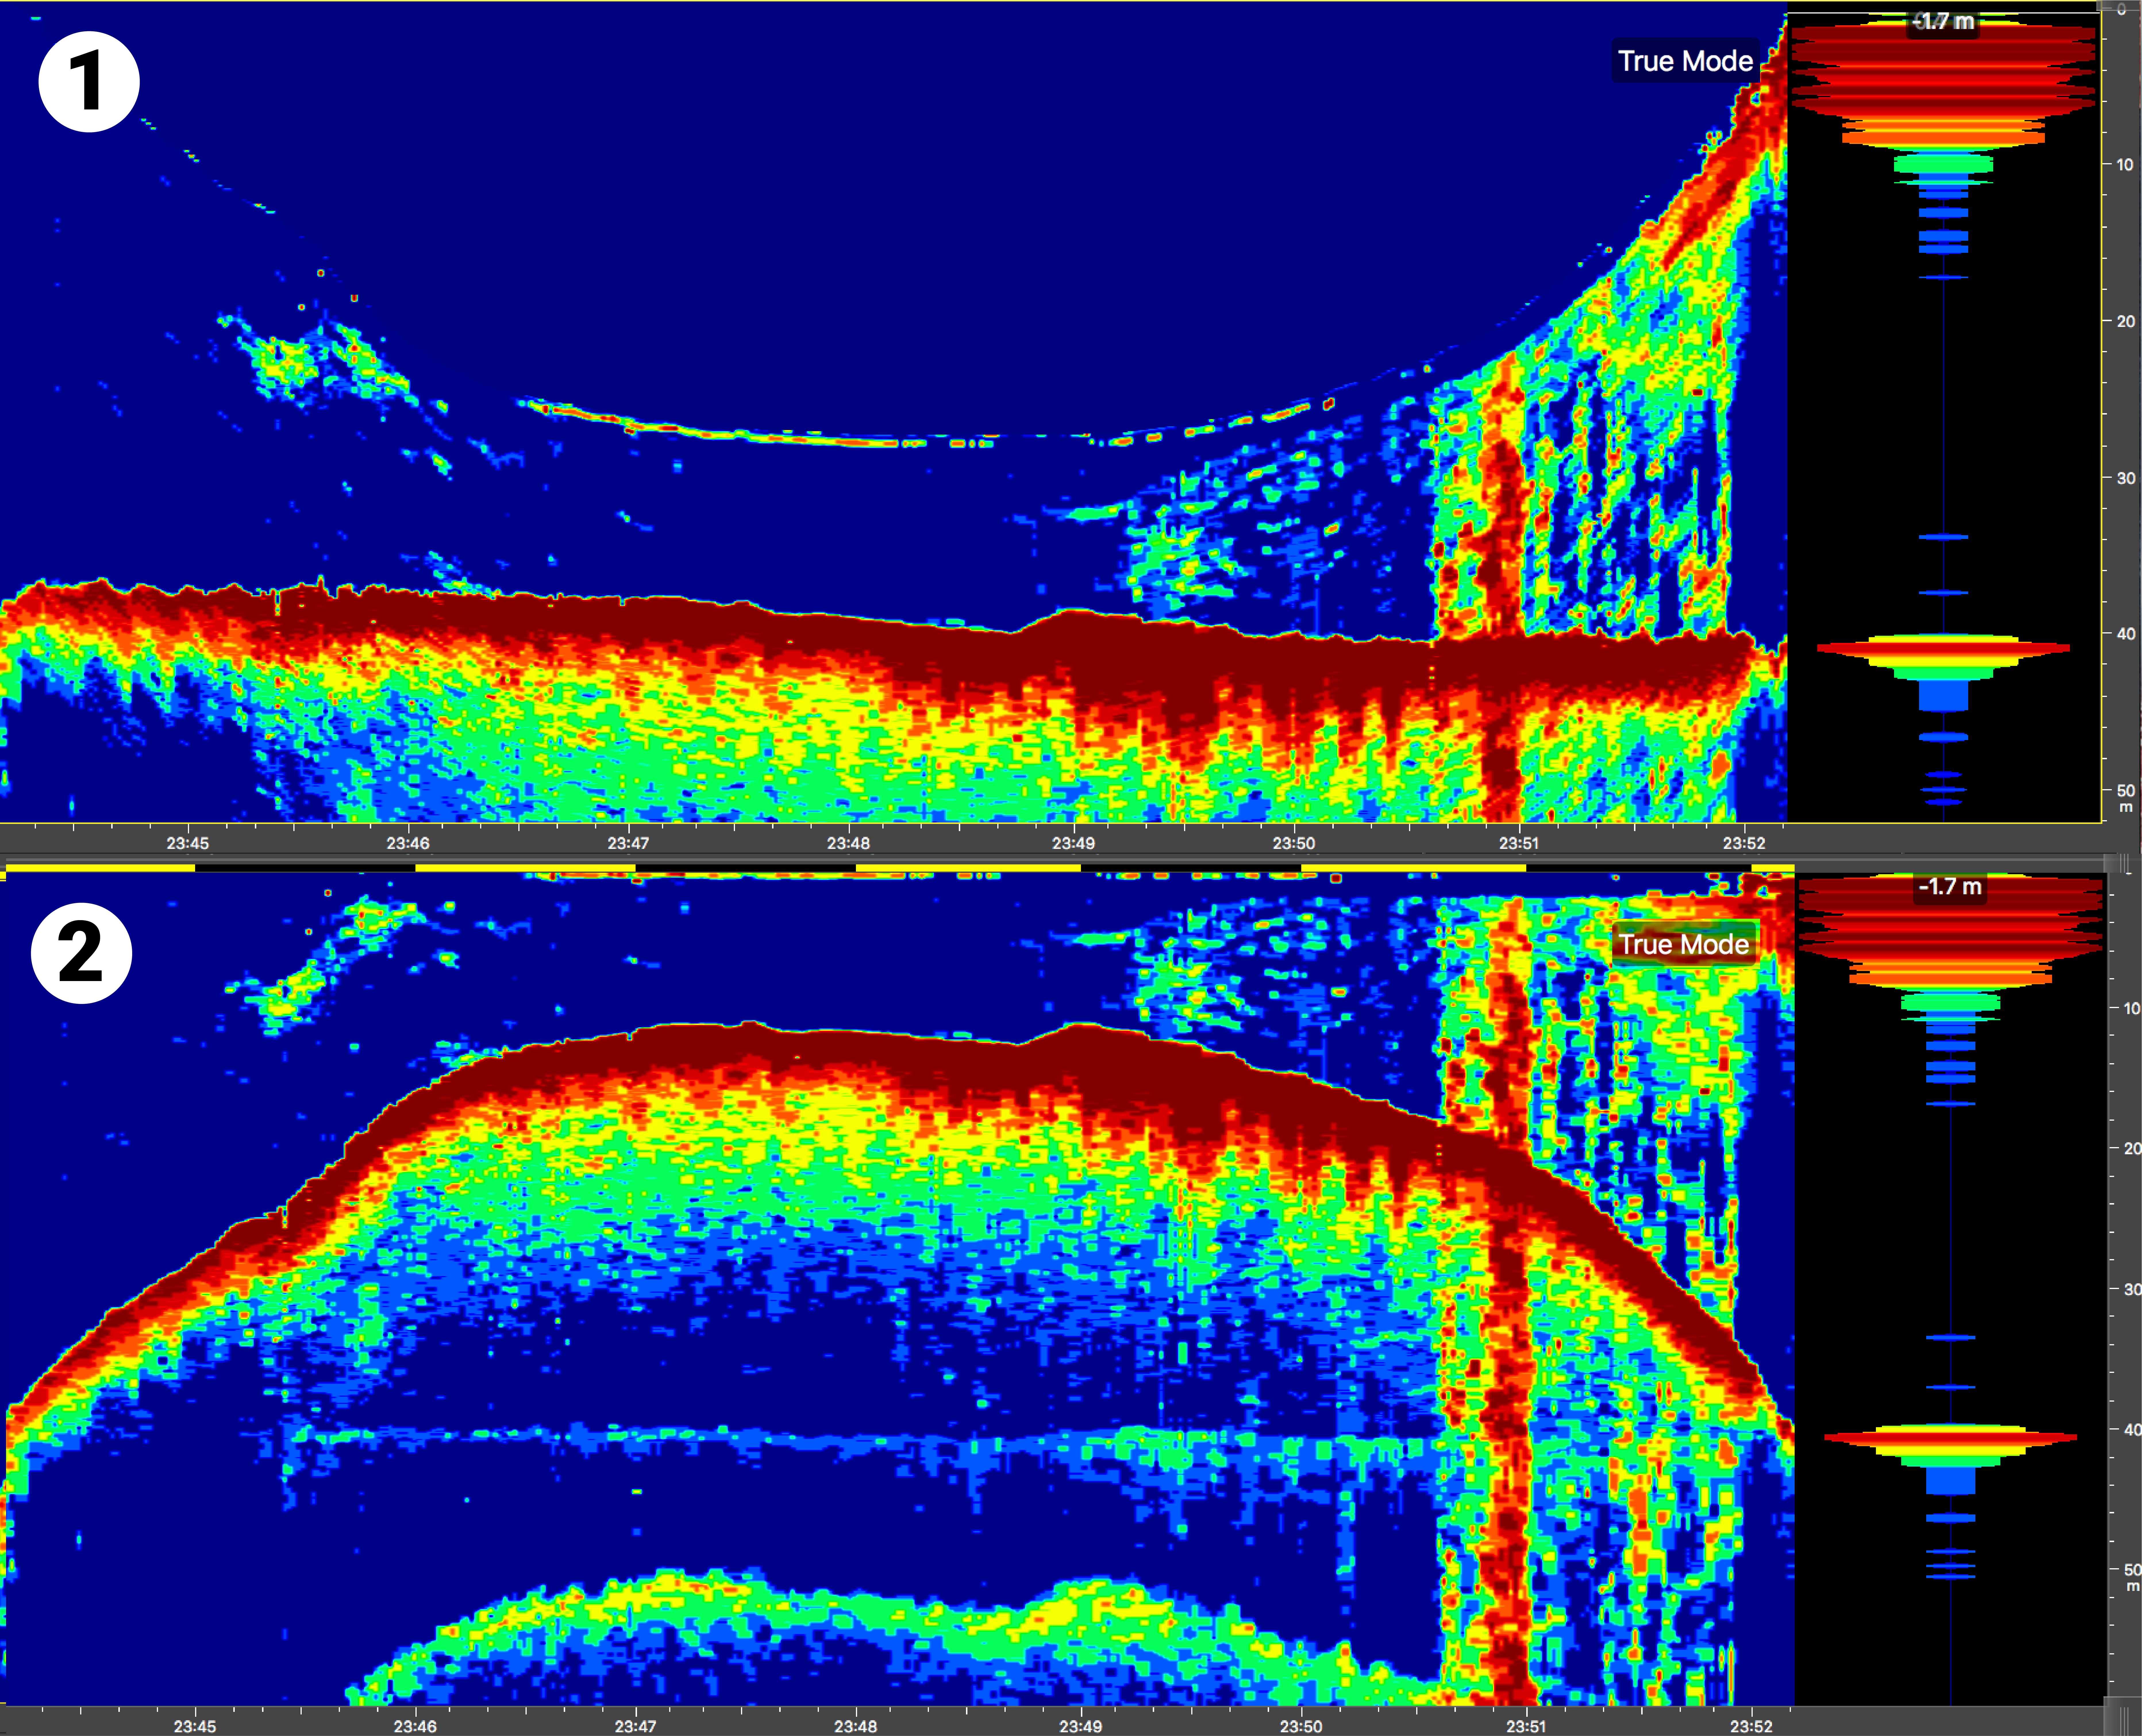
-
To clearly identify the lead line and sea bottom, click on the echogram and select Draw Bottom
Line.
White lines follow the lead line and sea bottom.
Without bottom line With bottom line 
-
If the sensor has a side-looking sounding:
-
Change the sounding direction to Up.
-
On the echogram, click
 , then click Vertical
Display to see the contents on the
seine purse as the sensor goes down.
, then click Vertical
Display to see the contents on the
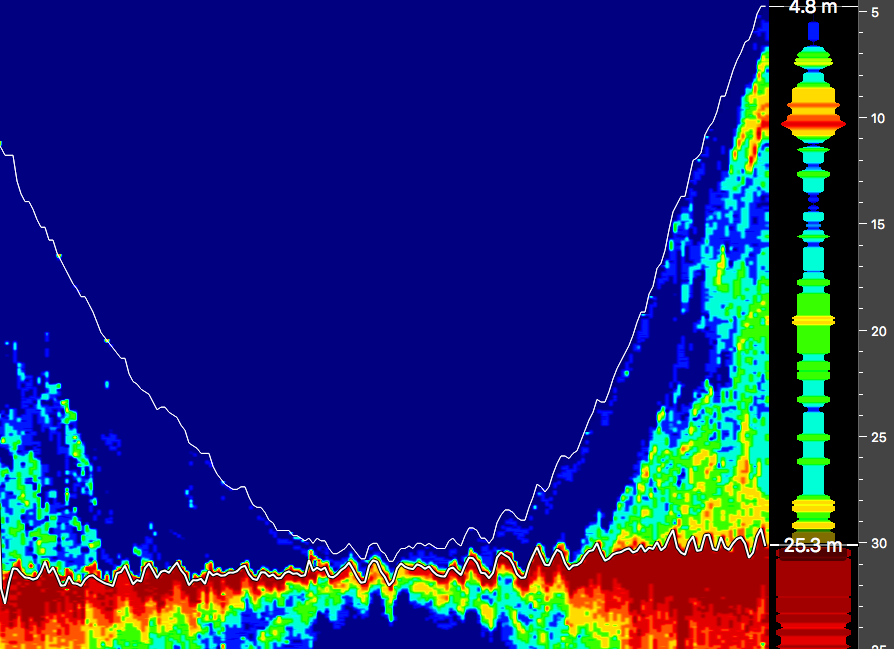
seine purse as the sensor goes down.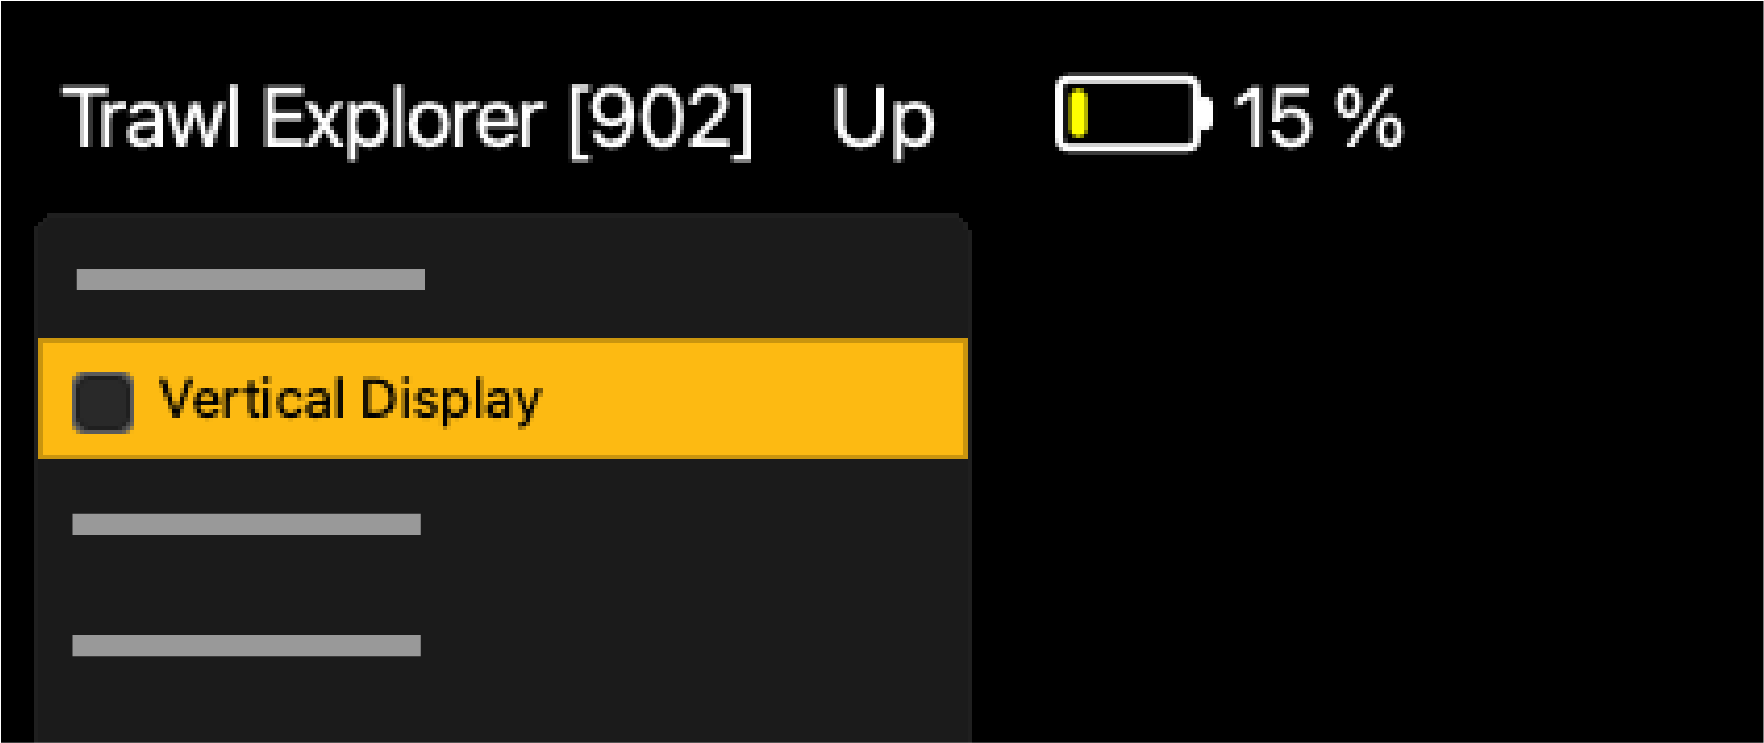 The echogram displays the contents of the area being surrounded by the net, during its descent. This way, you can see if there are schools of fish.Note: The echogram is displayed turned 90° to the left. The bottom of the echogram corresponds to the location of the sensor.
-
Change the sounding direction to Up.
-
To display depth data from all your sensors in a same history plot:
-
From Mx, click+ hold
Depth data from a depth sensor and drag it to
the page.
-
Again, click + hold Depth data from another
seine sensor and drag it above the history plot you have created.
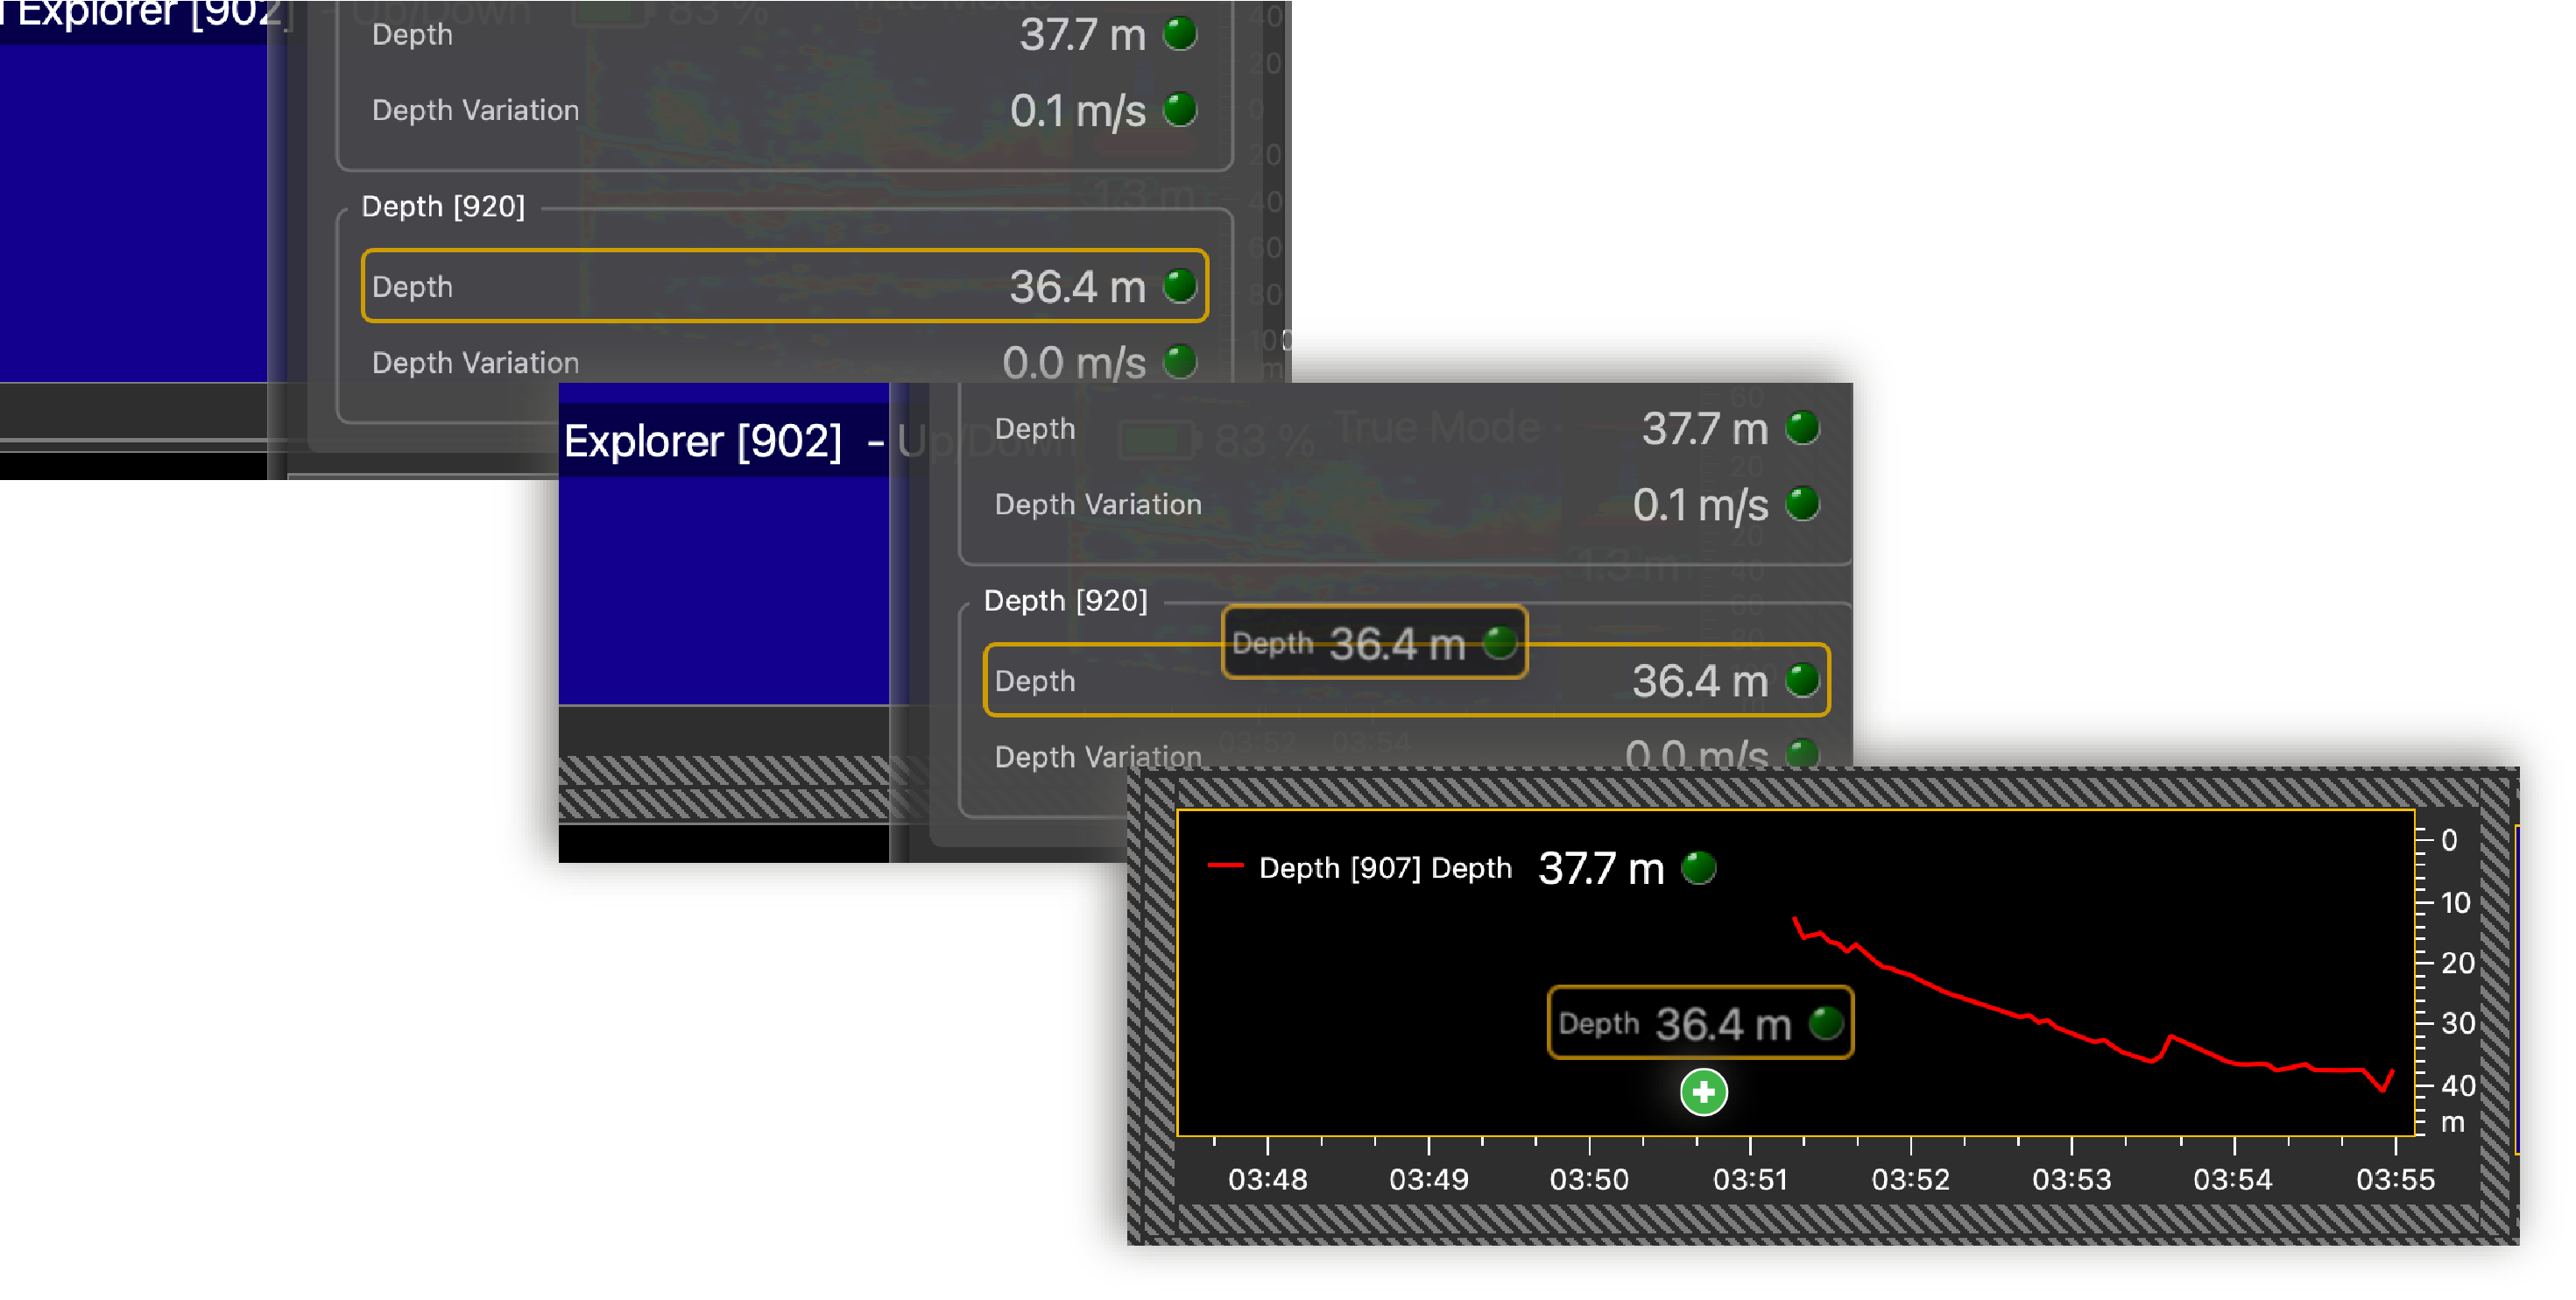 Depth data from both sensors are displayed together. If you have other depth data from seine sensors, repeat the steps.
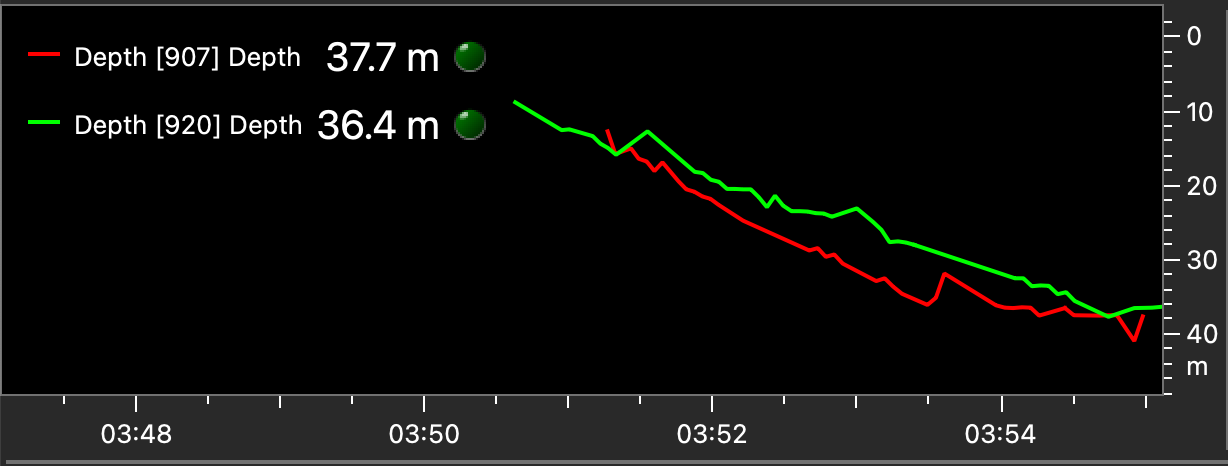
-
From Mx, click+ hold
Depth data from a depth sensor and drag it to
the page.
-
If you have an echosounder on the hull of the vessel and receive its data on
Scala2, you can add its depth measurements
to the depth plots:
-
From NMEA Inputs, click + hold
Depth Below
Transducer data and
drag it above the depth plots.
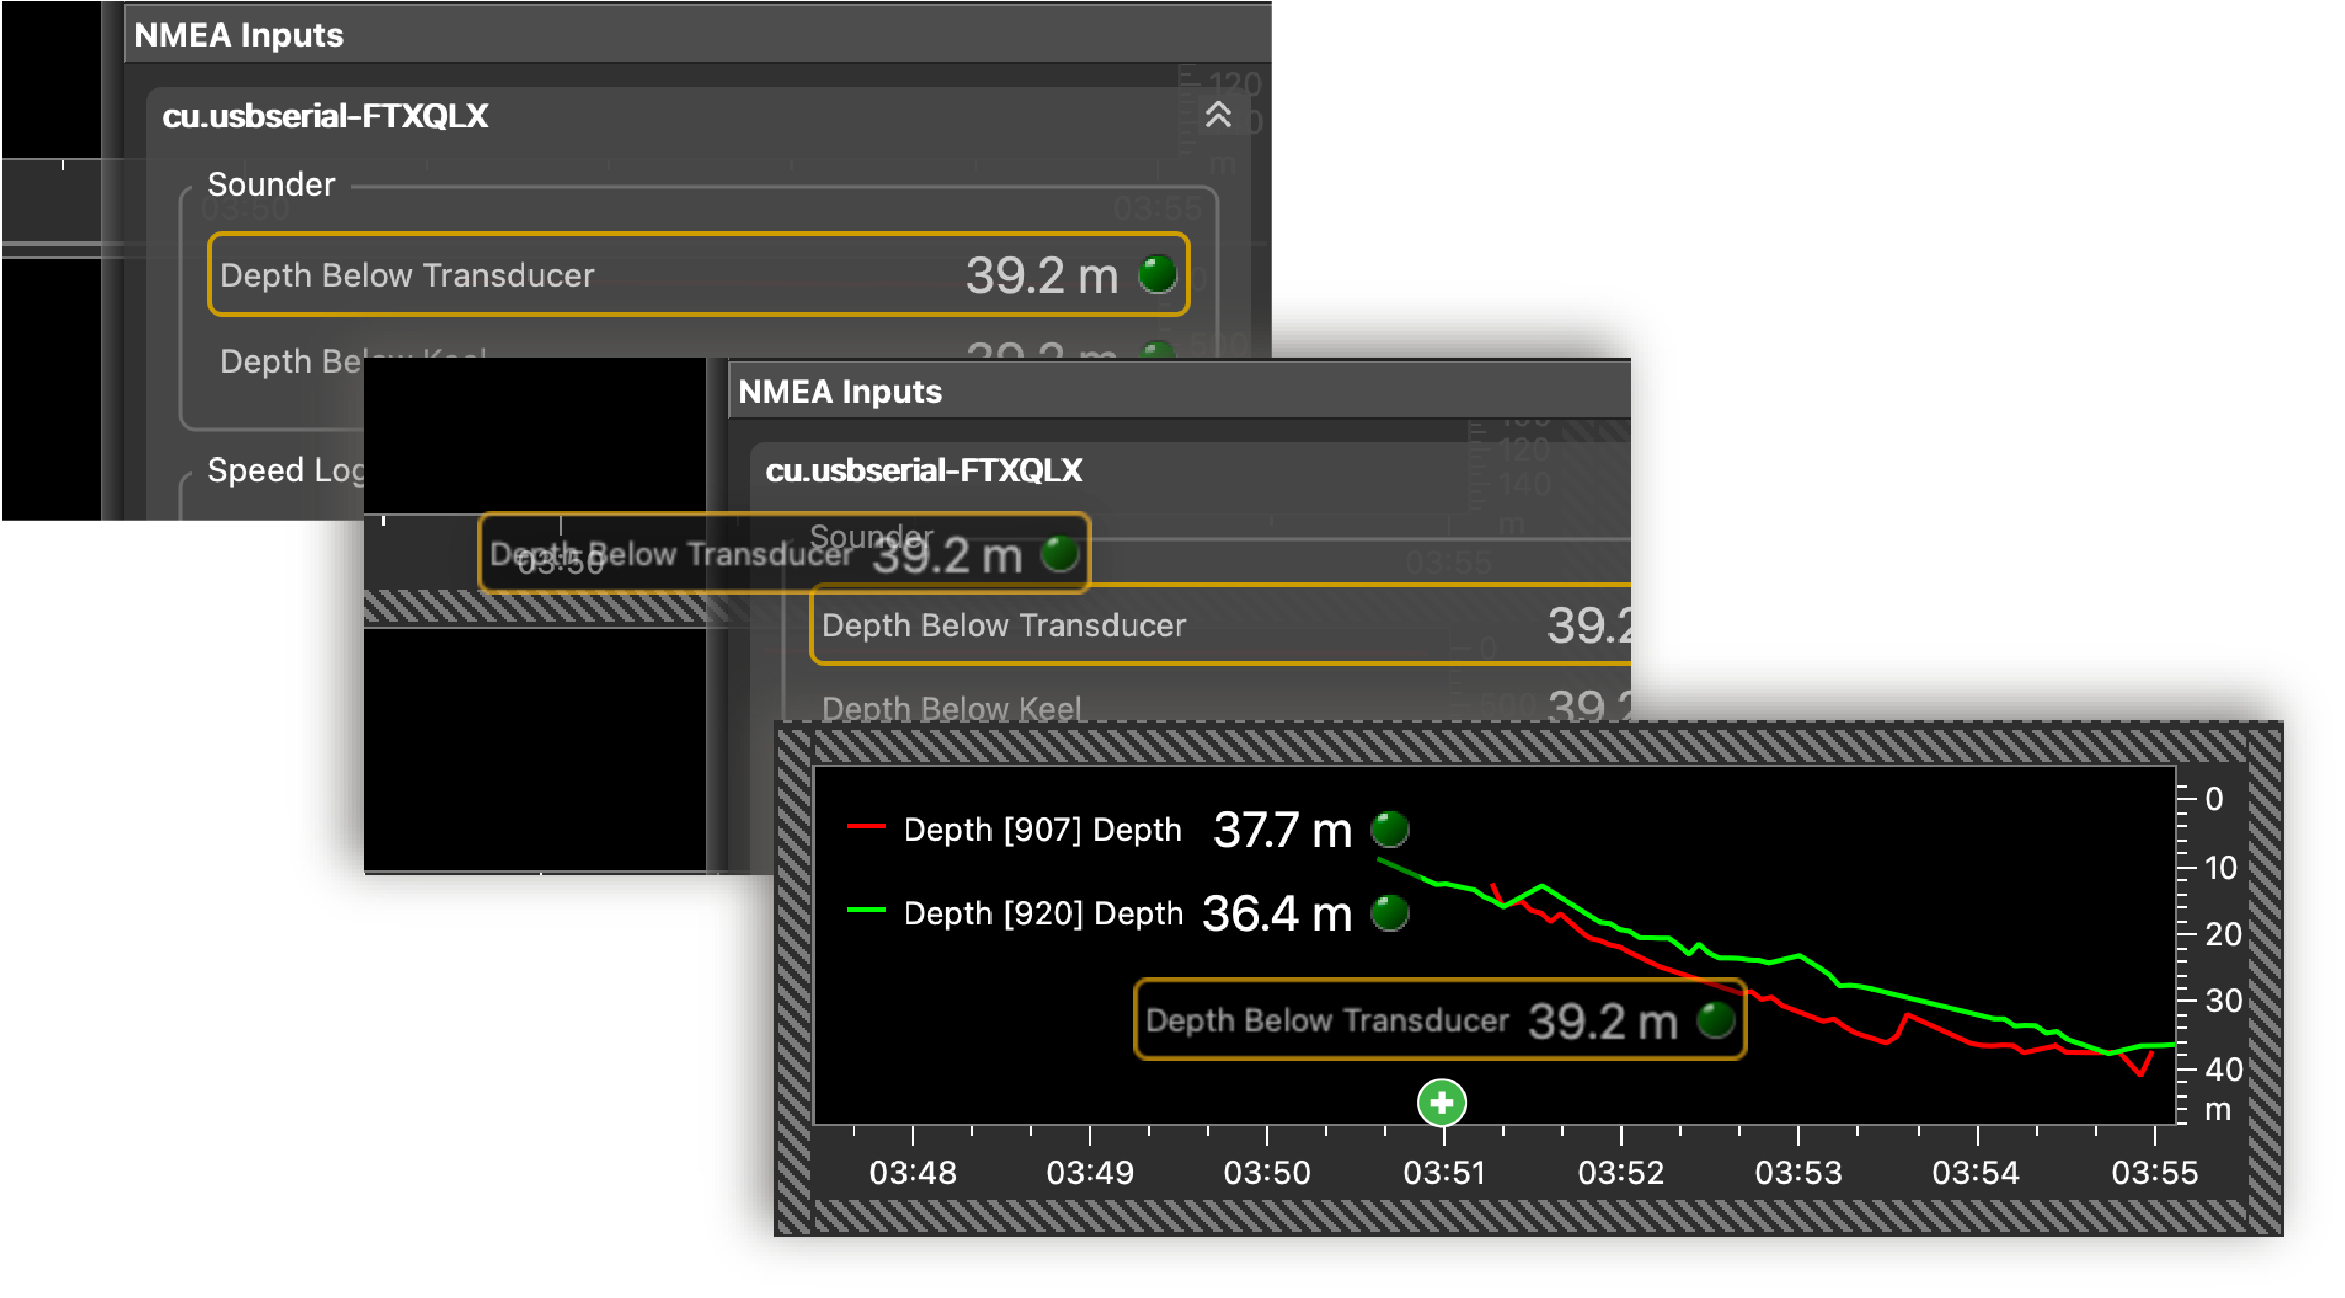 The seabed is displayed (yellow). This way, you can see if the sensor is close to the seabed.
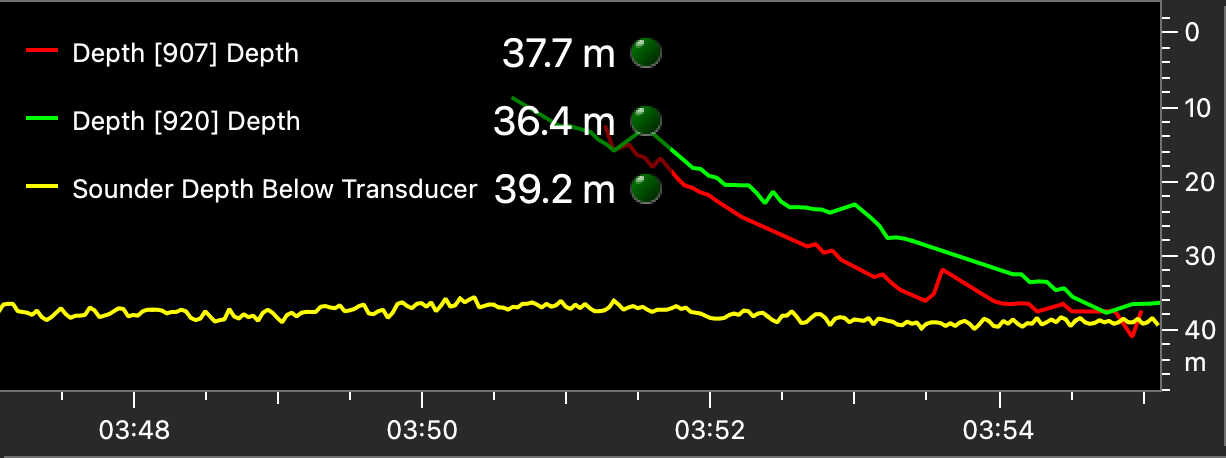
-
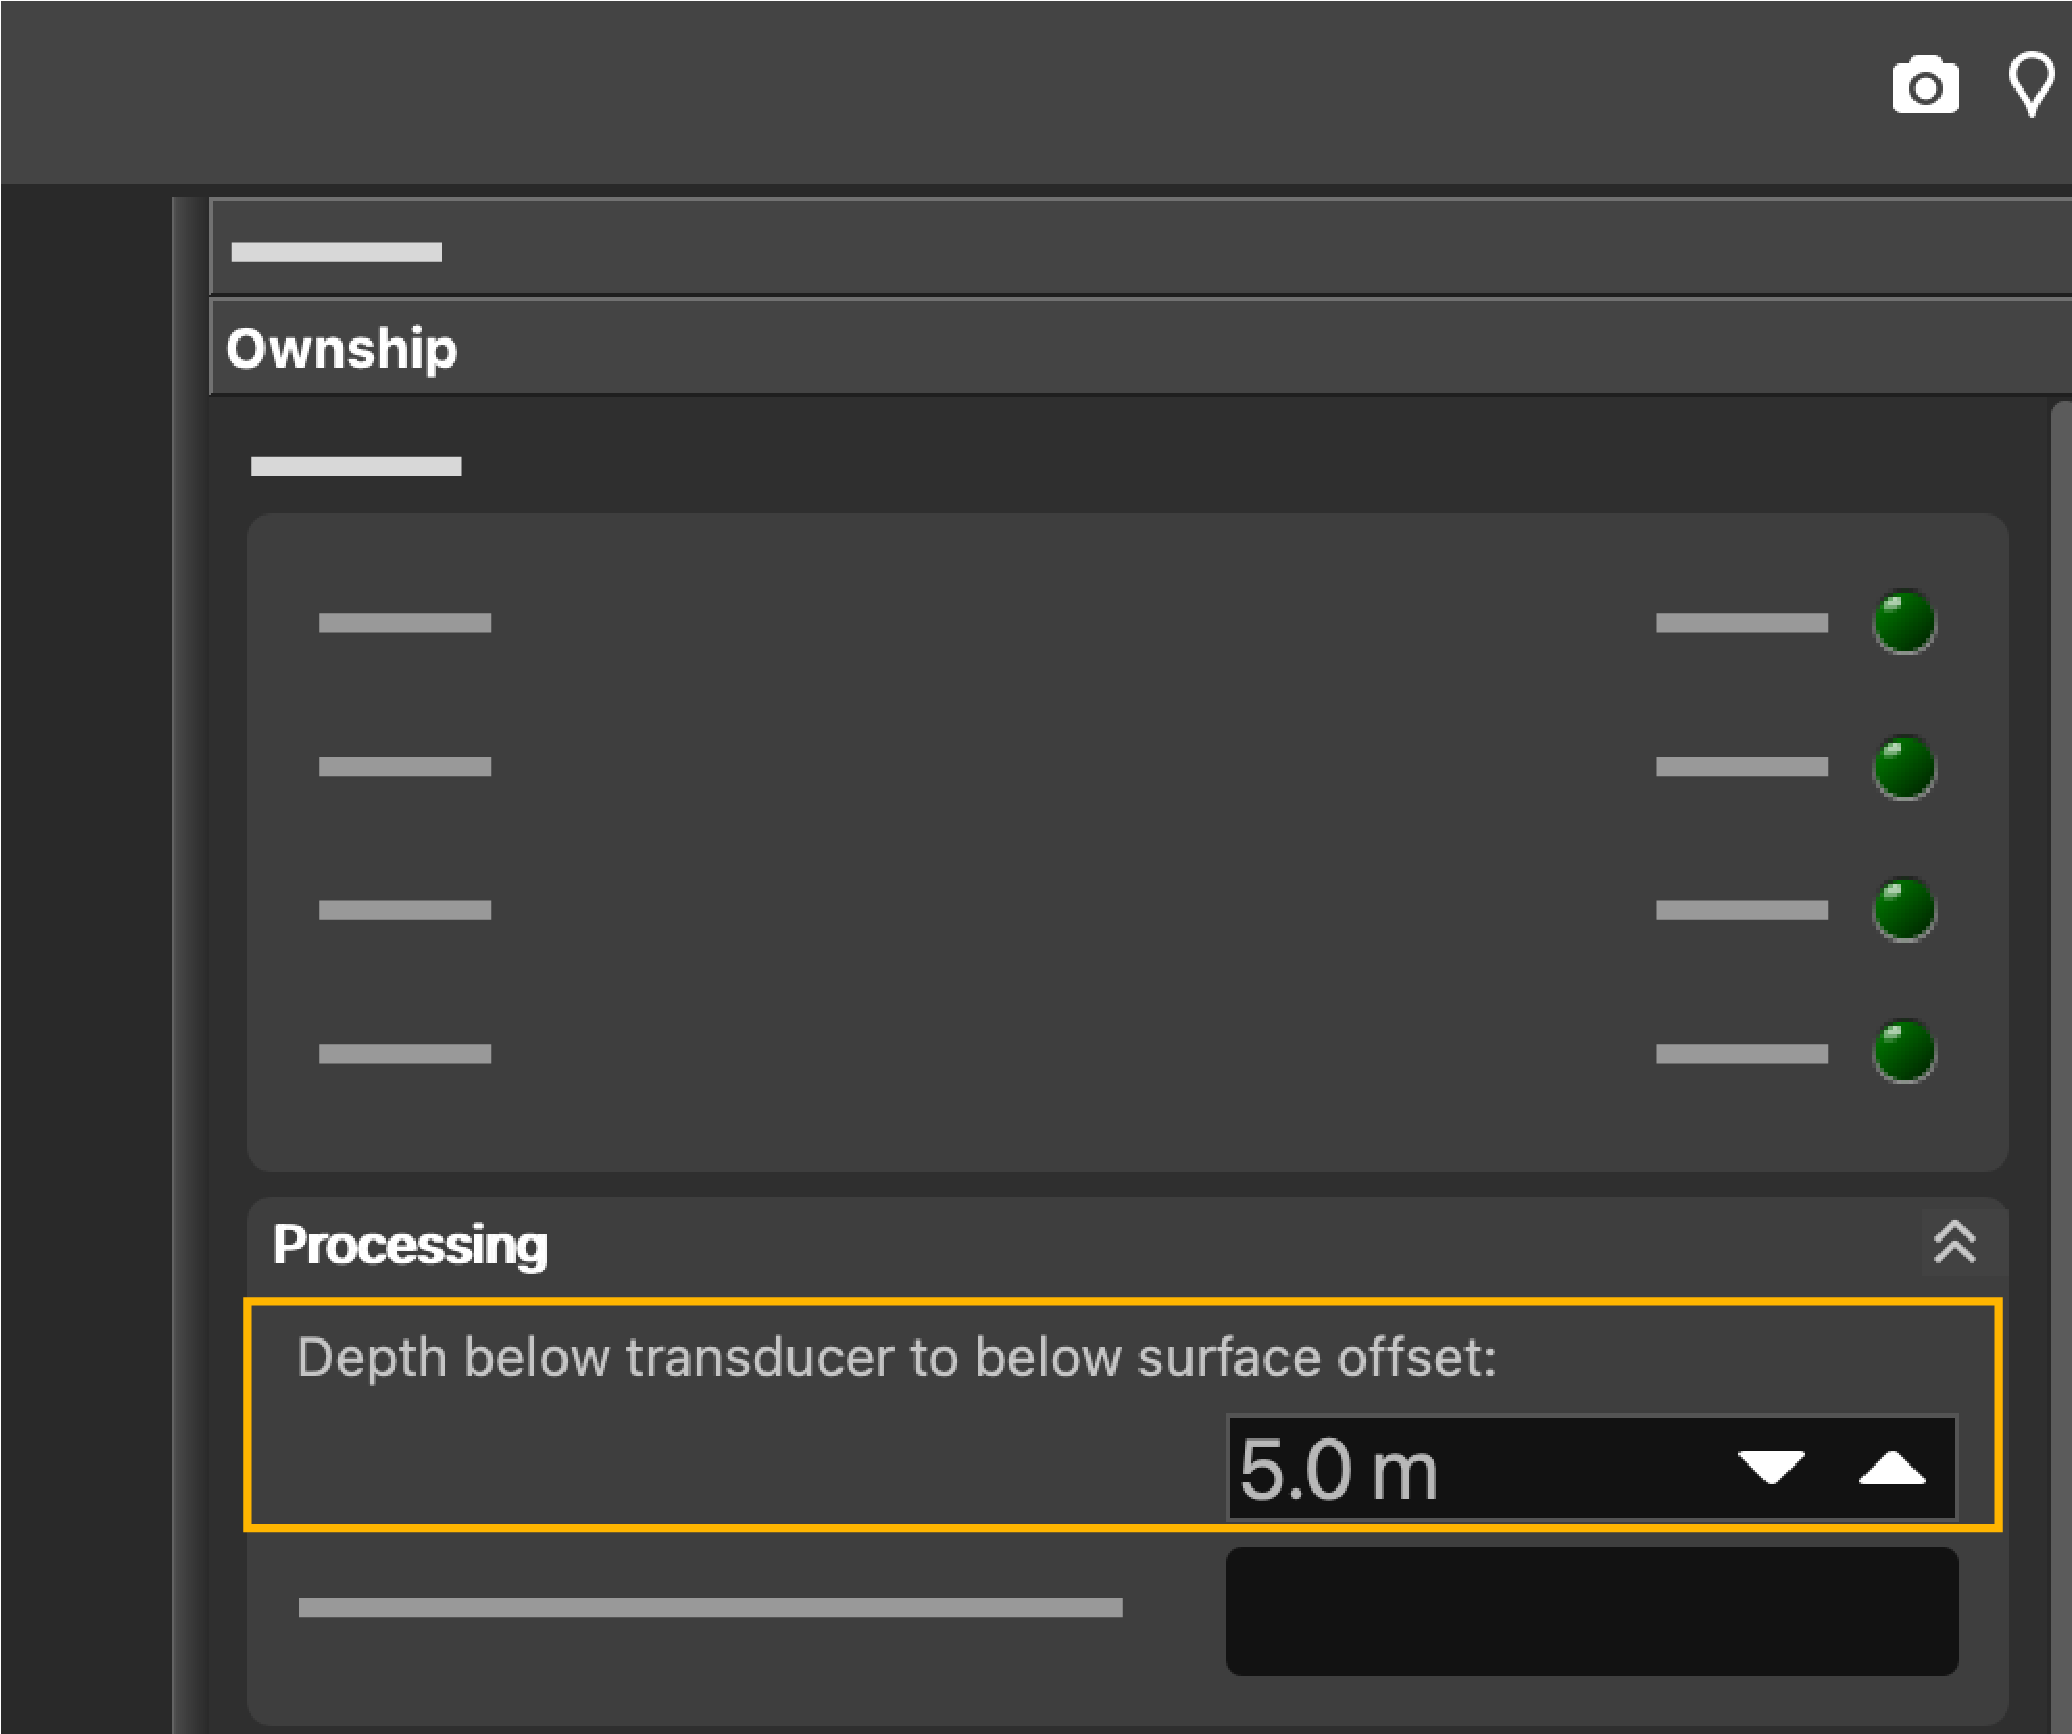
If on the plot, the line of the depth sensor goes under the seabed line
(depth below transducer), you need to put an offset to the echosounder's
depth. Open the control panels and go to . Then, enter the difference of depth that you see on the
plot in Depth below transducer to
below surface offset. This
time, drag Depth Below Surface data instead of
Depth Below Transducer.
Note: The sensor and echosounder may not display the same depth because there are not installed on the same location on the hull and measure depth in two different ways (from the water pressure for the sensor, and from wave of sounds for the echosounder). -
From NMEA Inputs, click + hold
Depth Below
Transducer data and
drag it above the depth plots.
-
To display other data, such as height or temperature:
- From Mx, click+ hold data from a sensor and drag it to the page.
- From Choose new Gauge Type, choose a type of display.
Note:- Depth: distance from the head of the sensor to the water surface.
- Height (Sensor): distance from the sensor to the seabed, sent from the sensor.
- Distance to Bottom (Height): distance from the sensor to the seabed, calculated by Scala2.
- Depth Variation: useful to control the speed of the descent
-
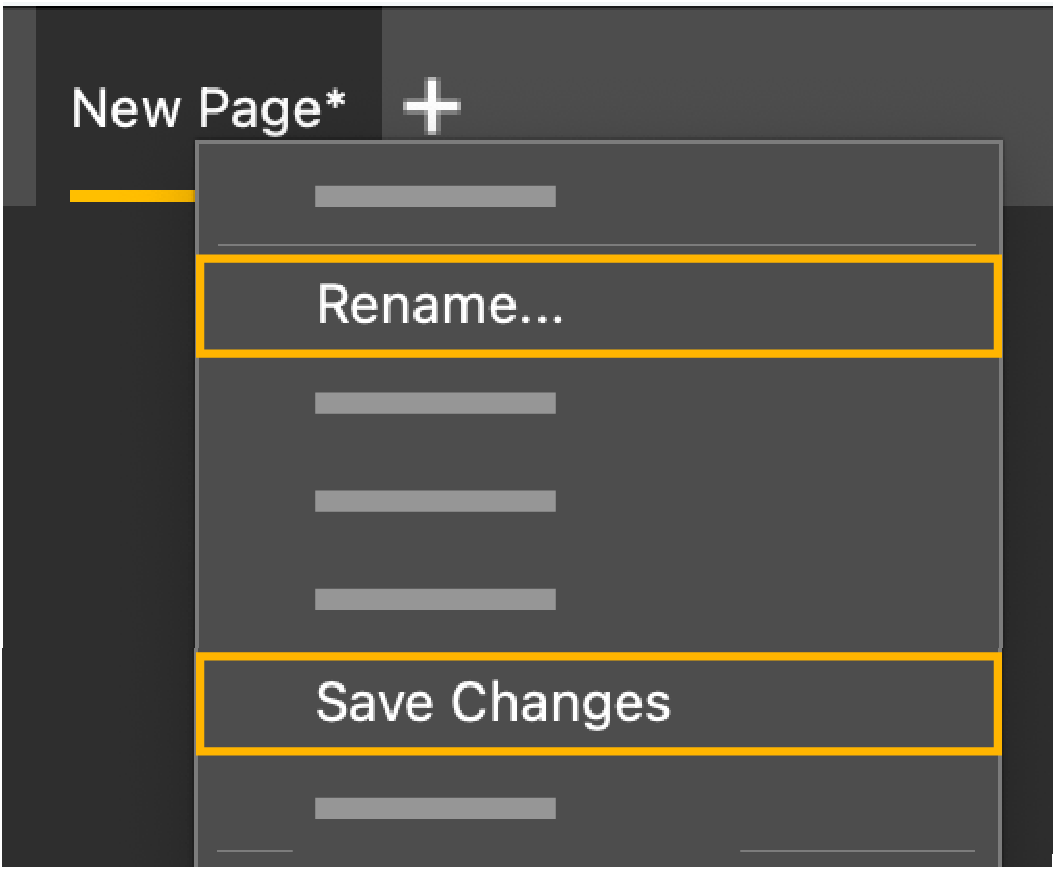
To save the changes you made:
- To rename the page, right-click the name of the page and click Rename.
-
To save the page, right-click the name of the page and click Save Changes.
-
Deactivate the Customize mode when you have finished
customizing pages: click Menu > Customize again.