Checking Noise Interference
Use the spectrum analyzer to check the noise level of the hydrophones and check for interference.
Procedure
-
Click Add
 to create a new page on which you will add the spectrum analyzer(s).
-
Right-click the IP address of the receiver in the status bar and click
Start Spectrum.
- Open the control panels and go to the Mx panel.
-
Go to Hydrophone data, then drag and
drop Spectrum data to a page. These data
appear only when the spectrum has been started.
-
The spectrum analyzer is displayed. You can display up to 6 spectrum analyzers
at the same time. Below is an example of a page with two spectrum
analyzers.
 The FFT plot shows three levels of noise
in dBV:
The FFT plot shows three levels of noise
in dBV:- RealTime (white): level of noise recorded in real time.
- Mean (cyan): mean recorded level of noise. It is useful to assess the noise floor.
- Max (dark blue): shows the latest highest level of noise recorded. It is useful to see on which frequencies are the sensors.
The acceptable average level of noise depends on the conditions (distance from the sensor to the hydrophone, fishing method, type of hydrophone). You can have better performance with the following levels:
- Active wideband hydrophone with high/low gain: below -100 dBV
- Active narrowband: NC-1-04 below -80 dBV / NC-1-07 below -100 dBv
- Passive hydrophone: below -110 dBV
- Scroll on the frequency or dBV scales to zoom in and out.
-
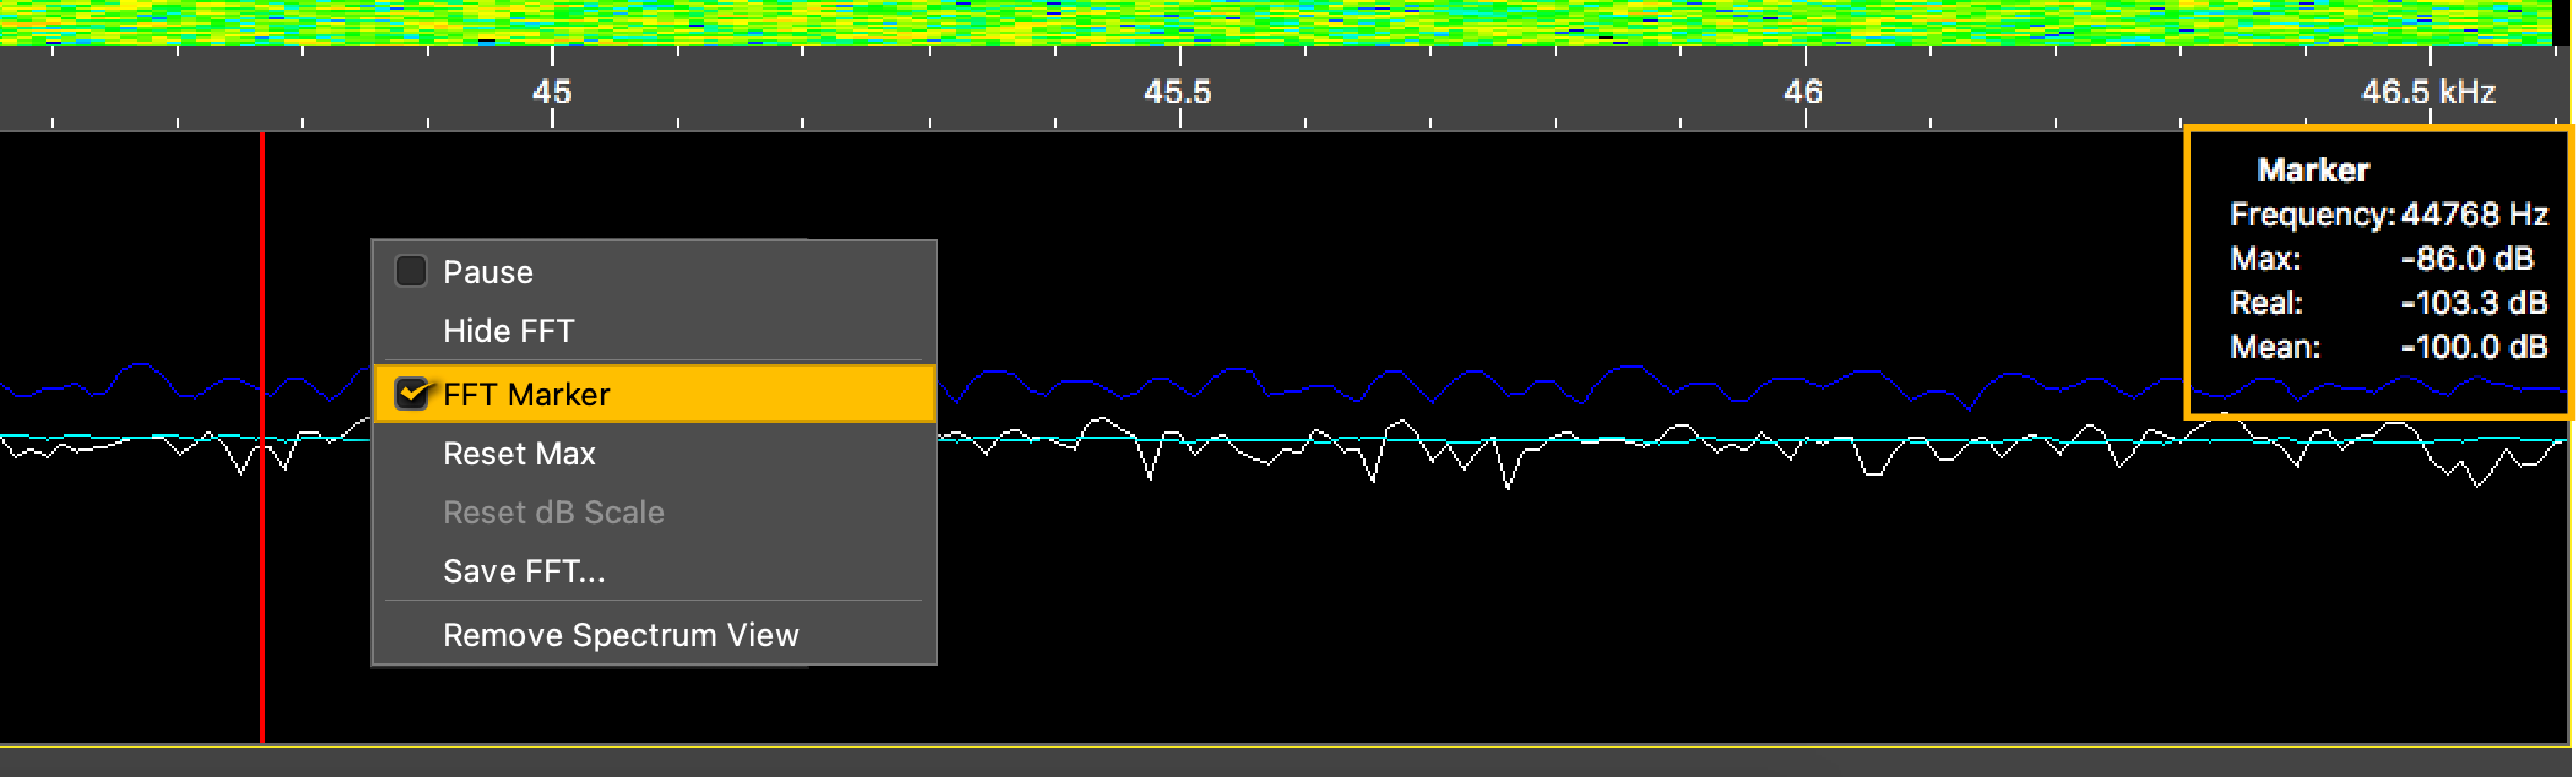
Under Peak, you can check:
- RealTime: the latest highest level of noise (dBV) recorded and its frequency.
- Max: the highest level of noise recorded since the beginning of the spectrum and its frequency.
- Check that there is more than 12 dBV between the maximum noise level (dark blue line) and the average noise level (cyan line) on the peak of sensor frequencies.
- If you changed the configuration of the hydrophone or sensors, right-click the graph and click Reset Max to reset the dark blue line showing the maximum level of noise.
-
To check the maximum, mean and real time measures of noise level at
specific frequencies:
-
Click and drag the marker at a specific point.
Frequency and levels of noise at the marker position are displayed on the right side of the graph.
-
Click and drag the marker at a specific point.
- Right-click the spectrum and click Pause if needed.
-
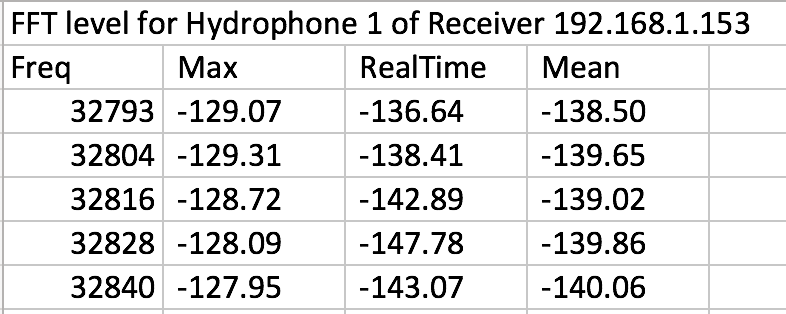
To save data recorded by the spectrum in a *.txt file, right-click the FFT plot
and click Save FFT.
The FFT file lists for the entire bandwidth used by the hydrophone (frequencies are in Hz) the maximum and mean levels of noise since the FFT export has started and the last real time level of noise before the export (dBV).
- Right-click the spectrum analyzer and click Hide FFT to hide the FFT plot.
- Right-click the IP address of the receiver in the status bar and click Stop Spectrum.