Customizing Pages
Learn how to change the display of page elements.
 |
|
 |
|
 |
|
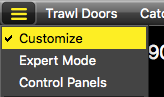
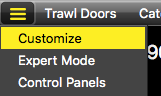
Customizing Display
Right-click items to display customization options.
- Change the size of dial numbers
- Change the size of a label
- Change a label
- Display a dial with 360° numbers
- Change the color of a label
- Change the color of a line in a history plot
- Change the unit of a measure
- Display the battery status and target strength value on the echogram (V3 sensors only)
Changing the Units
You can change the units of the data.
Adding Multiple Data to a Plot
Drag and drop a new plot on top of another plot.
Zooming on Plots and Echograms
Place your mouse cursor over the vertical axis and scroll to zoom in and out of the depth scale. Place the cursor over the horizontal axis to zoom in and out of the time scale.
Changing Colors on an Echogram
Right-click the echogram to display color palettes. Right-click color palettes to change hues of colors. Then, drag the handles on the color palettes to increase color or eliminate noises and weak echoes.
Deleting Data
Right-click data and click Remove.
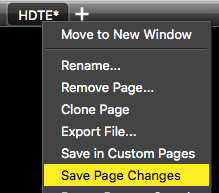
Removing or Deleting a Page
You can remove a page from the tabs and choose to delete it or to save it as a template to find it back later.