Configuring Data Display
You can display on pages in Scala2 measurements taken by the sensors (e.g. catch status, depth, pitch and roll...).
About this task
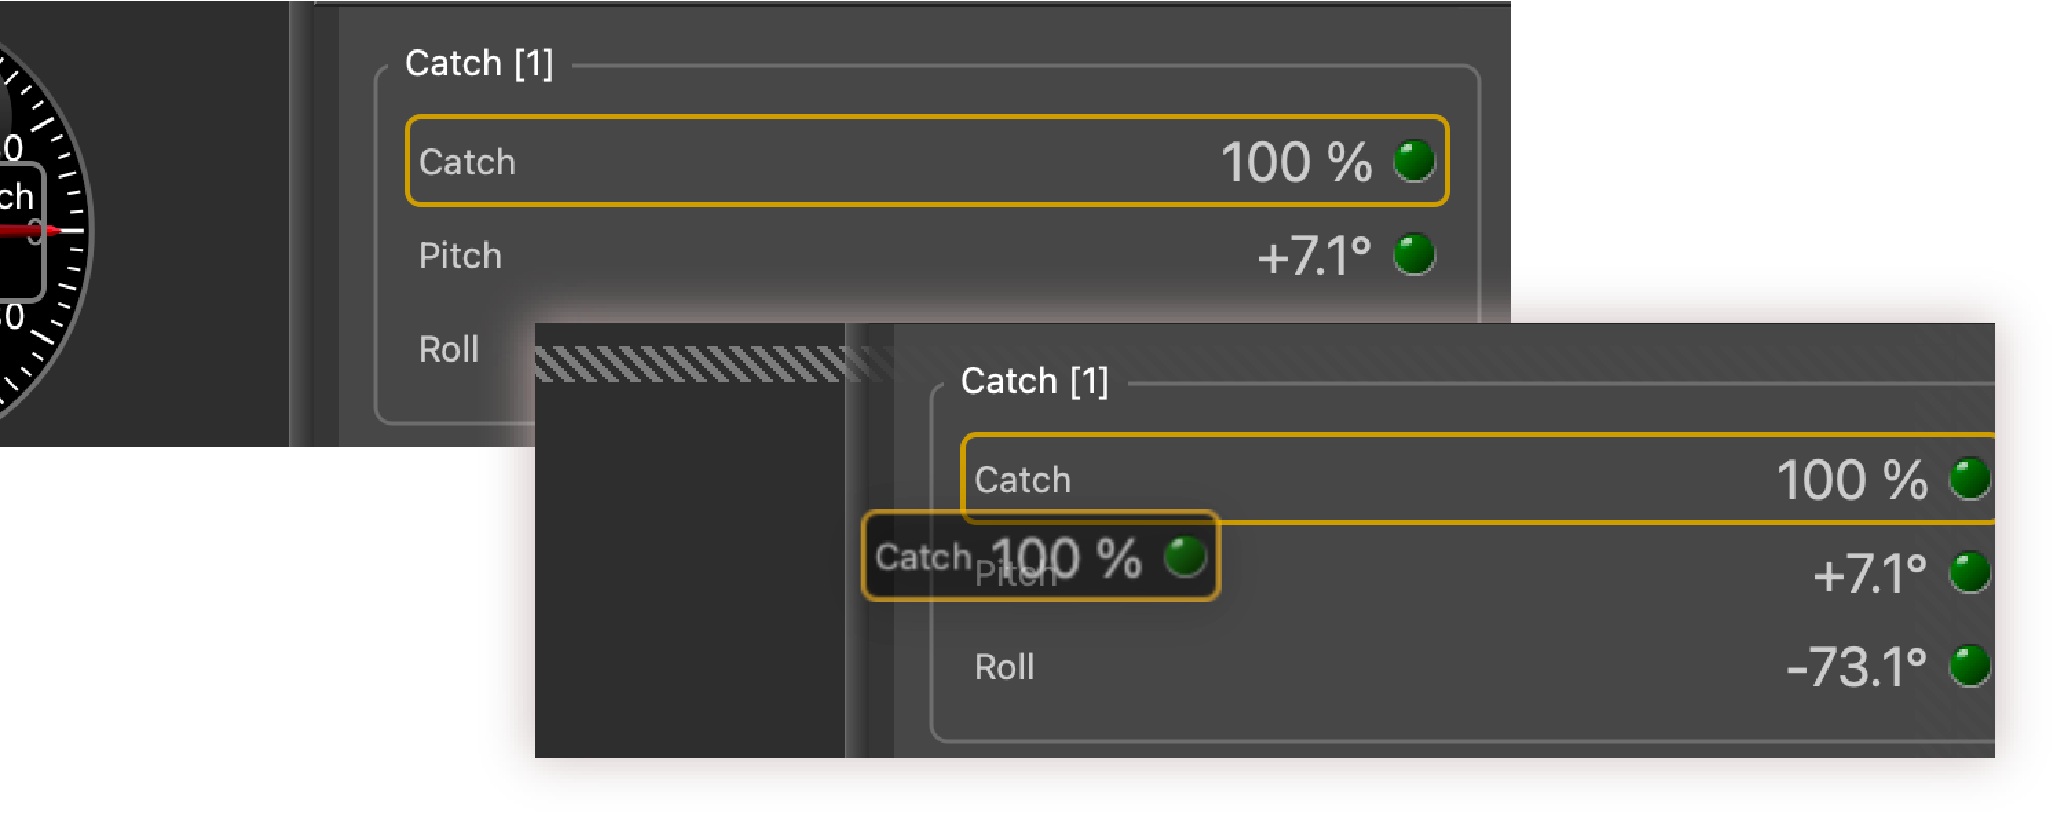
Sensor measurements are displayed in the control panels, in Mx tab. Data title should be:
- TE/CATCH for a Catch Explorer
- CATCH for Catch sensors
- PI-CATCH for Catch hybrid PI sensors.
The title is followed by the node where the sensor was placed when added to the system. Data displayed (e.g. pitch & roll, temperature) depends on the firmware installed.
Procedure
- From the top left corner of the screen, click .
-
To display echogram images of a Catch Explorer:
from TE/CATCH in Mx, click + hold Sonar Data and drag
it to the page display.
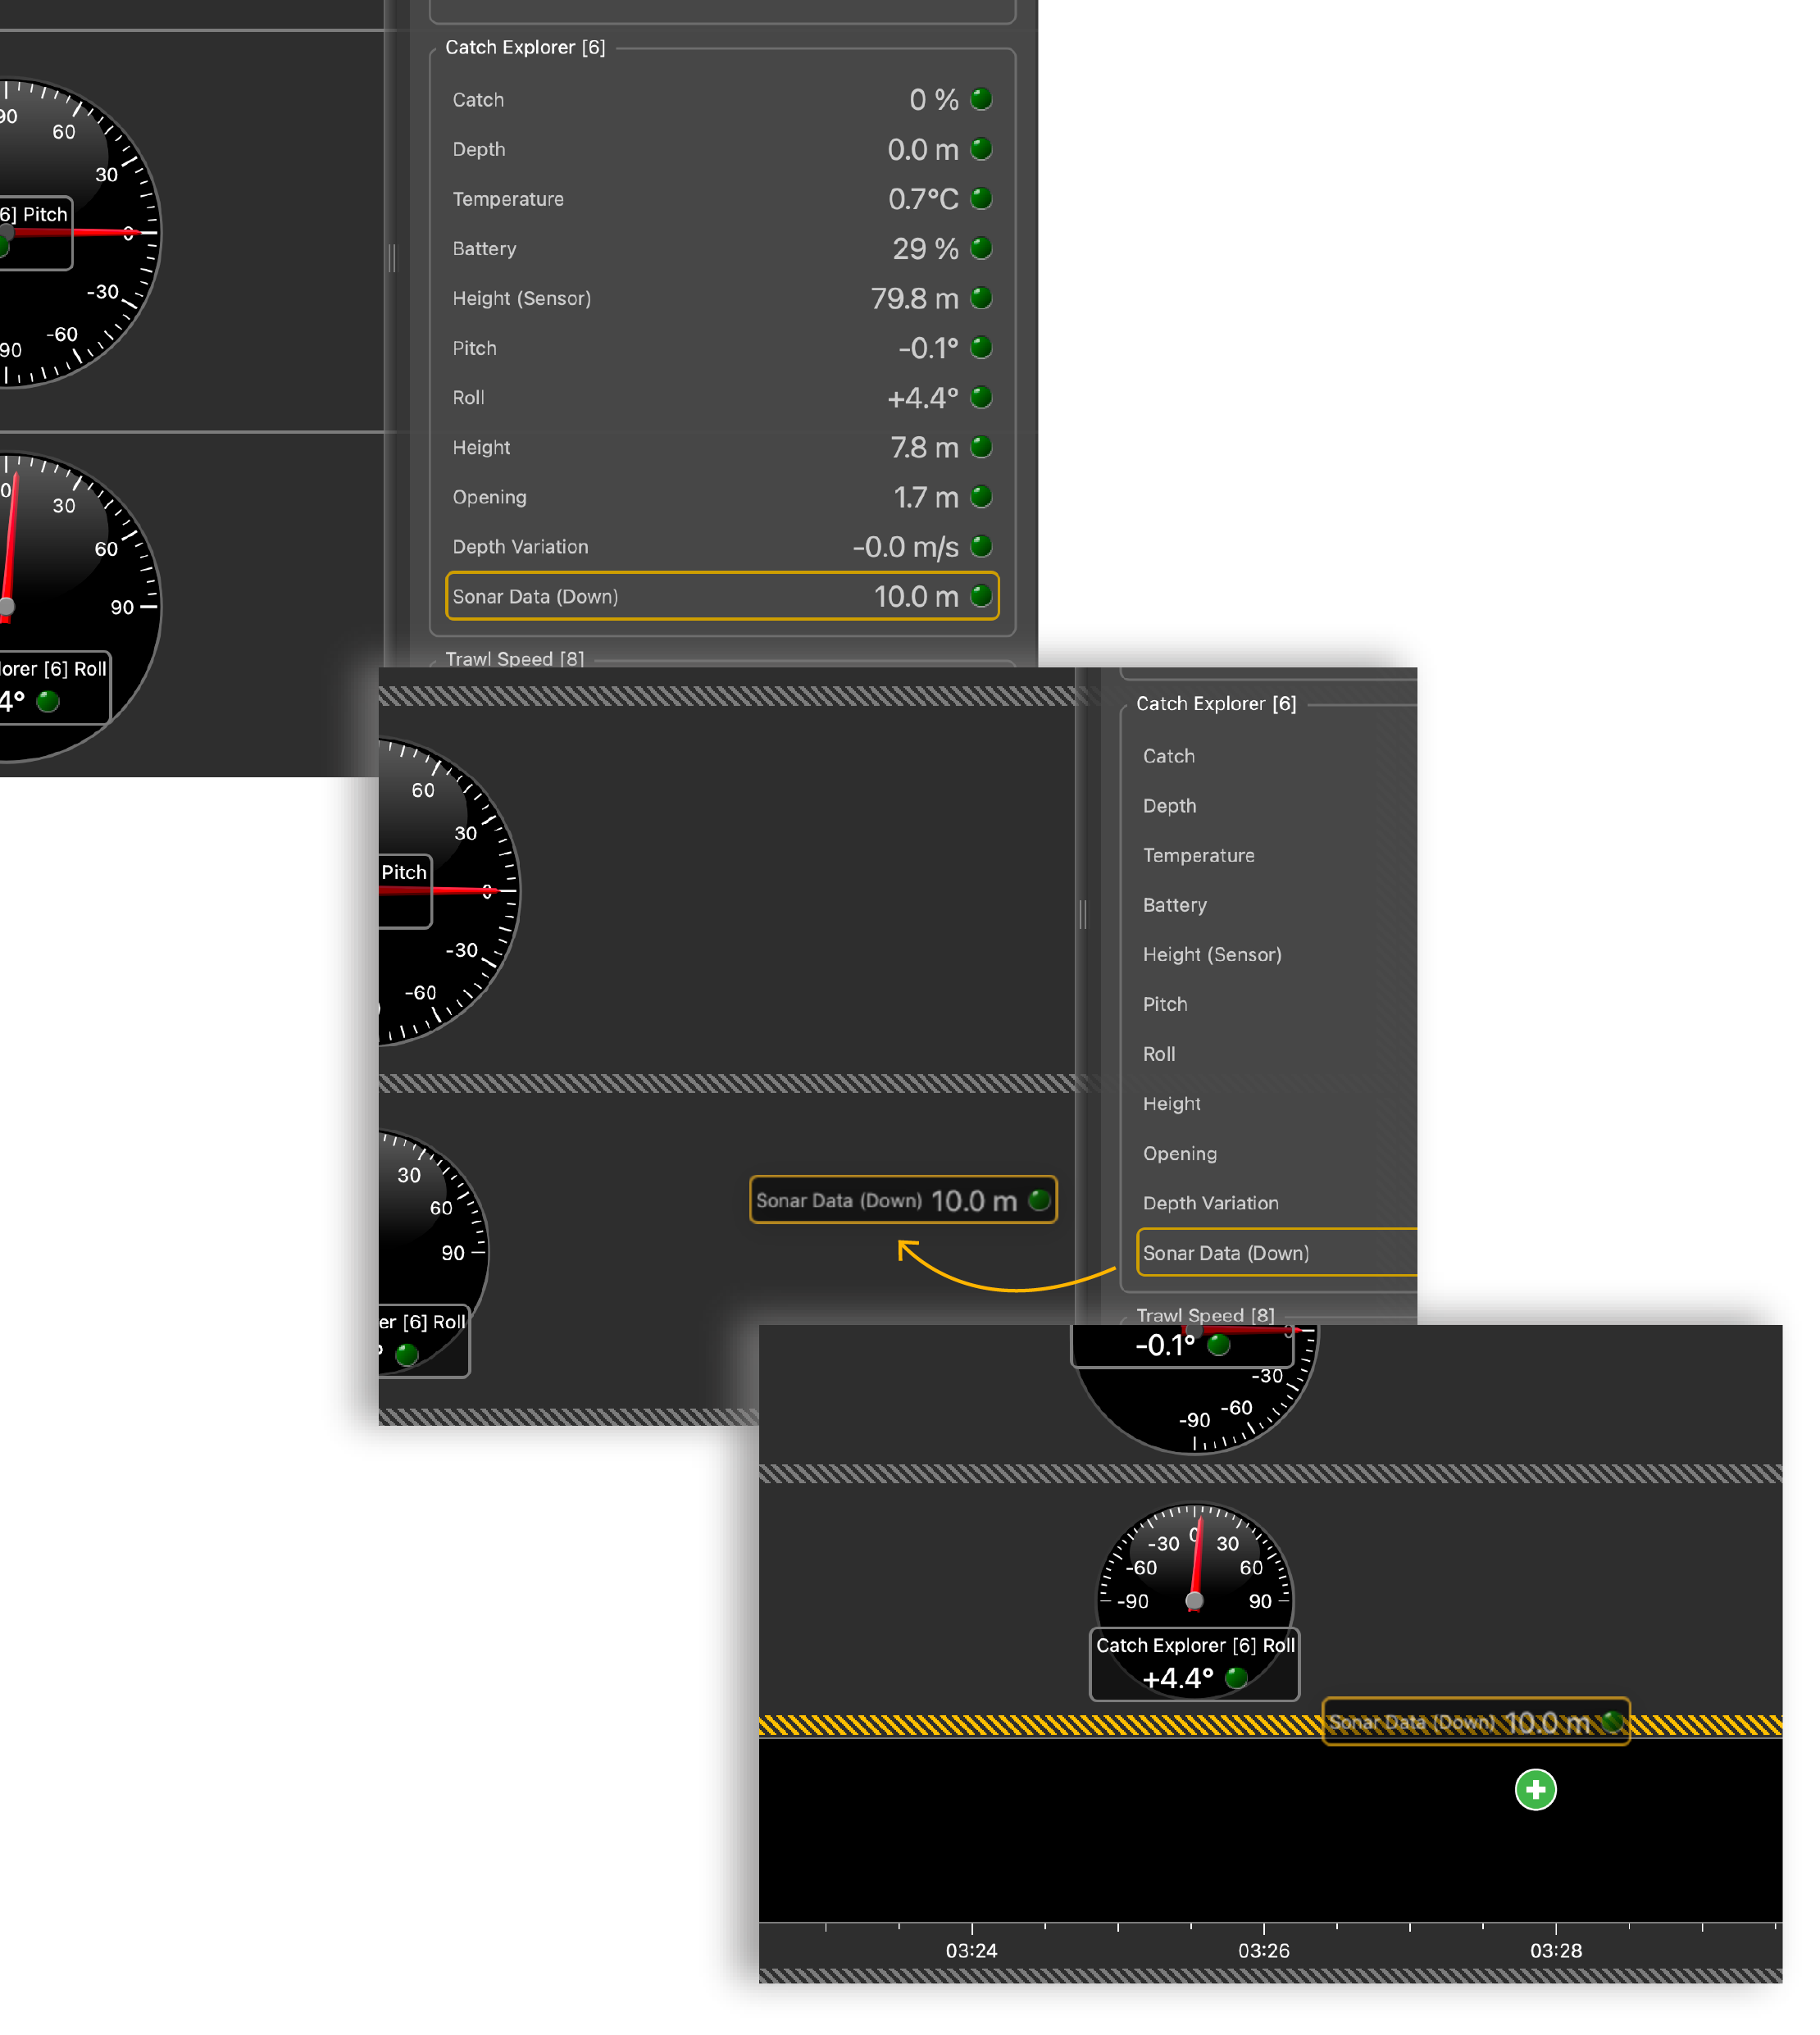 Below is an example of an echogram image.
  When
the codend is not totally full, you can see the bottom of the sea (1).
When the codend is filling up, you can see at the top that the echogram gets
denser (2) and the sea bottom disappears. It is because fish can block
the signal.
Note: When the trawl is empty, the codend moves a lot, as well as the sensors attached to it. You may not have correct echogram images at the beginning of a tow because the sensors are not correctly oriented toward the vessel. The codend and sensor become stable when the trawl begins to fill. The codend can move again when the codend is full.Note: We recommend you to deactivate Draw Bottom Line option. Right-click the echogram to check if it is activated.
When
the codend is not totally full, you can see the bottom of the sea (1).
When the codend is filling up, you can see at the top that the echogram gets
denser (2) and the sea bottom disappears. It is because fish can block
the signal.
Note: When the trawl is empty, the codend moves a lot, as well as the sensors attached to it. You may not have correct echogram images at the beginning of a tow because the sensors are not correctly oriented toward the vessel. The codend and sensor become stable when the trawl begins to fill. The codend can move again when the codend is full.Note: We recommend you to deactivate Draw Bottom Line option. Right-click the echogram to check if it is activated. -
To know if the trawl is empty or full:
-
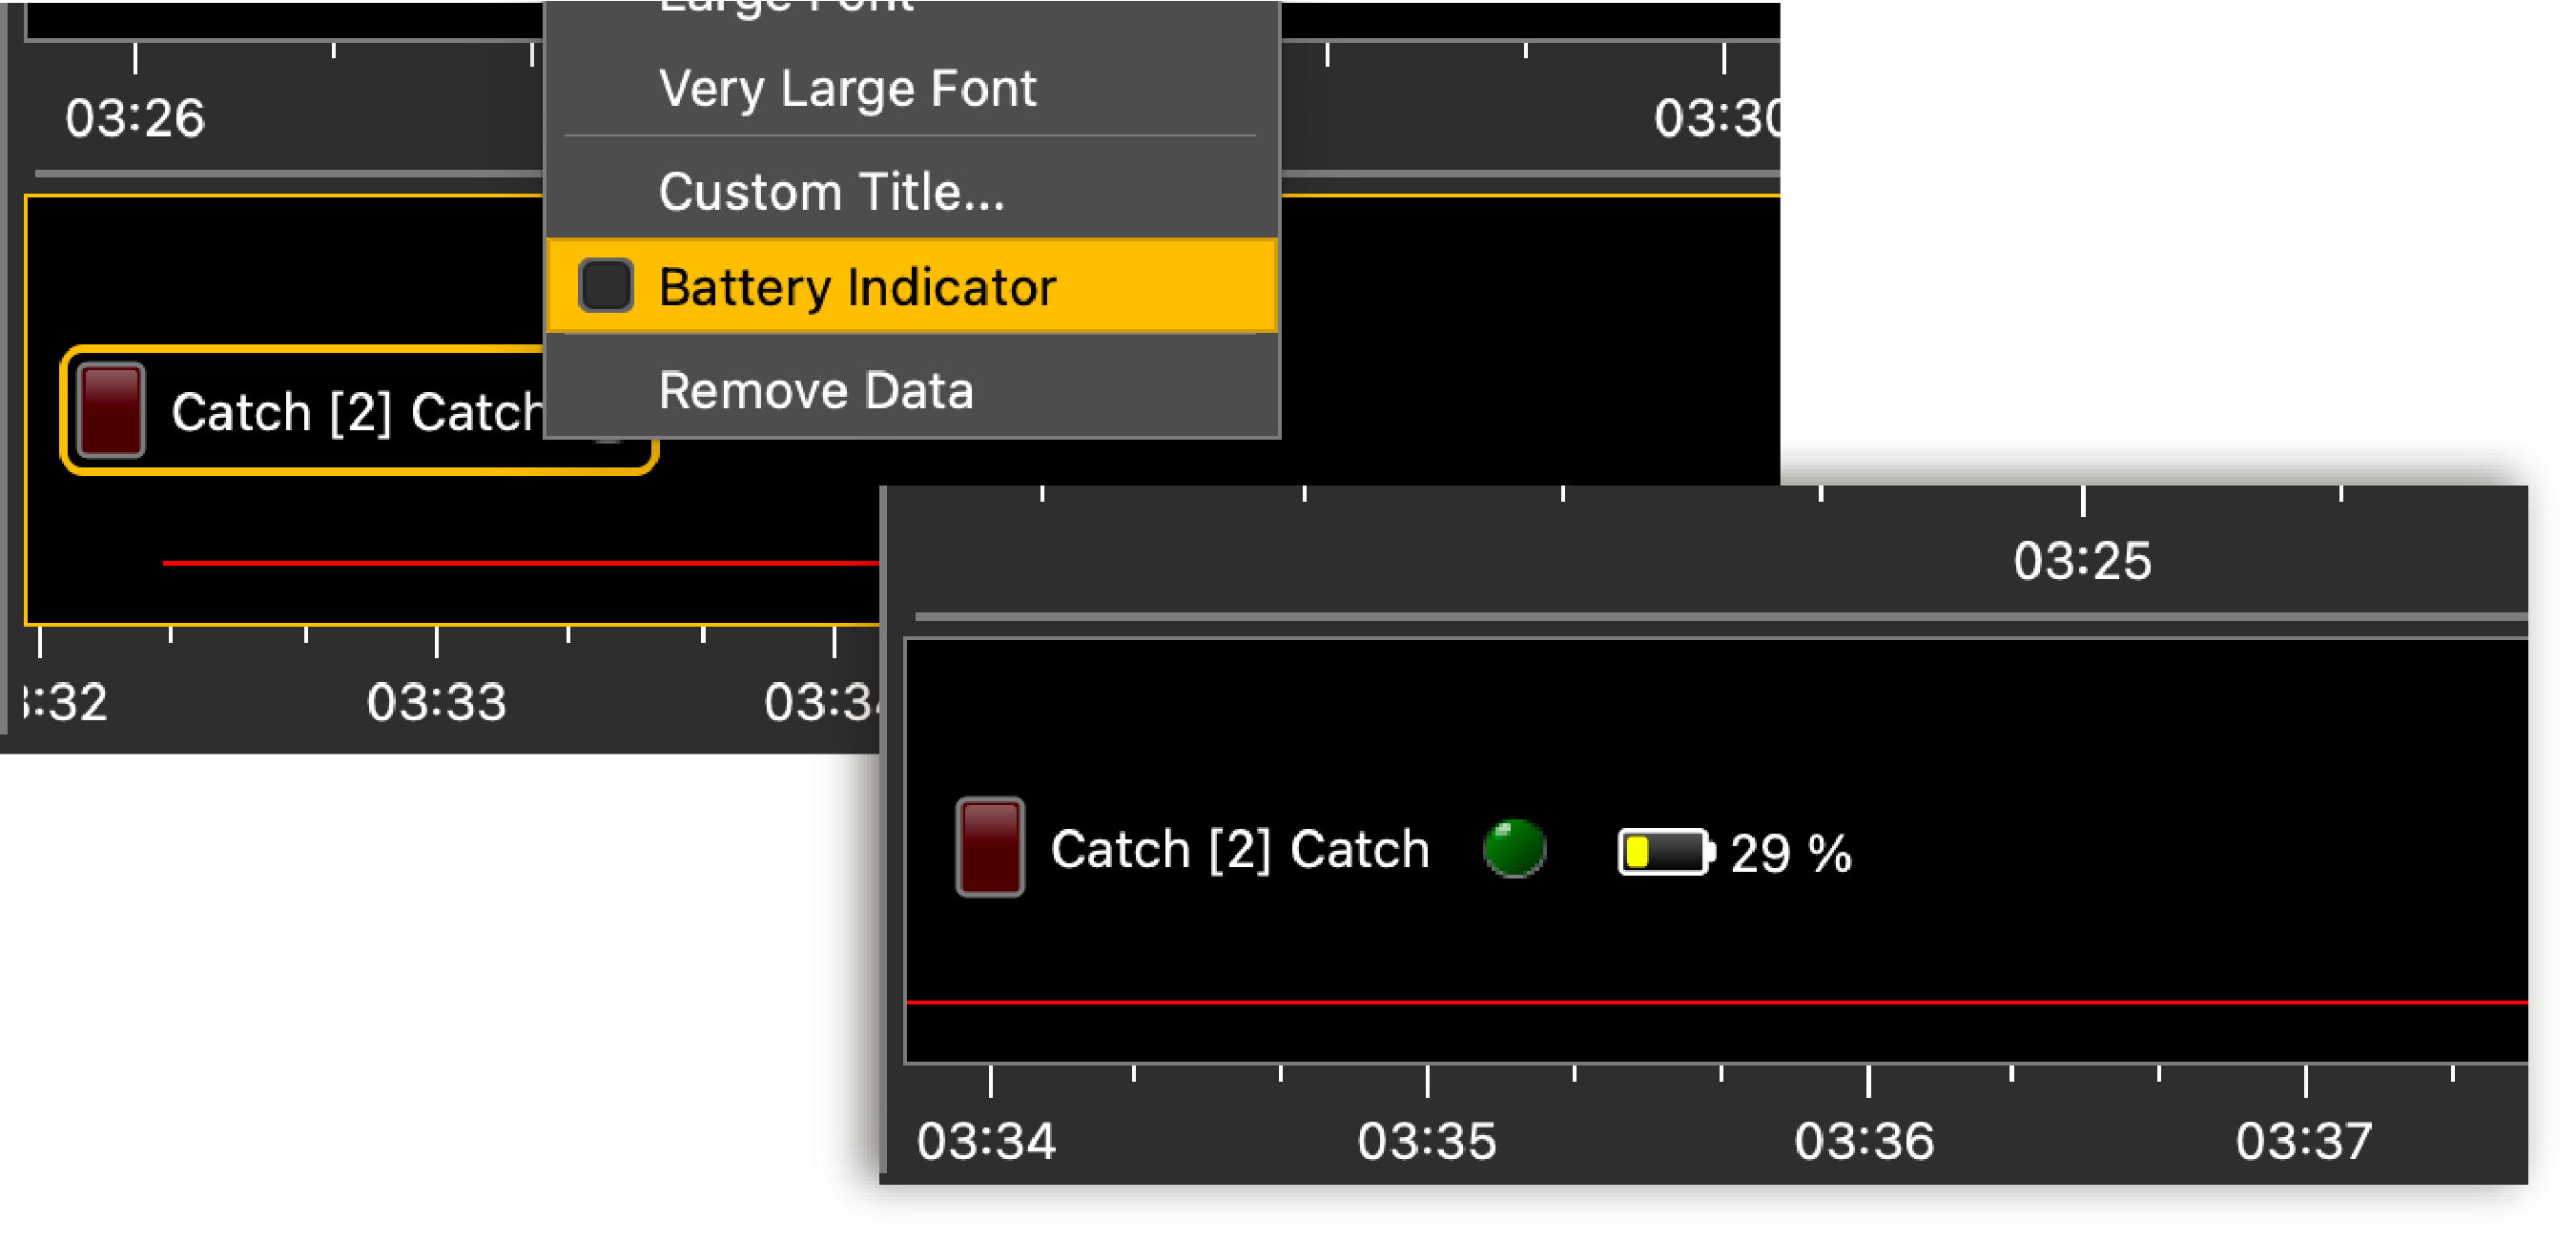
If you have a firmware version 08.03 and above, you can display the battery
level on the plot. Right-click the title of the plot and click Battery
Indicator.
-
To be alerted when the trawl is full:
- From the top left corner of the screen, click .
- From the Settings dialog box, go to the Alarms tab.
- Click Add.
-
In Alarm Data and Alarm
Conditions, enter the
following settings:
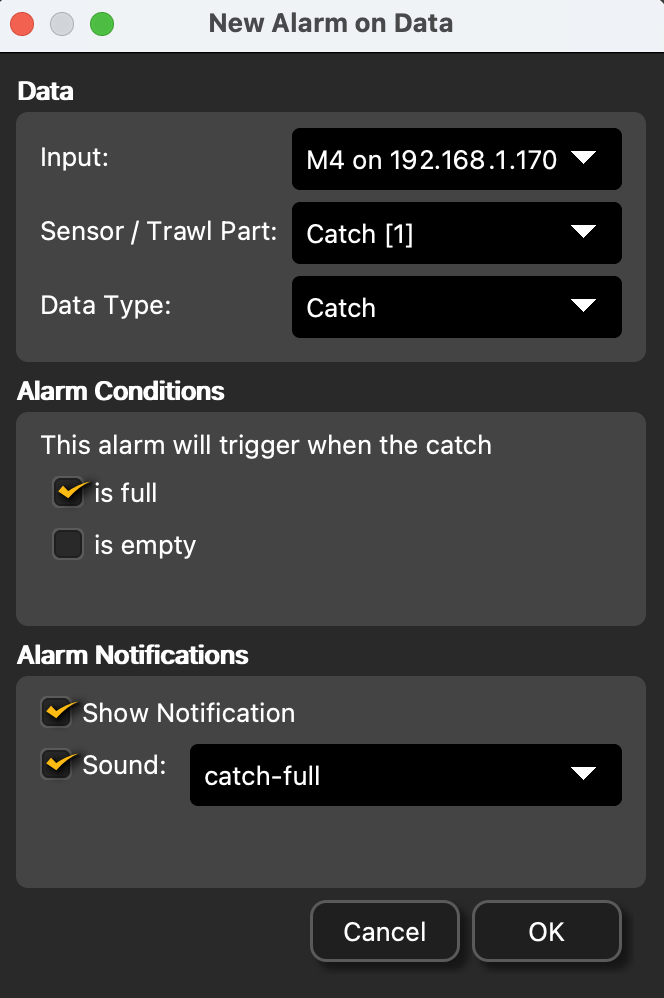
Note: If you have several Catch sensors, you can select other sensors from Sensor / Trawl Part.-
In Alarm
Notifications, choose if you
want to display a visual and sound notification:

-
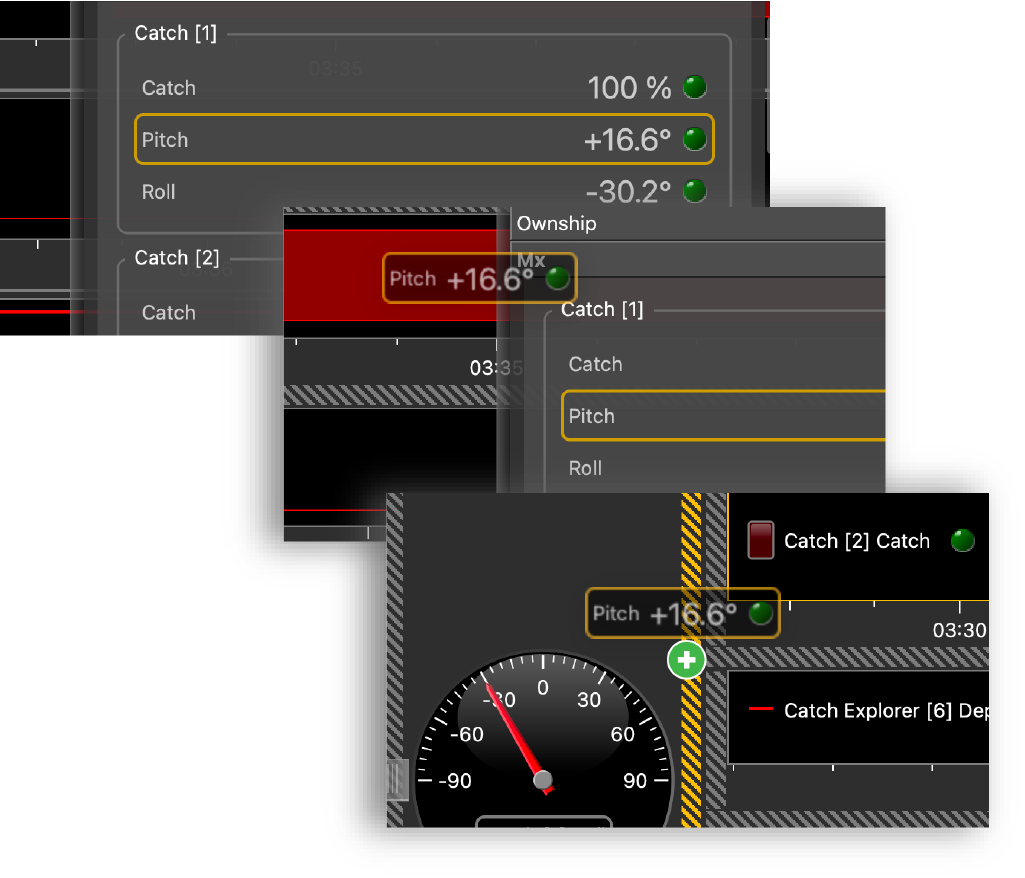
To display pitch and roll data, click + hold data and drag it to the page
display.
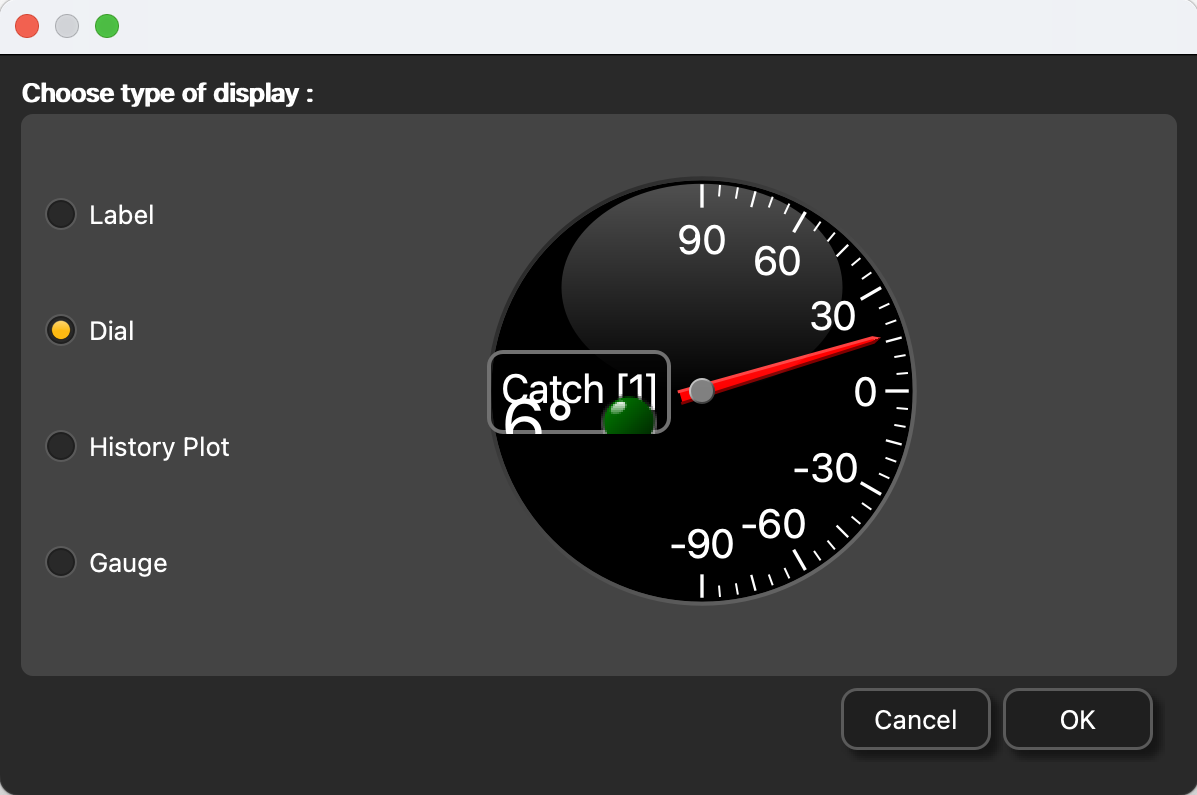
 From Choose new Gauge
Type dialog box, select the type of
display.
-
To save the changes you made:
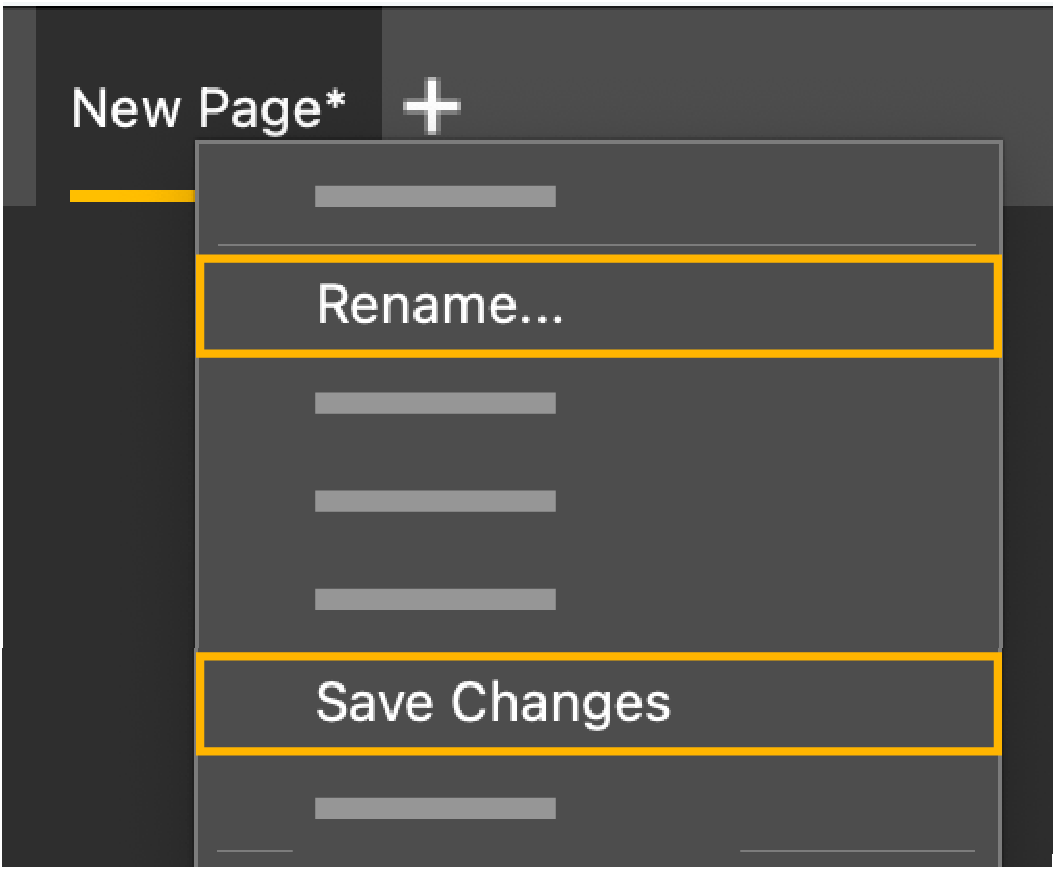
- To rename the page, right-click the name of the page and click Rename.
-
To save the page, right-click the name of the page and click Save Changes.
- Deactivate the Customize mode when you have finished customizing pages: click again.
