Configuring Sensor Data Display on Scala2
You can display HDTE incoming data (e.g. echogram, depth, temperature,...) on pages in Scala2. You can also display target strength data, that help you differentiate sizes and species of fish.
Before you begin
About this task
Procedure
-
From the top left corner of the screen, click menu
 >
Customize and enter the password
eureka.
>
Customize and enter the password
eureka.
-
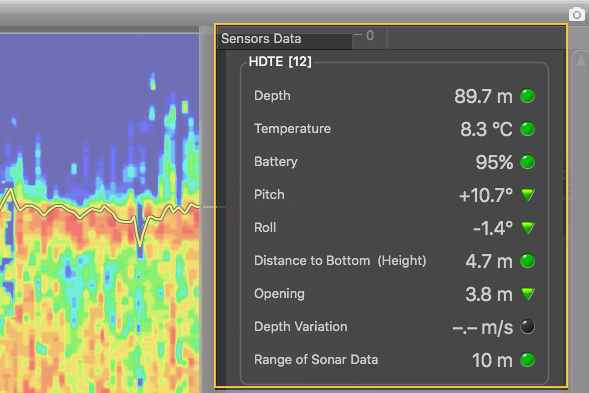
From Sensors Data, click + hold HDTE data (for example Depth) for 3 seconds until a rectangle appears and drag it
to a page in the middle of the screen. For more details about display in Scala2, please refer to Scala2 user guide.
Figure 1. Example of HDTE display in Scala2 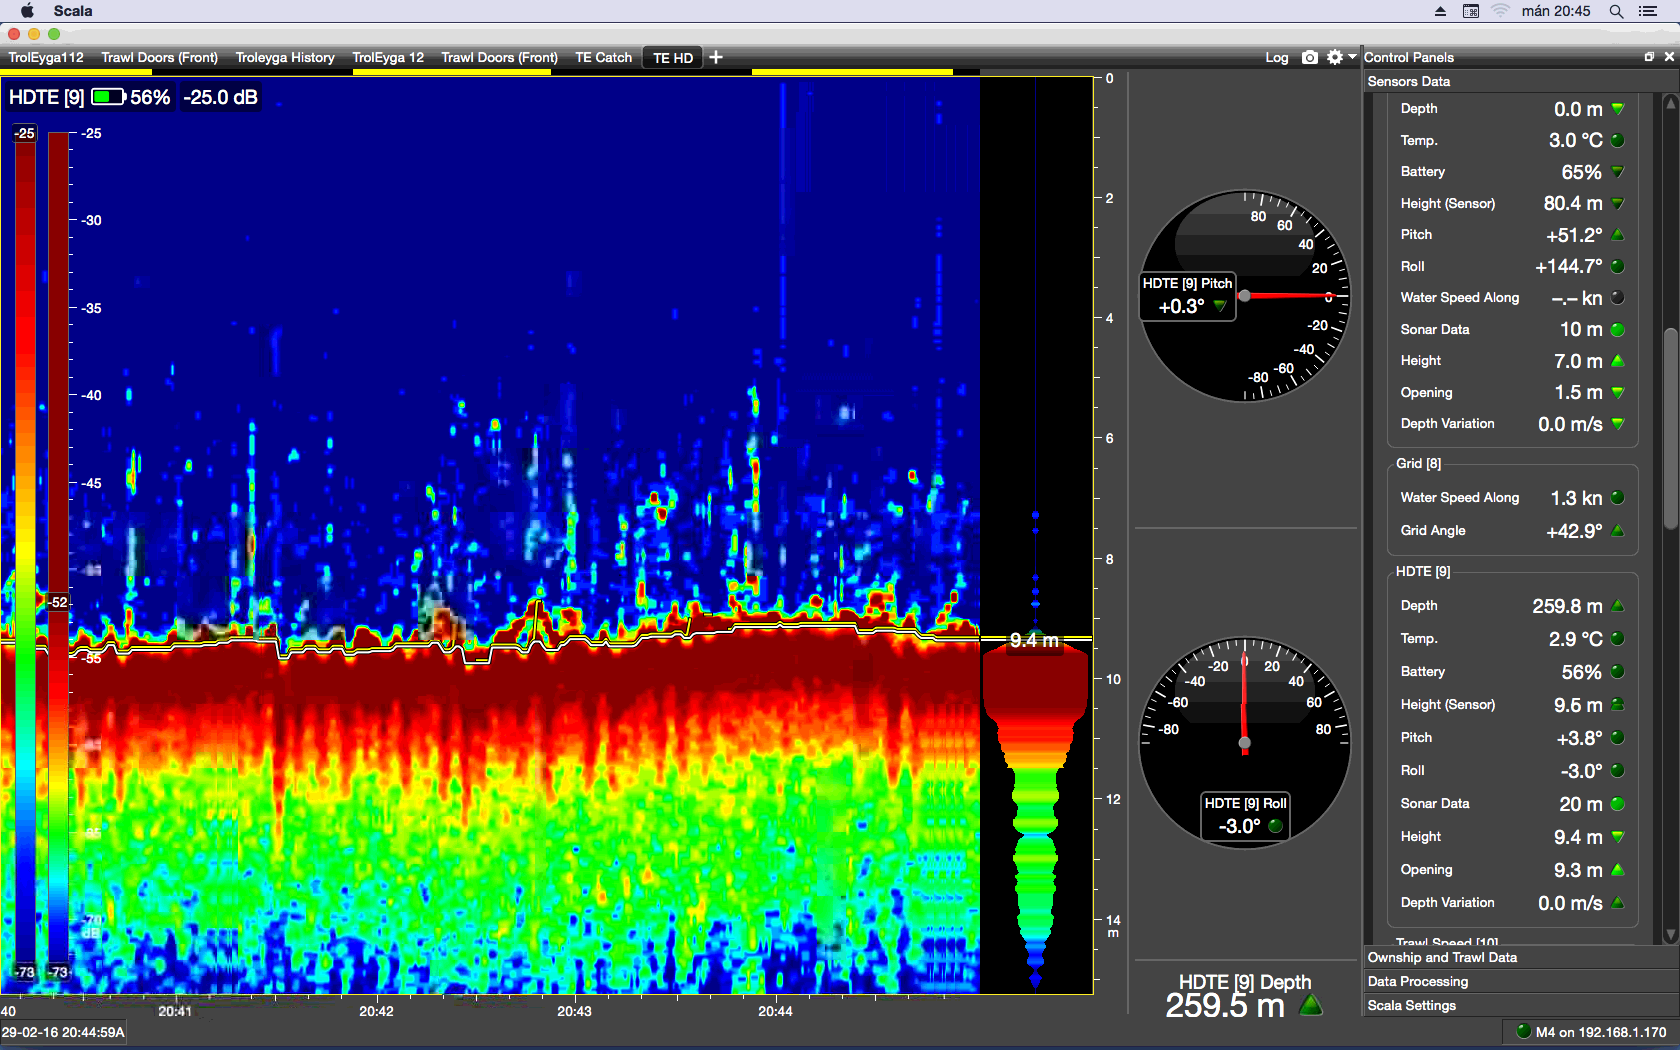
-
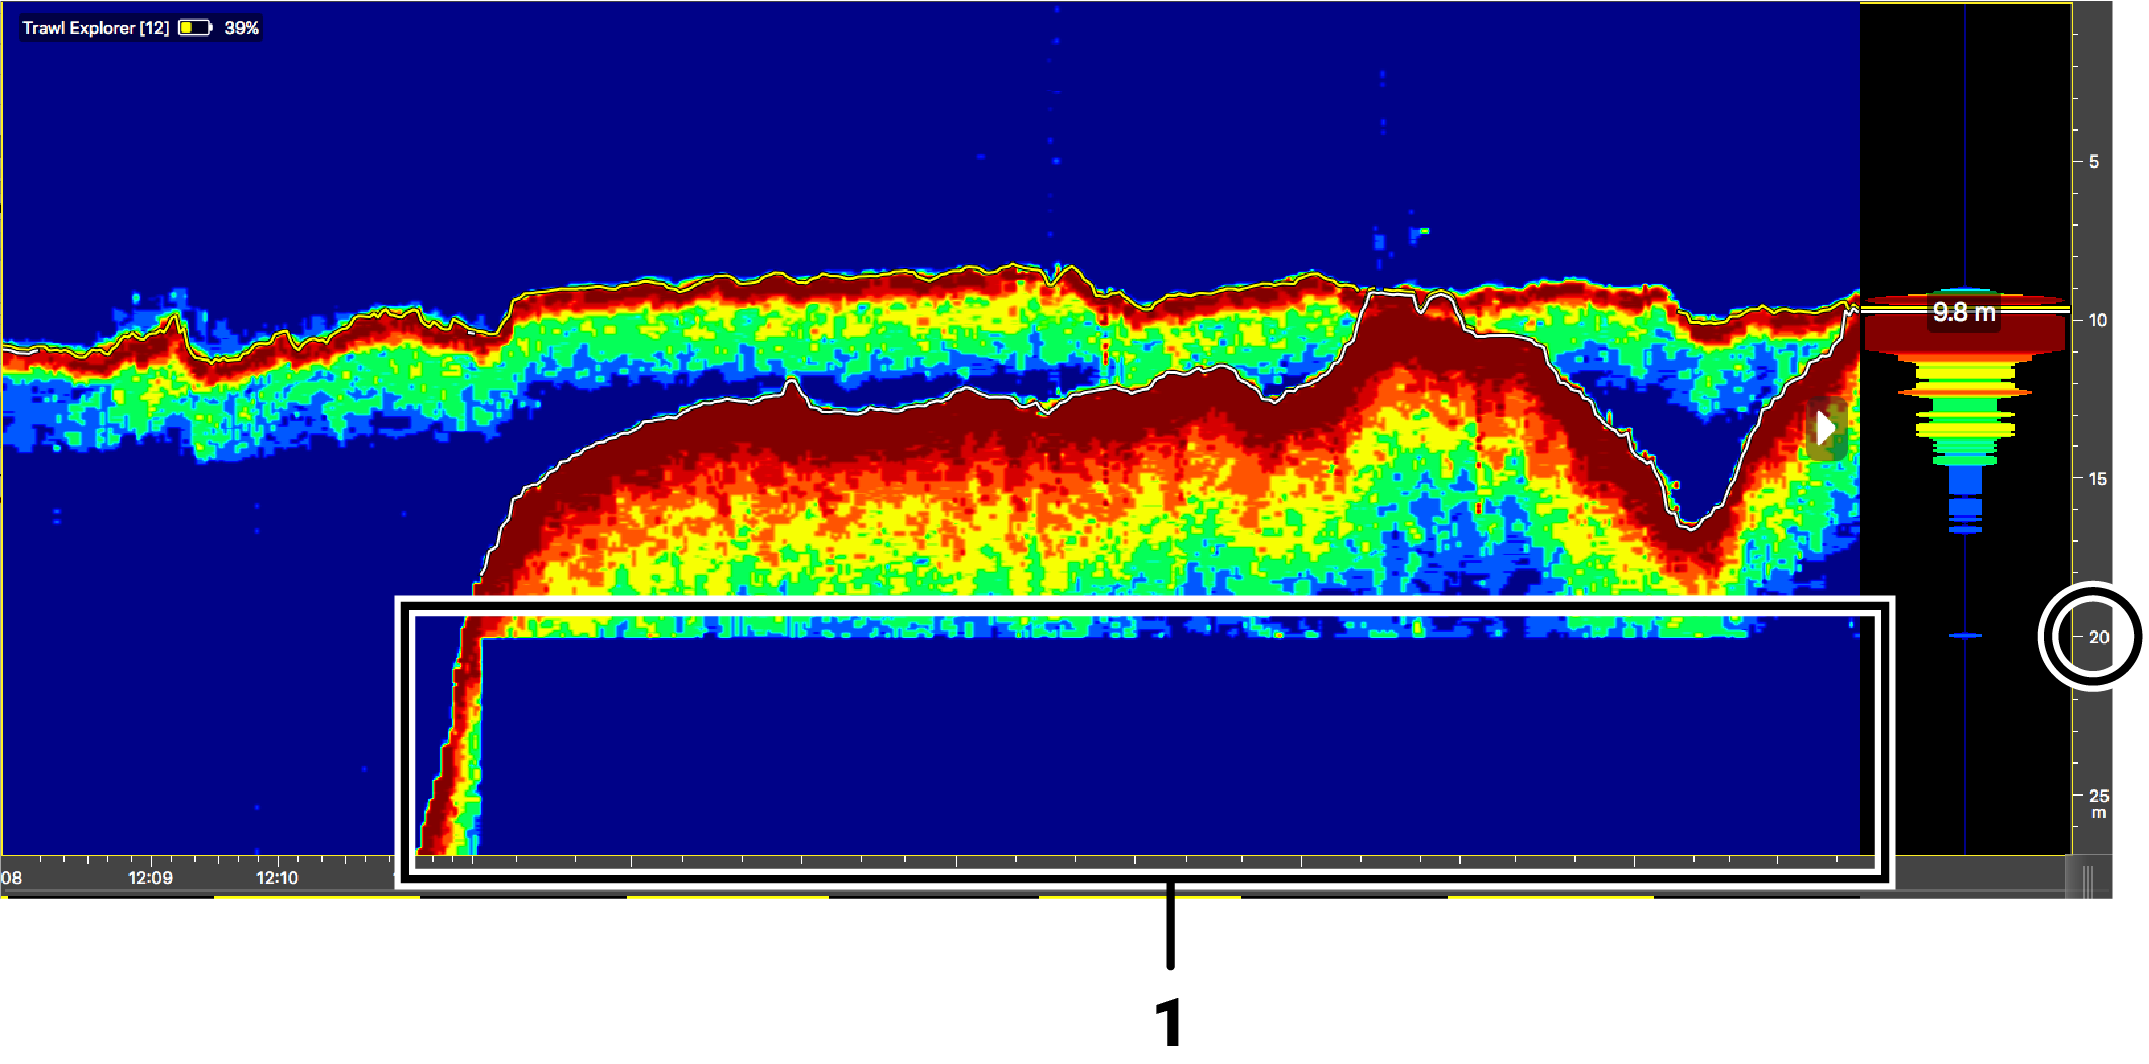
If you enabled autorange (1) in the sounding settings (See Configuring Autorange), echogram images will
be displayed like the example below:
-
To display the target strength:
- From the top left corner of the echogram, right-click the HDTE name and select Display Target Strength.
- Hover the mouse over the echogram.
The target strength of the element where you place your mouse is displayed next to the HDTE name. The higher is the target strength, the bigger is the fish.
- Deactivate the Customize mode when you have finished customizing pages: click again.