Configuring Data Display in Scala2
You can display the sensor's measurements and echograms on Scala2 pages.
Before you begin
Procedure
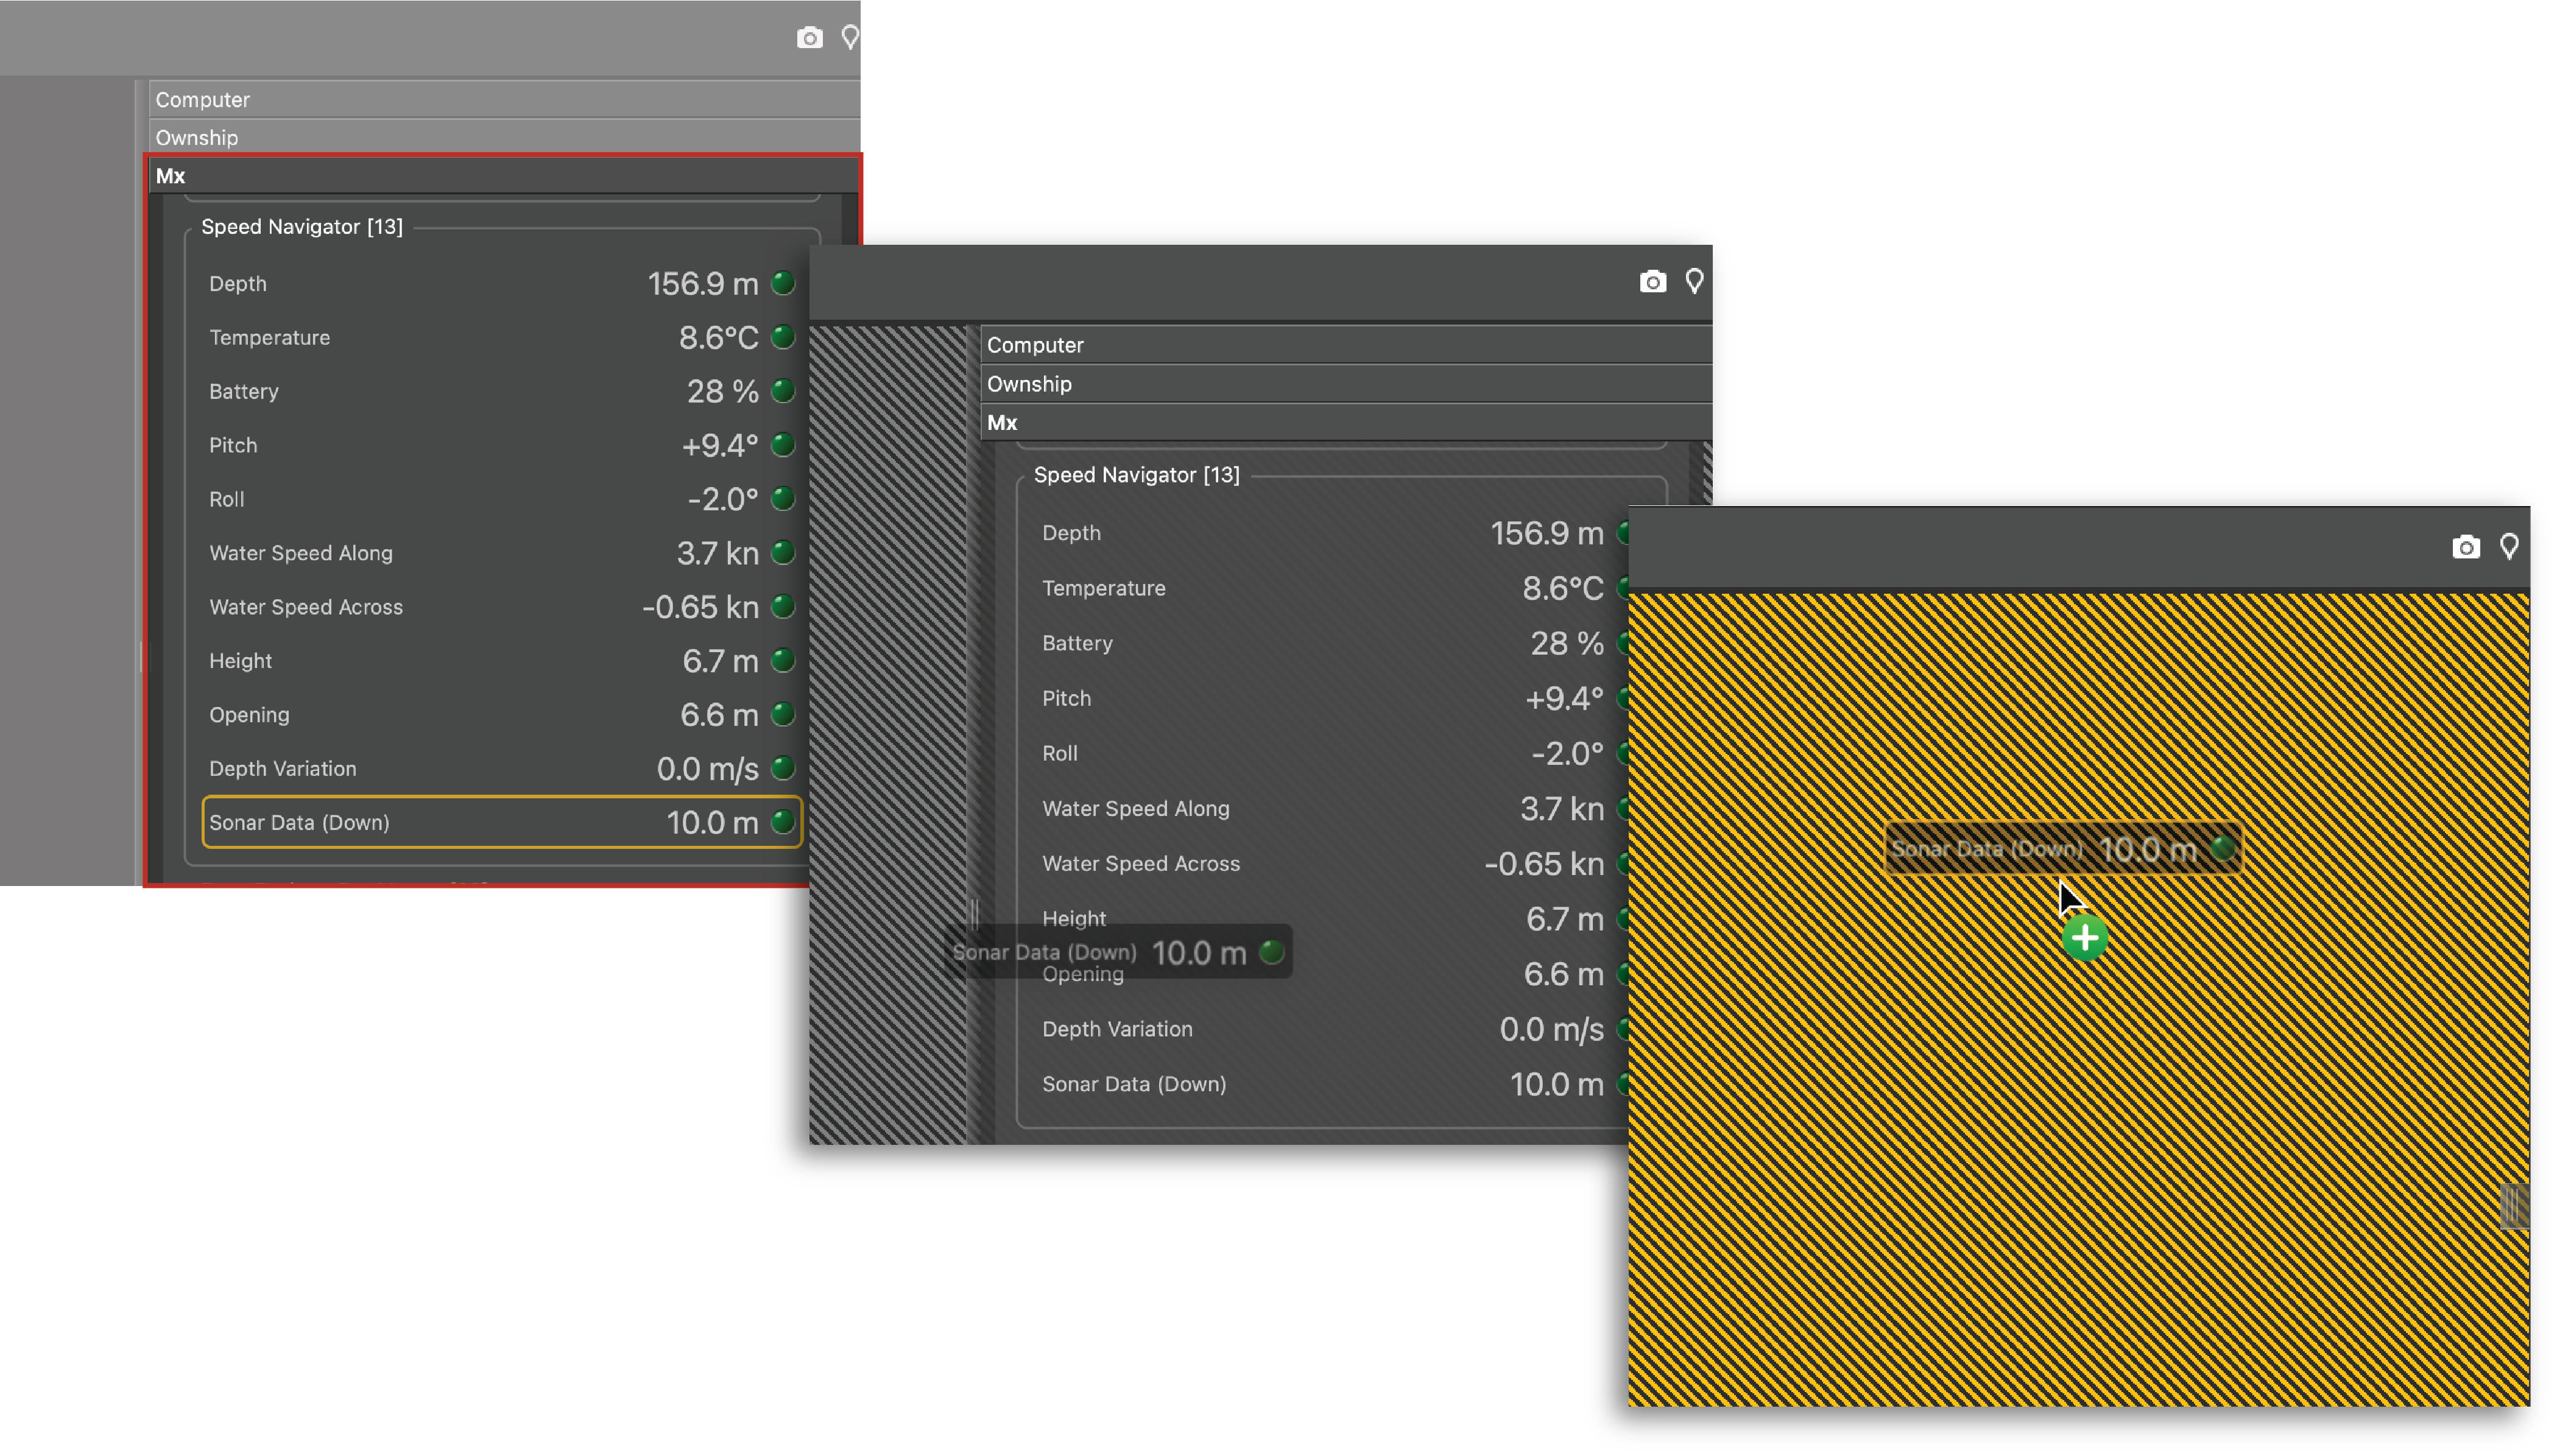
- Open the control panels and go to the Mx tab.
-
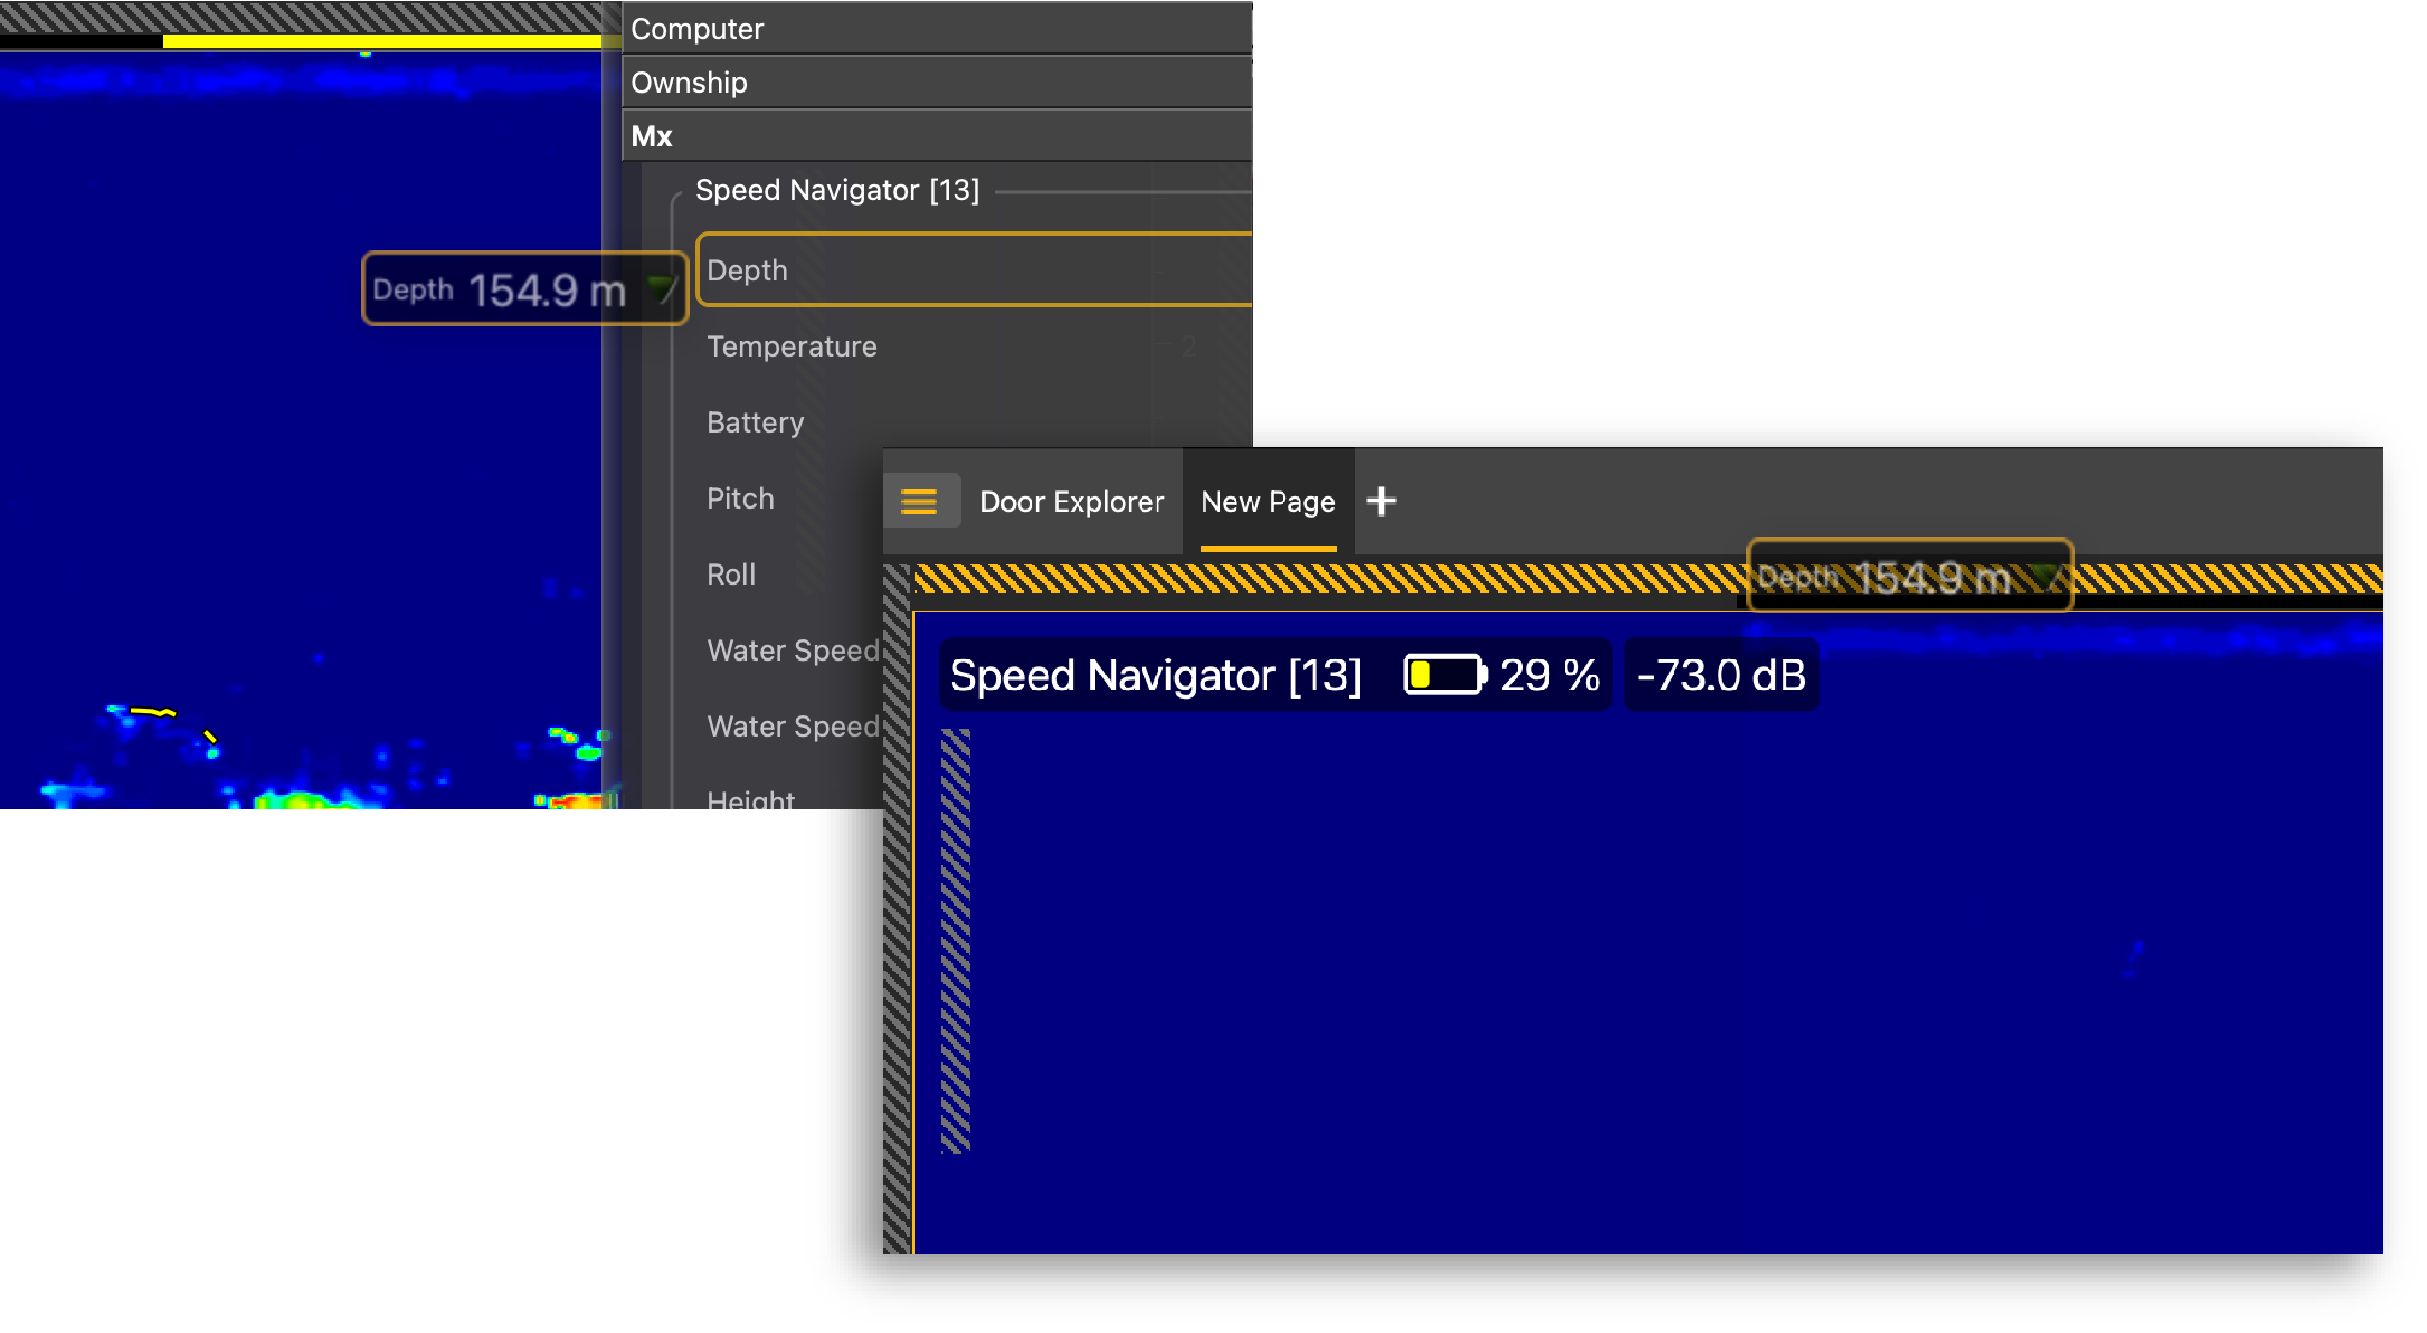
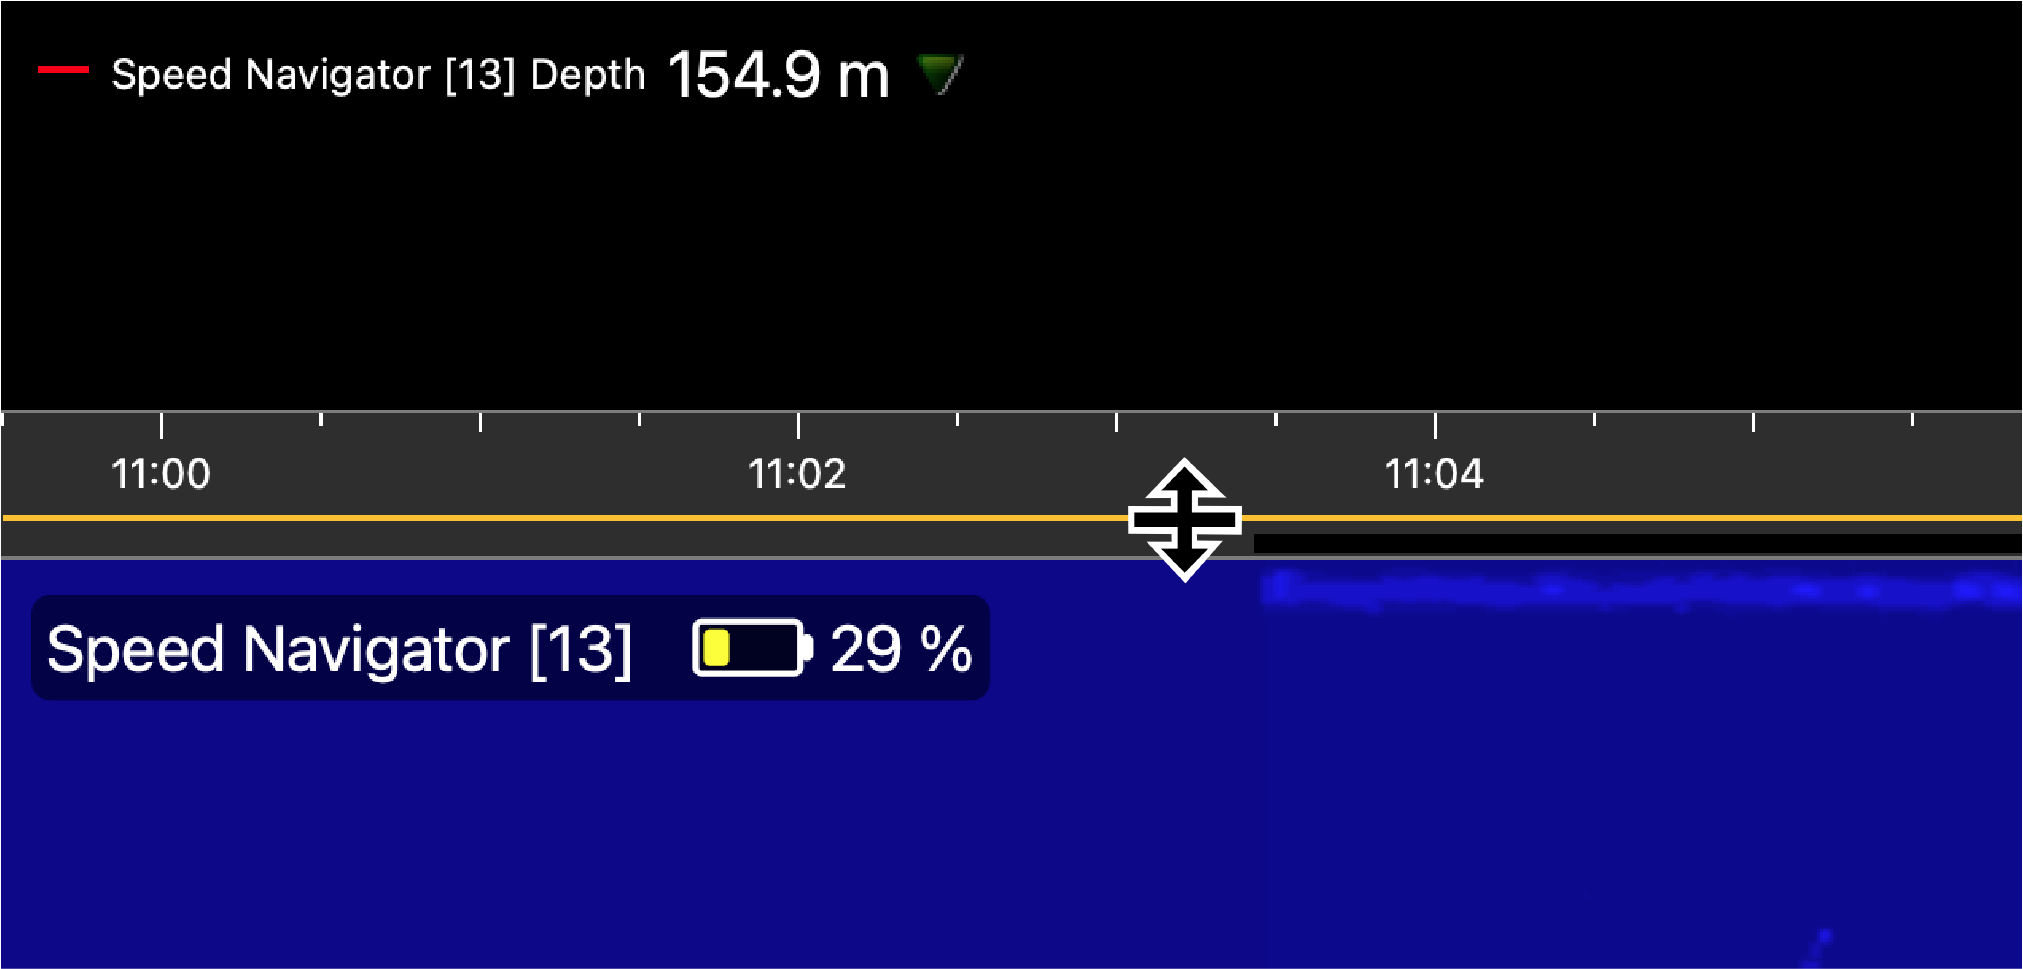
To display the echograms, click + hold Sonar Data from a Speed Navigator sensor and drag it to the page
display.
-
Click + hold other data, such as depth, pitch, roll, and
drag it as well to the page display.
-
Select the type of display.
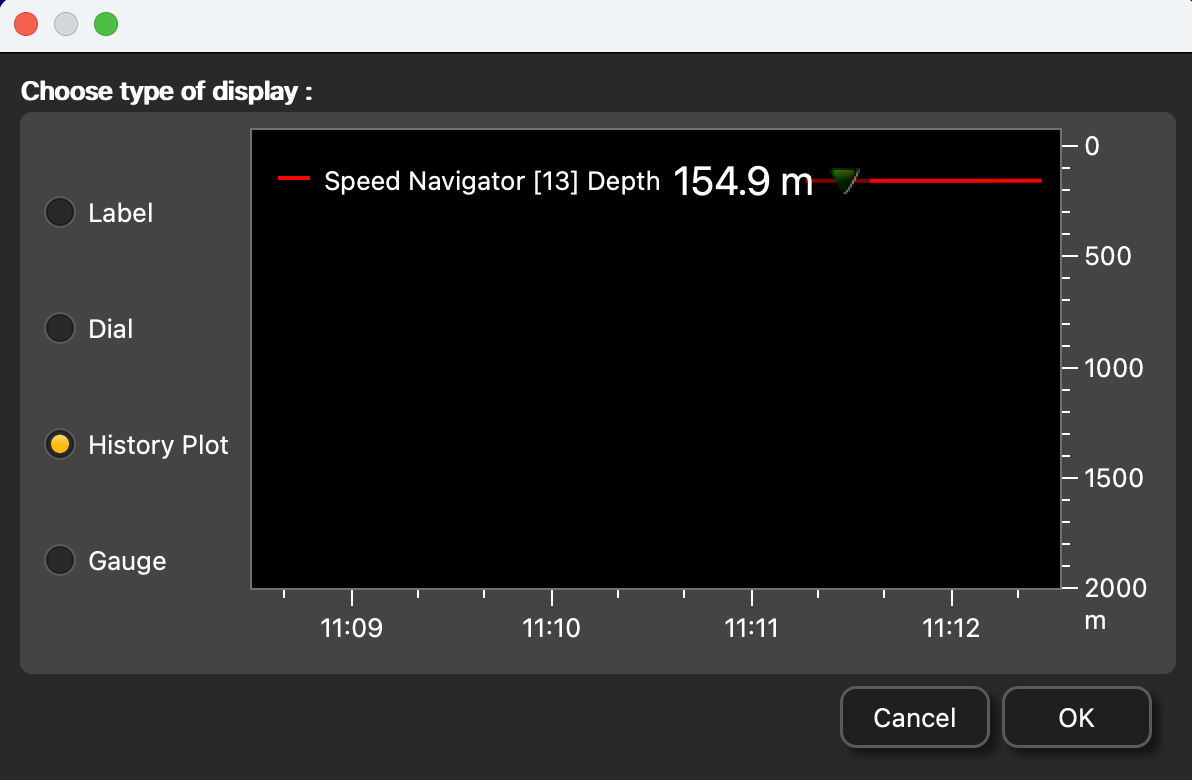
-
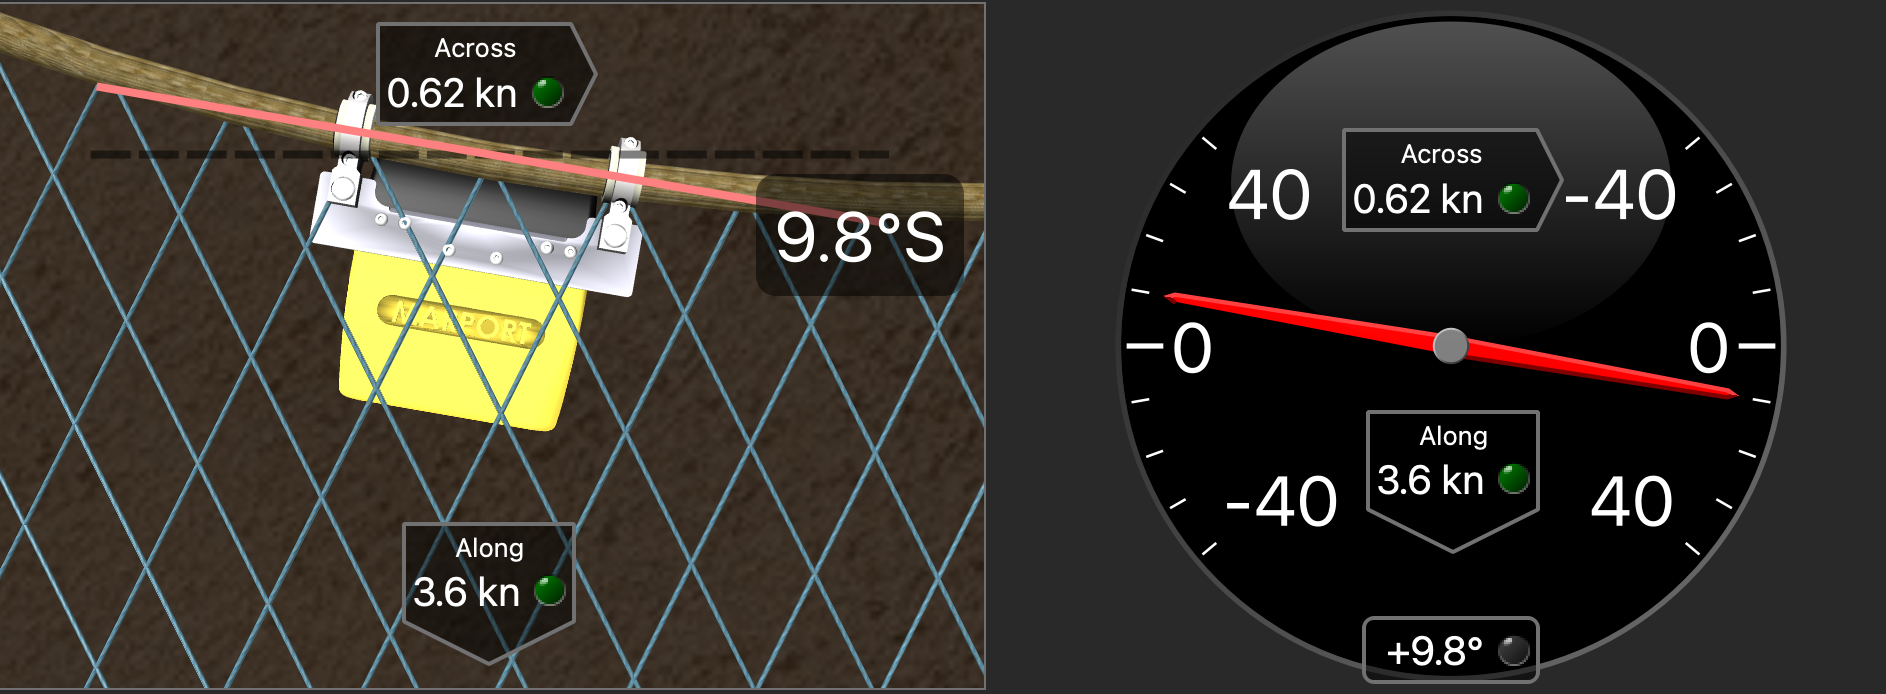
To display the Water Speed Along and Water Speed
Across data in 3D
views:
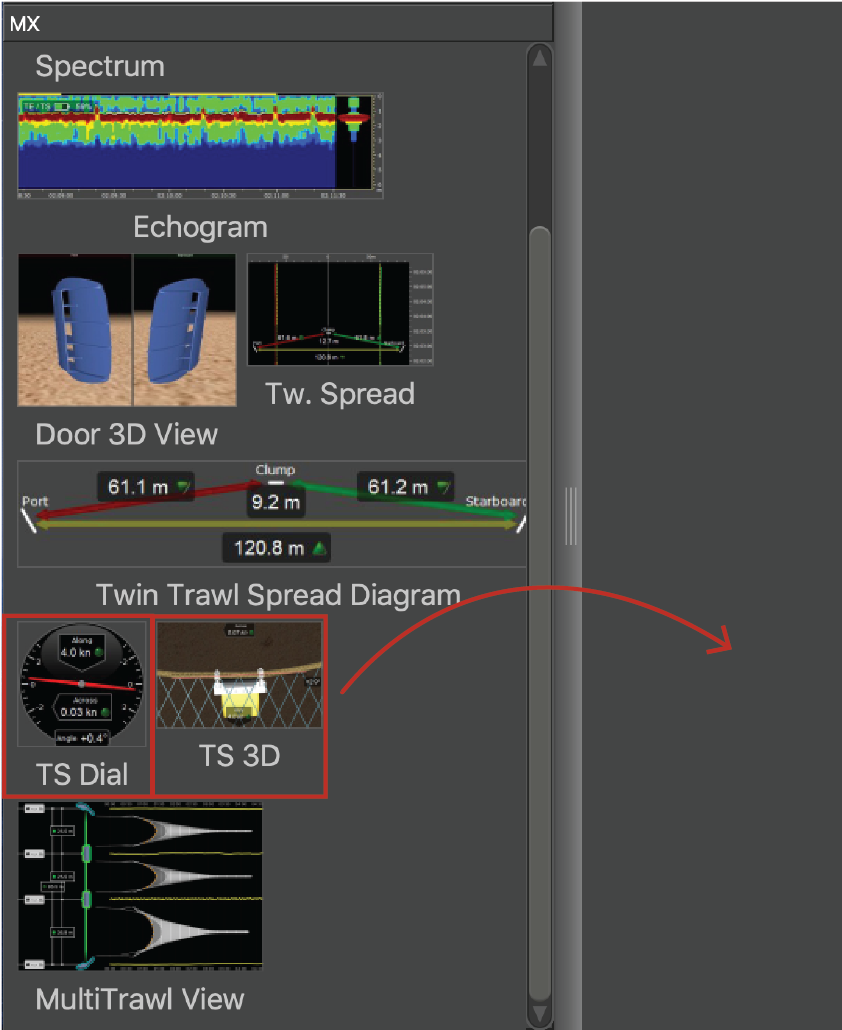
- Open the customization panels and go to the MX tab.
-
Click + hold TS Dial
or TS 3D and drag it
to the page.
-
Drag the lines around the blocks of data to resize
them.
-
Right-click the title or the values of the data to
display customization options.
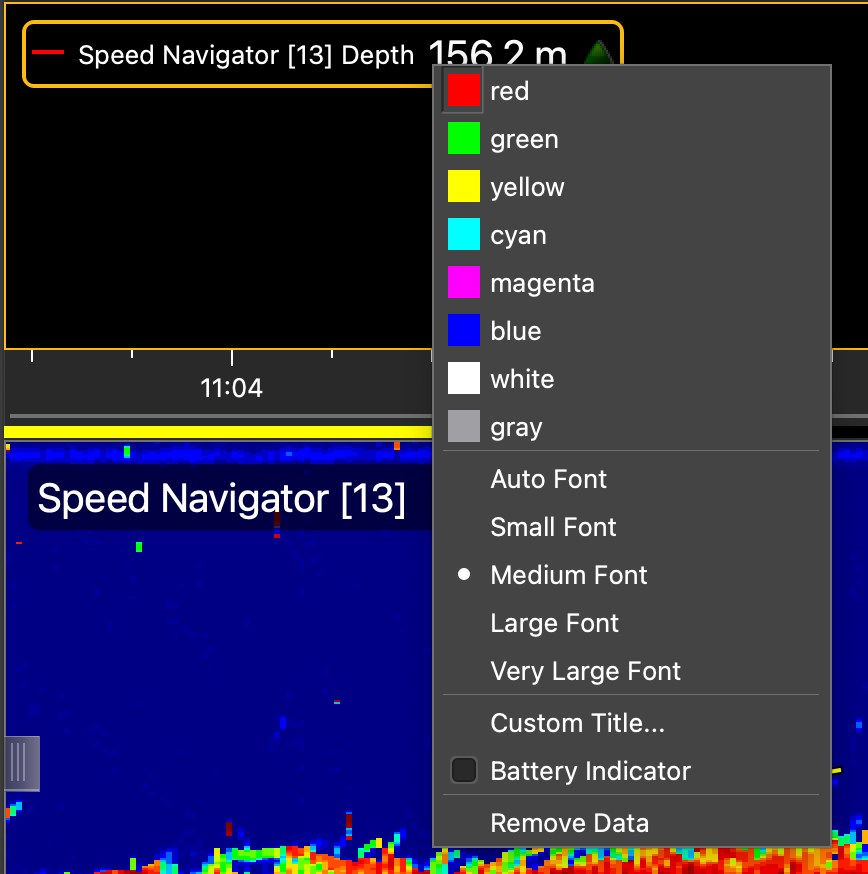
-
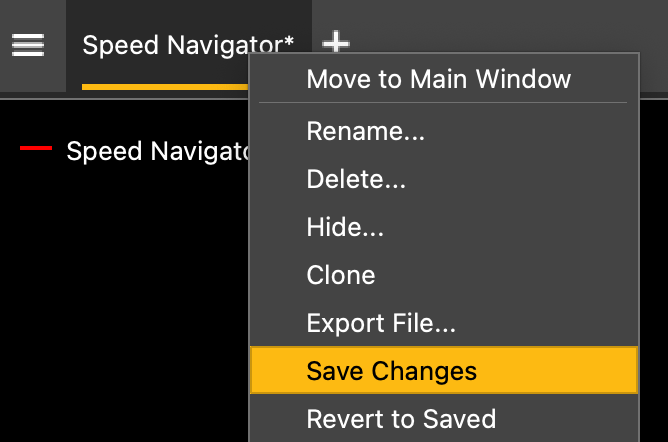
To save the changes, right-click the
tab with the name of the page and click Save Changes.