Displaying a Position Marker
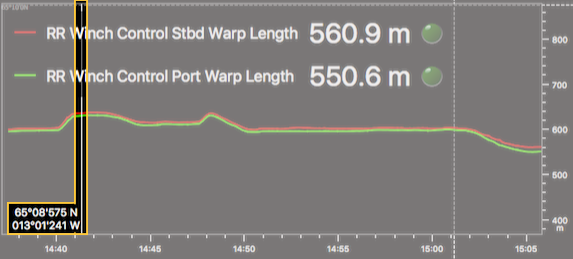
You can place a marker on plots and echograms to display the GPS position at a given time on the timestamp.
Before you begin
Procedure
-
From the top left corner, click
Menu
 > Settings.
- Under the tab Storages, select Display global position cursor on plots and echograms.
Results