Adding Data to a Page
You can choose data that will appear on the screen.
Before you begin
Procedure
-
To open the control panels, click the grey rectangle at the right side of the
screen.
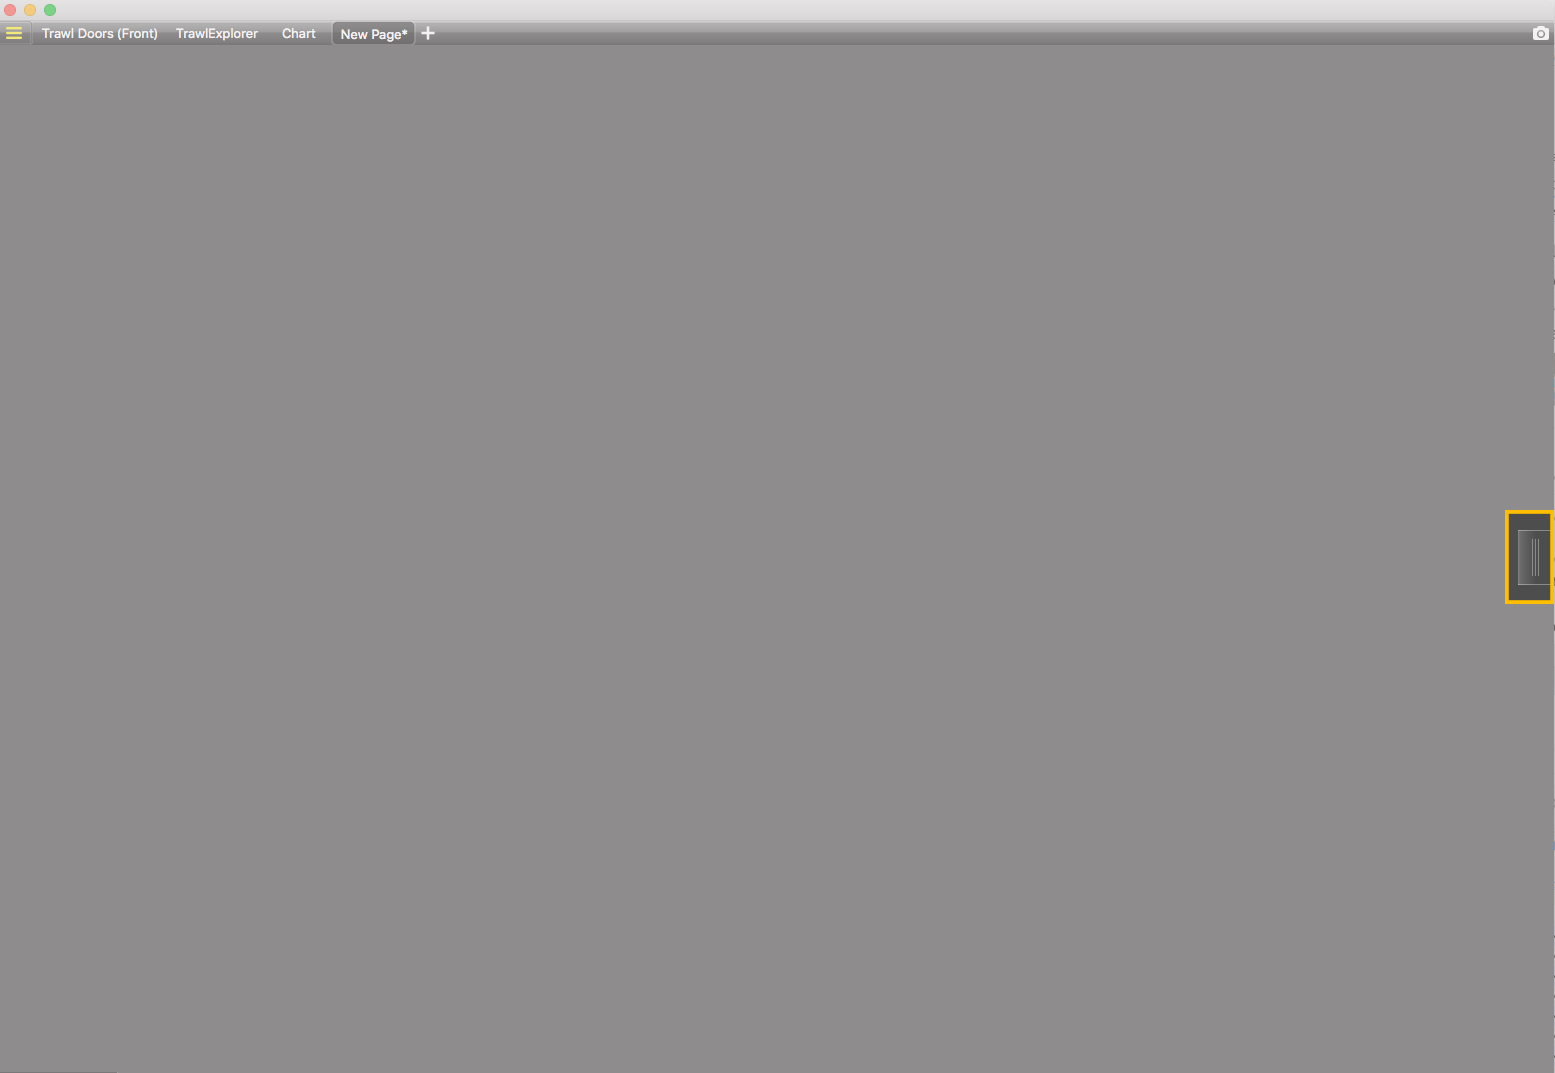 The control panels appear.
 -
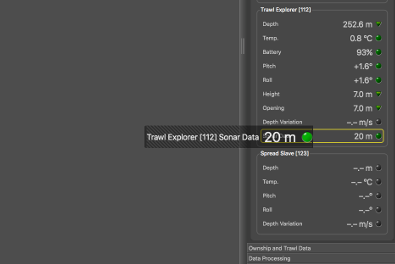
Under the Sensors Data tab, choose data and click + hold
for 3 seconds until a rectangle with data appears.
-
Hold + drag the rectangle to the middle of the screen, above grey striped
areas. The area becomes yellow when you can place data.
- Stop holding the mouse button to place data at the chosen area.
-
In the Choose new Gauge
Type dialog box that
appears, select the desired type of display for the corresponding data. See
Display Types for more information about
the types of display.
Data is displayed on the screen.
-
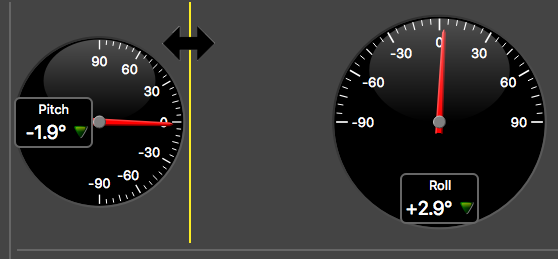
Drag the lines around data to resize it.
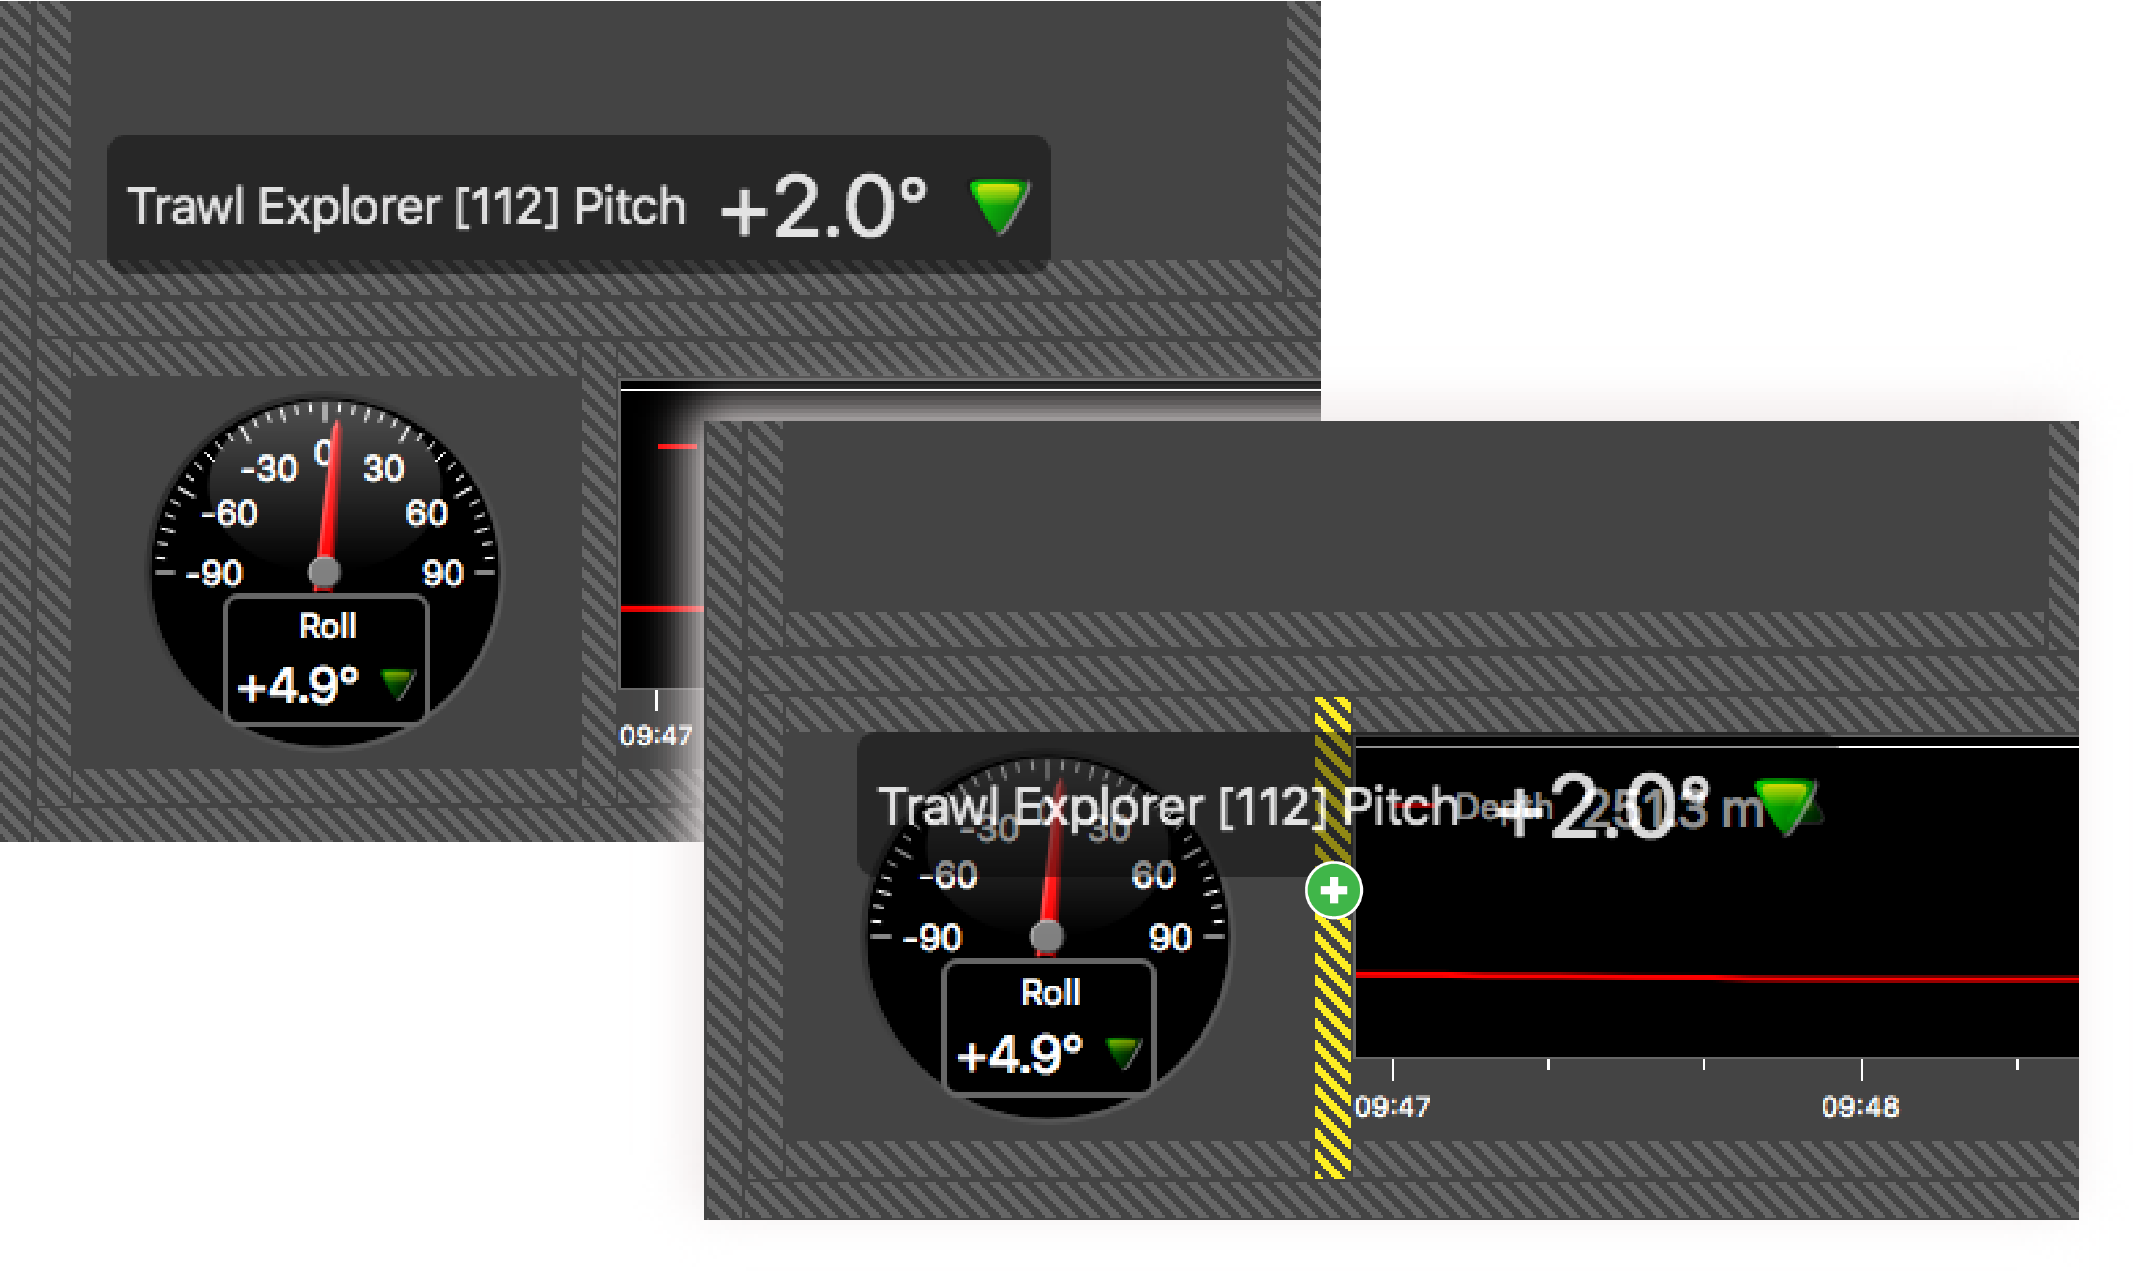
 Tip: To place data (e.g. dial, gauge, text) on top of previously placed echogram or 3D views, select data and drag it on the echogram or 3D. Locations where you can drop data are situated on the corners of the views. They appear as yellow stripes when data is dragged above the location.
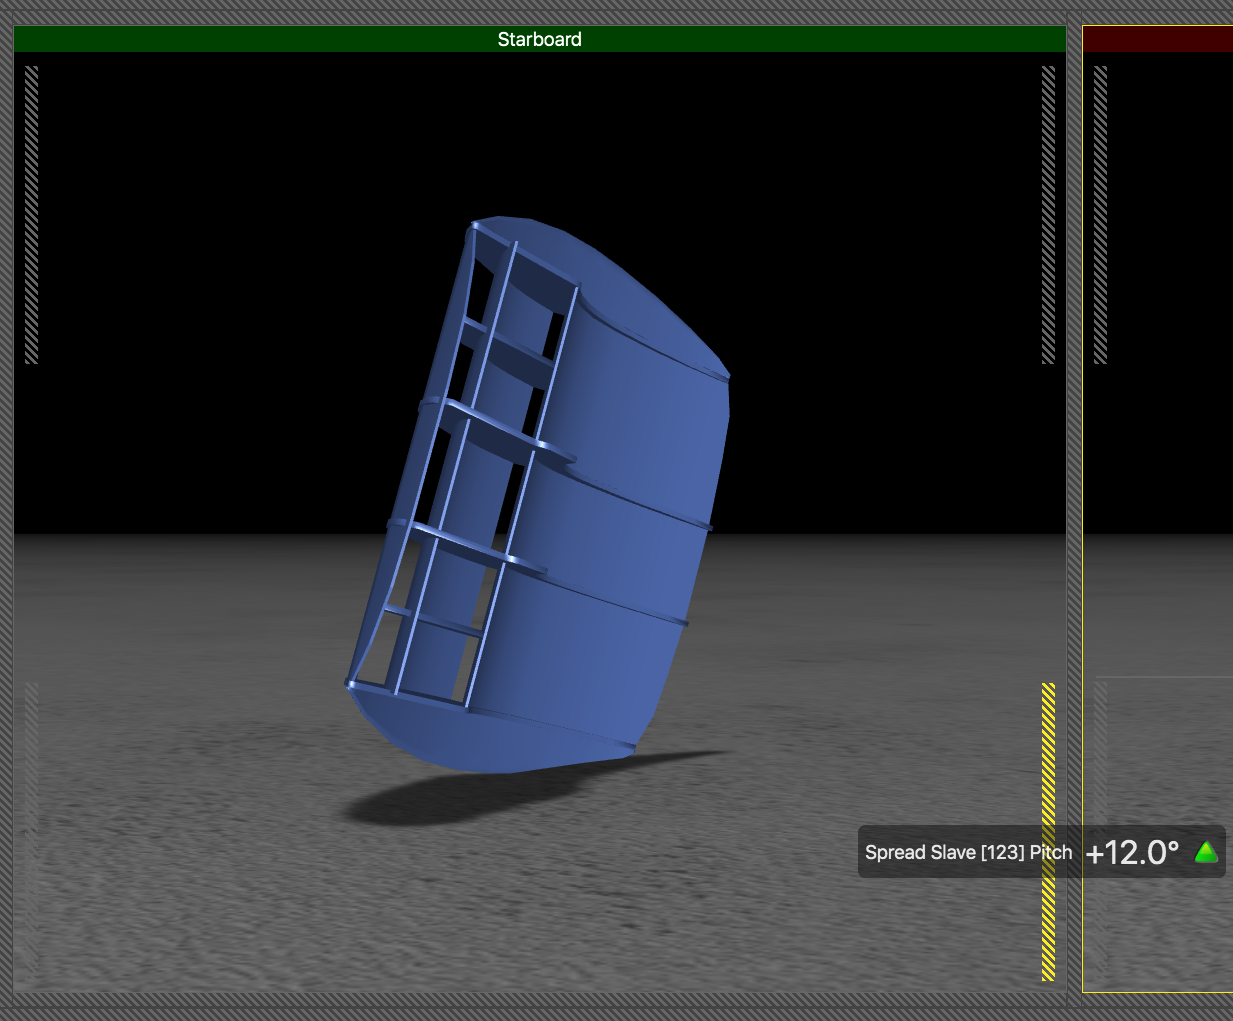
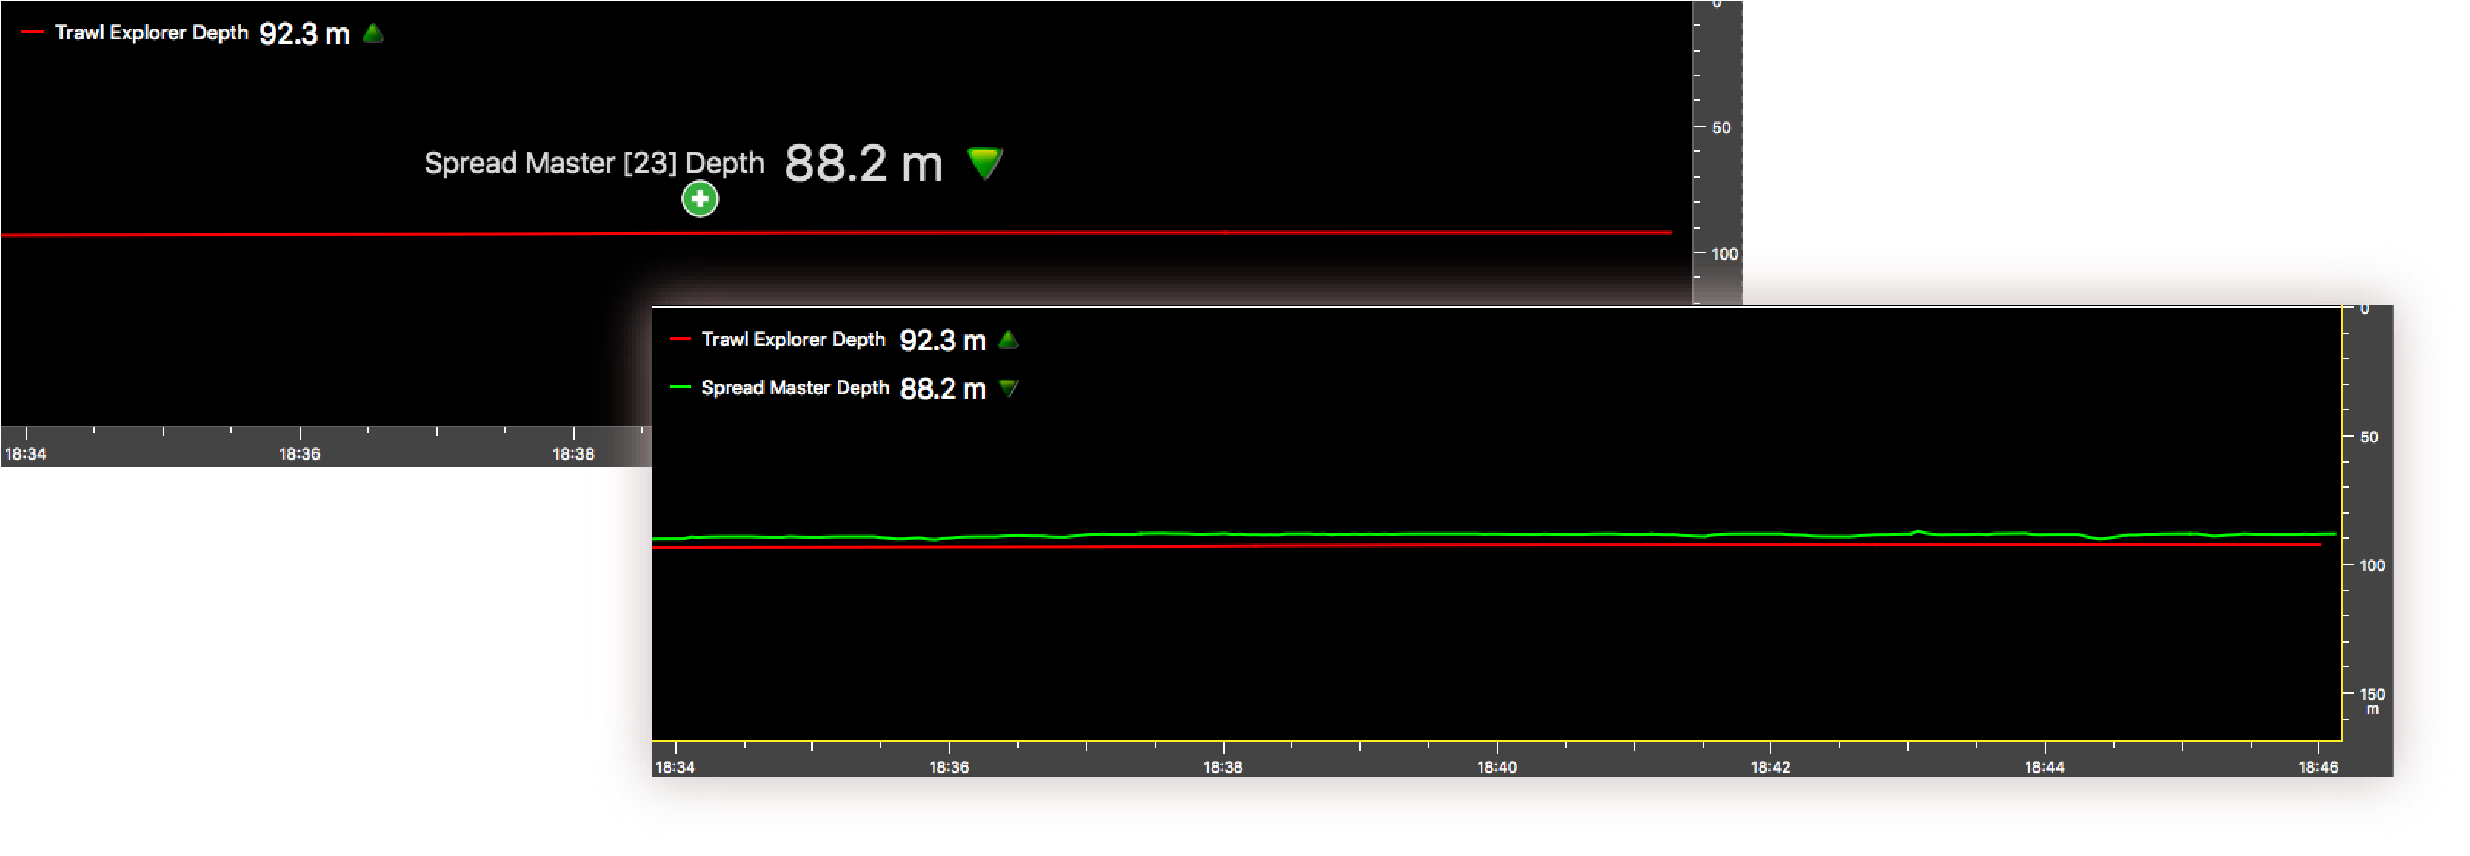
 Tip: You can add multiple data in one history plot in order to easily compare different data at the same time:
- Drag data, for example Depth from a Trawl Explorer, to a yellow area.
- In the Choose new Gauge Type dialog box, select History Plot.
- Drag other data, for example Depth from a Spread Master, to the first Depth history plot.
- The second data appear in the history plot in another
color.
What to do next
- To add other data, repeat the steps.
- Deactivate the Customize mode when you have finished
customizing pages: click Menu
 > Customize again.