Configuring Data Display on Scala2
You can display on pages in Scala2 measurements taken by the sensors, such as the spread distance or the pitch and roll of the doors. You can also use the chart or 3D view to display the position of the trawl.
About this task
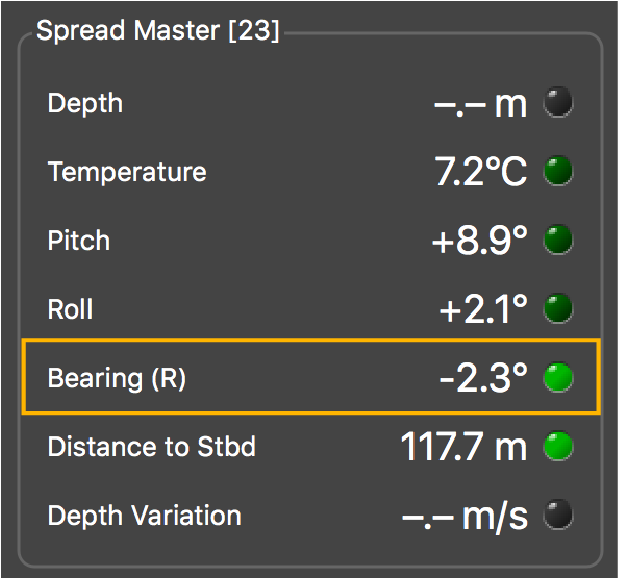
- Spread Master / Spread Slave / Spread Clump for Spread sensors.
- Slant Range for Slant Range sensors.
The title is followed by the node where the sensor was placed when added to the system.
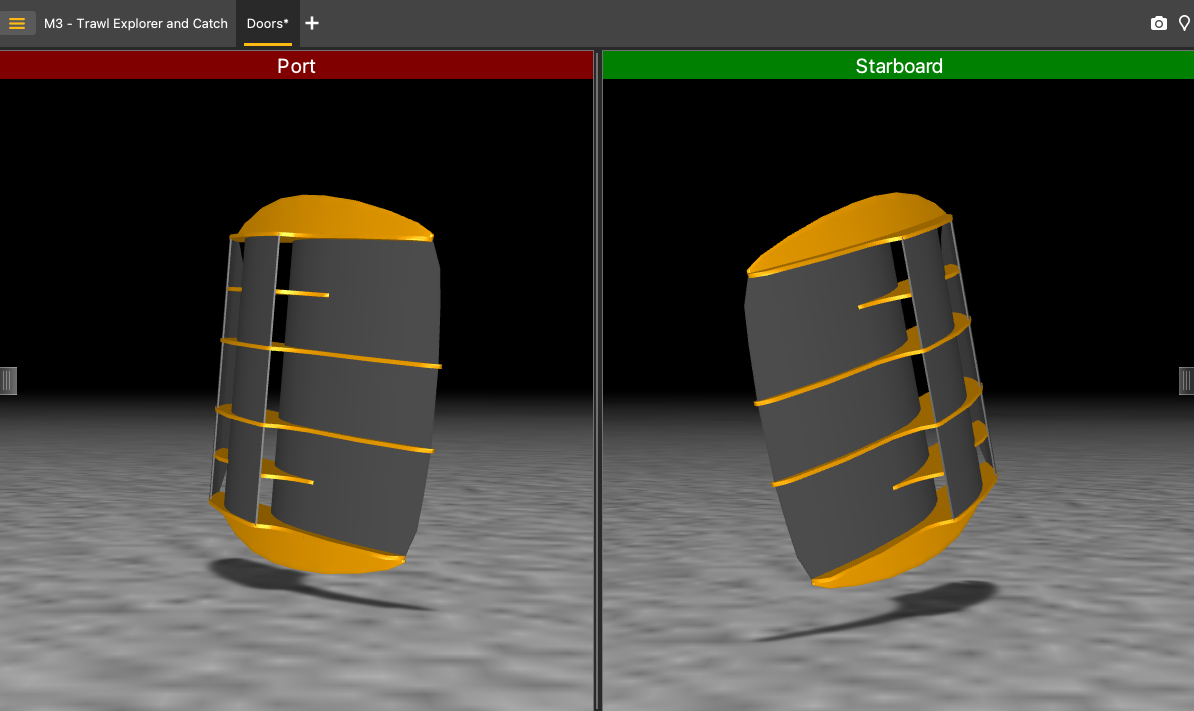
Spread Sensor: Displaying Door 3D View
Procedure
-
From the top left corner of the screen, click
Menu
 > Customize and enter the password
eureka.
> Customize and enter the password
eureka.
-
From the top toolbar, click the add icon
 .
.
-
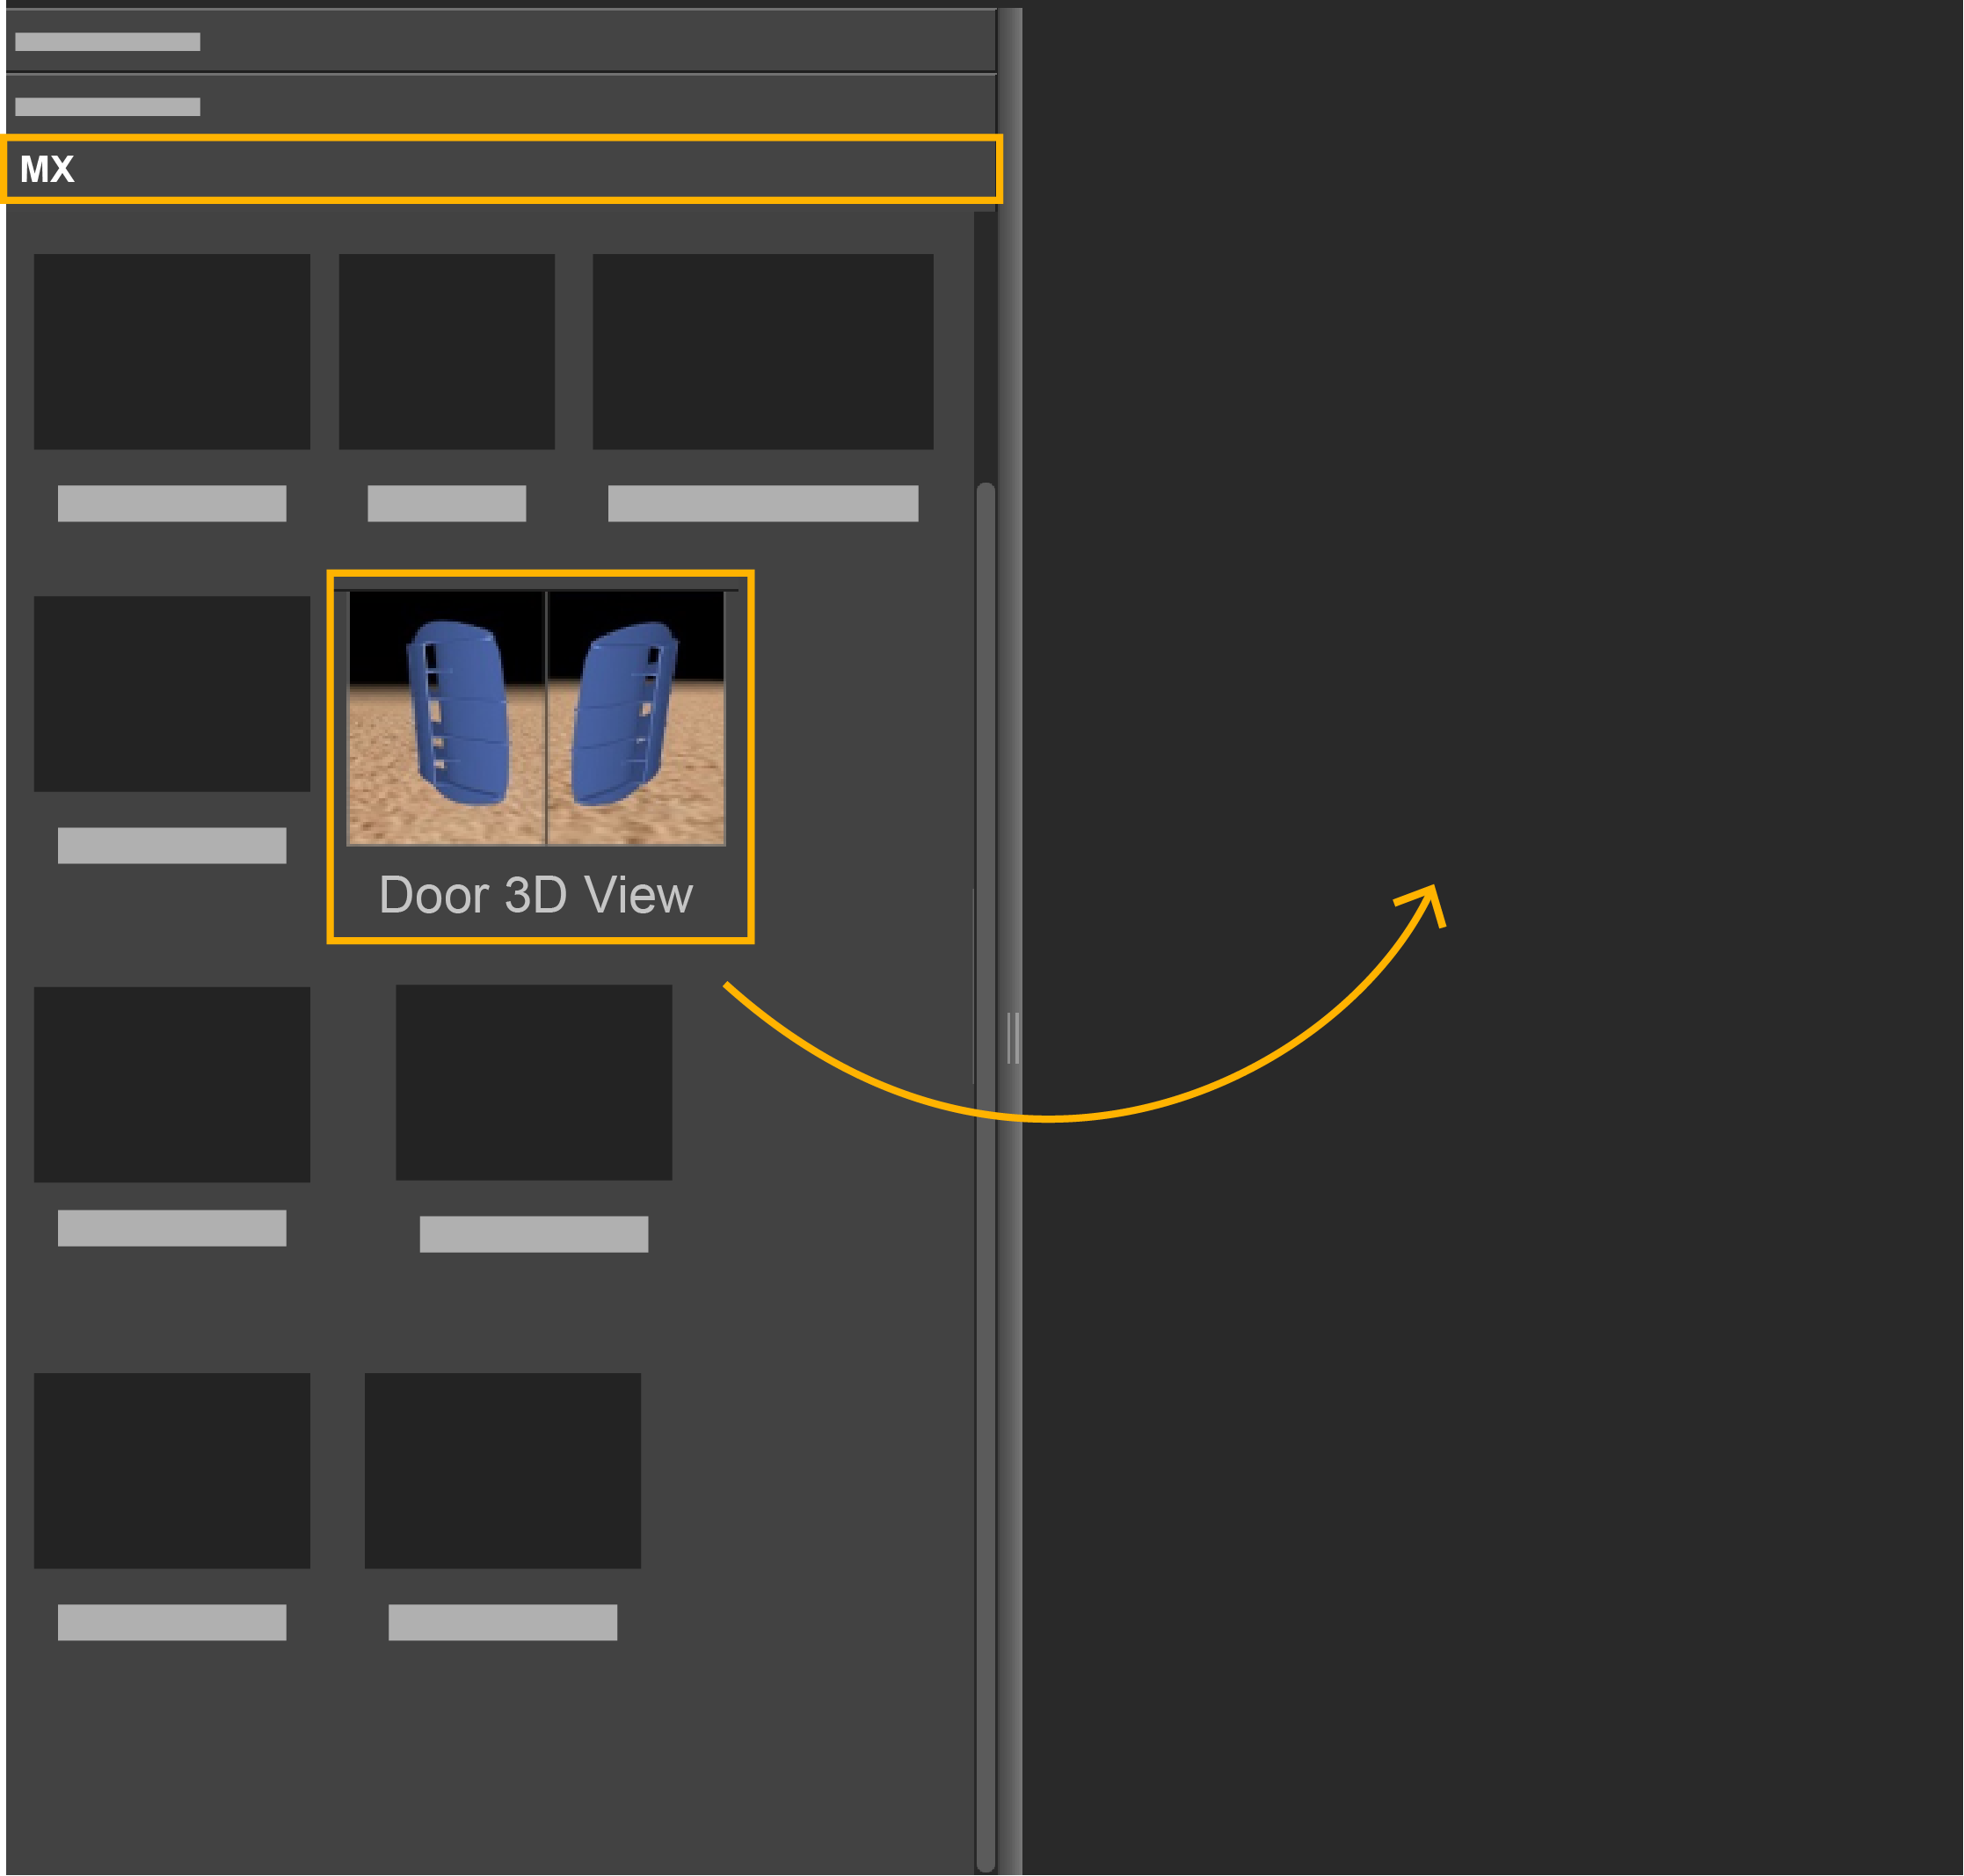
Open the customize panel, then go to Mx and drag Door 3D View to the page.
-
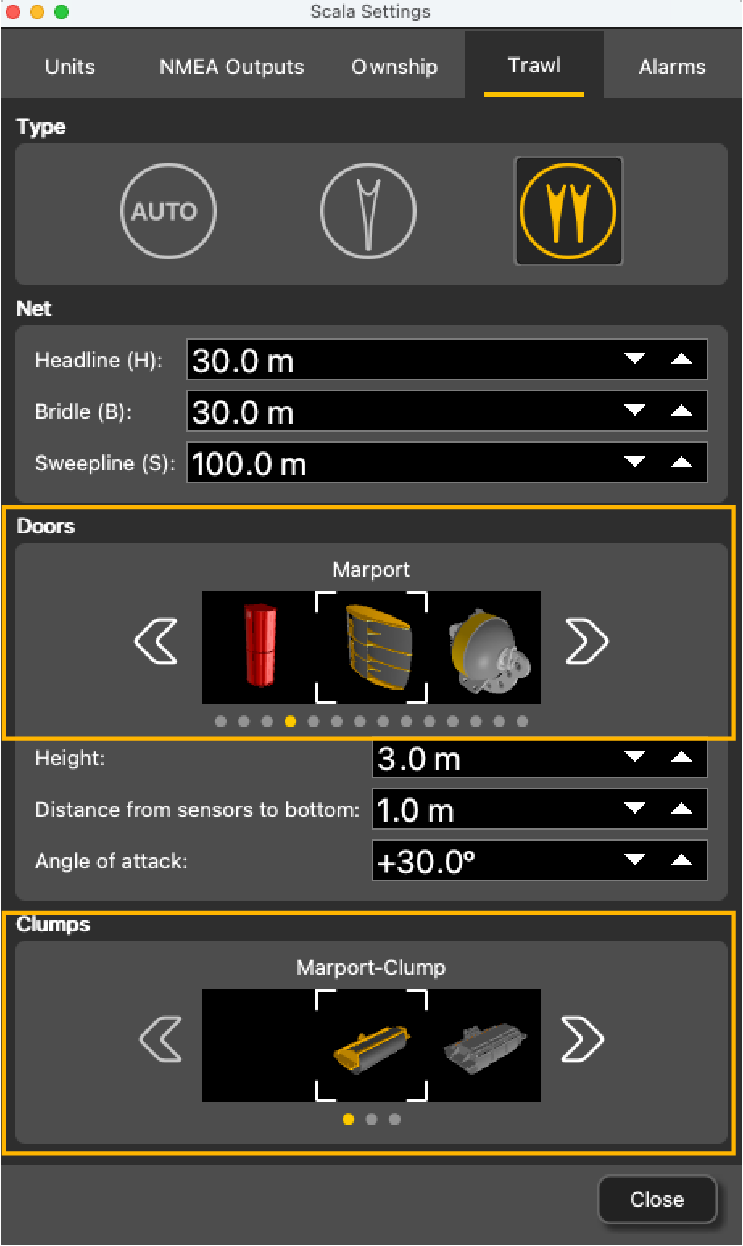
To change the door or clump model:
-
From the top left corner, click
Menu
 > Settings.
-
Click the Trawl tab and
select the models of doors and clump from the lists, using left and
right arrows.
-
From the top left corner, click
Menu
-
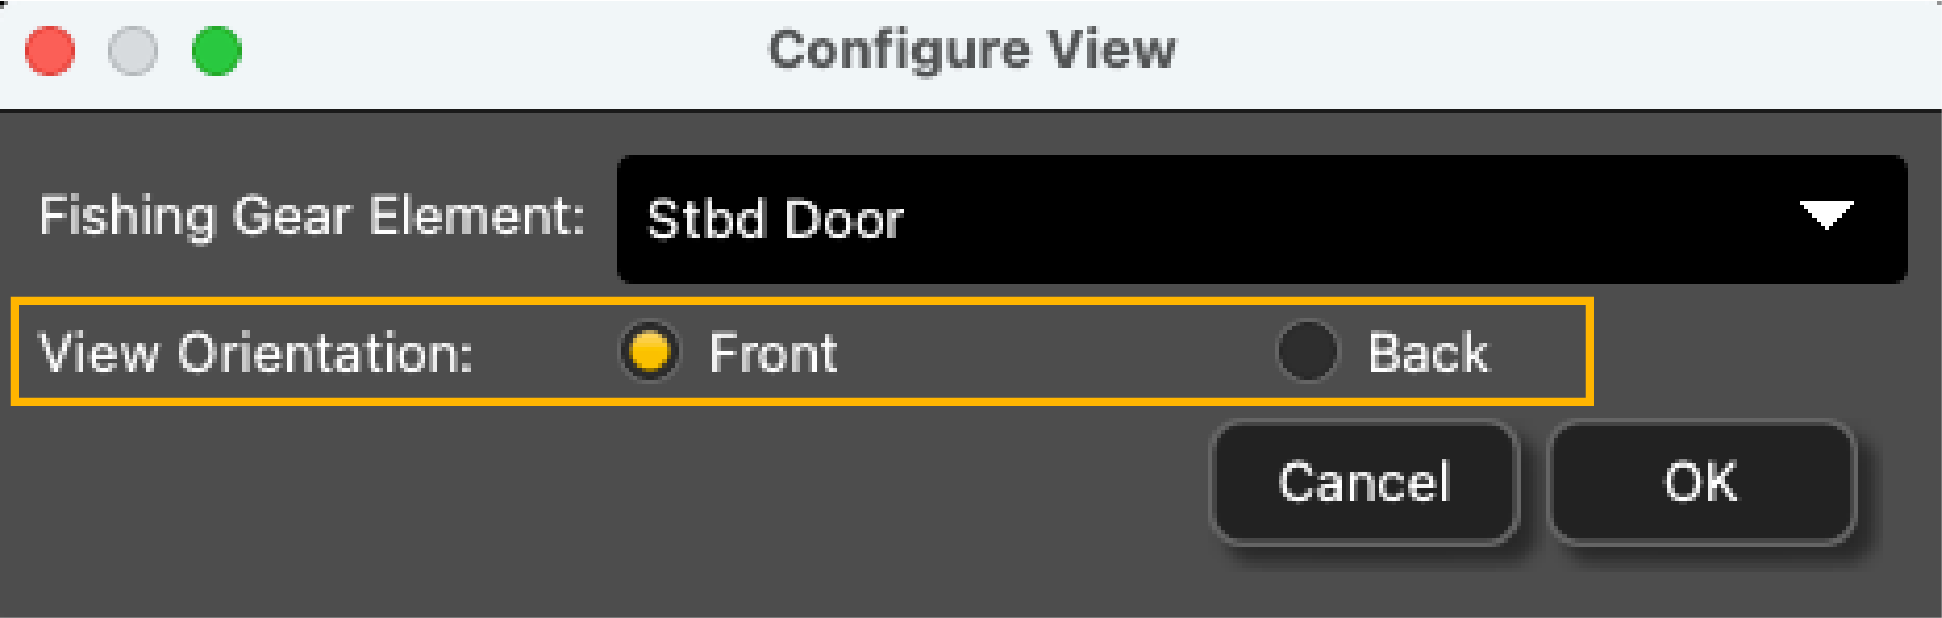
You can also change the viewing angle: looking from the
trawl toward the vessel (front), or from the vessel toward the trawl (back).
-
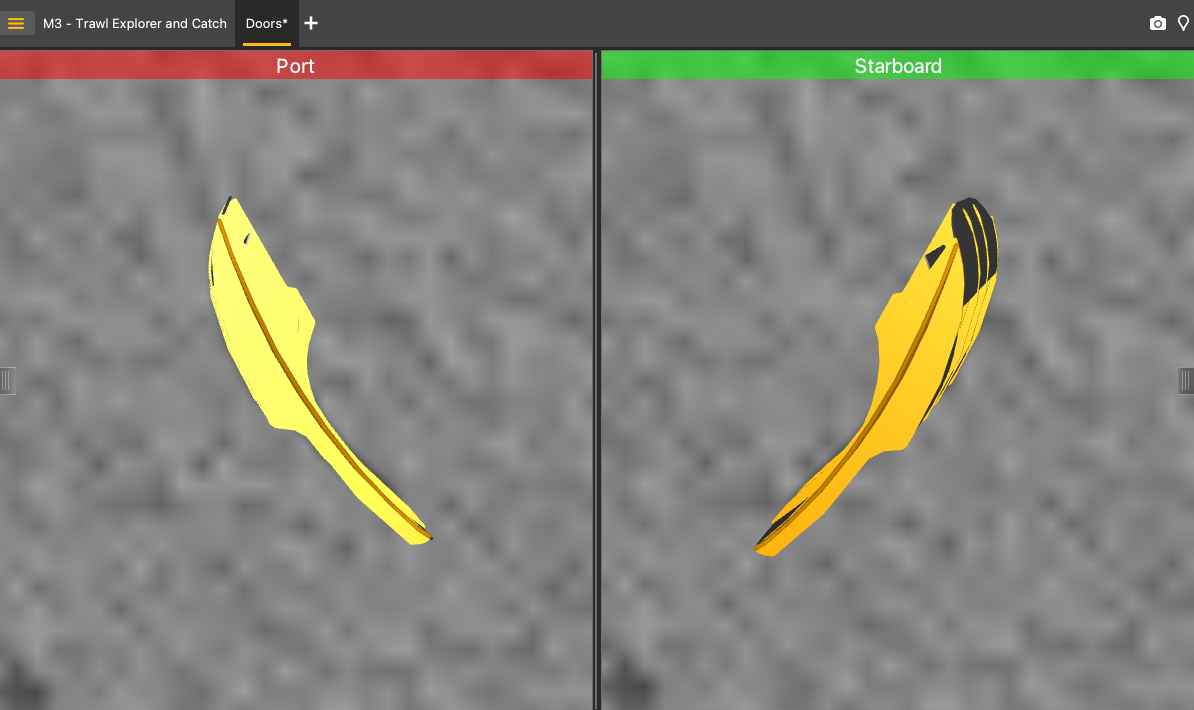
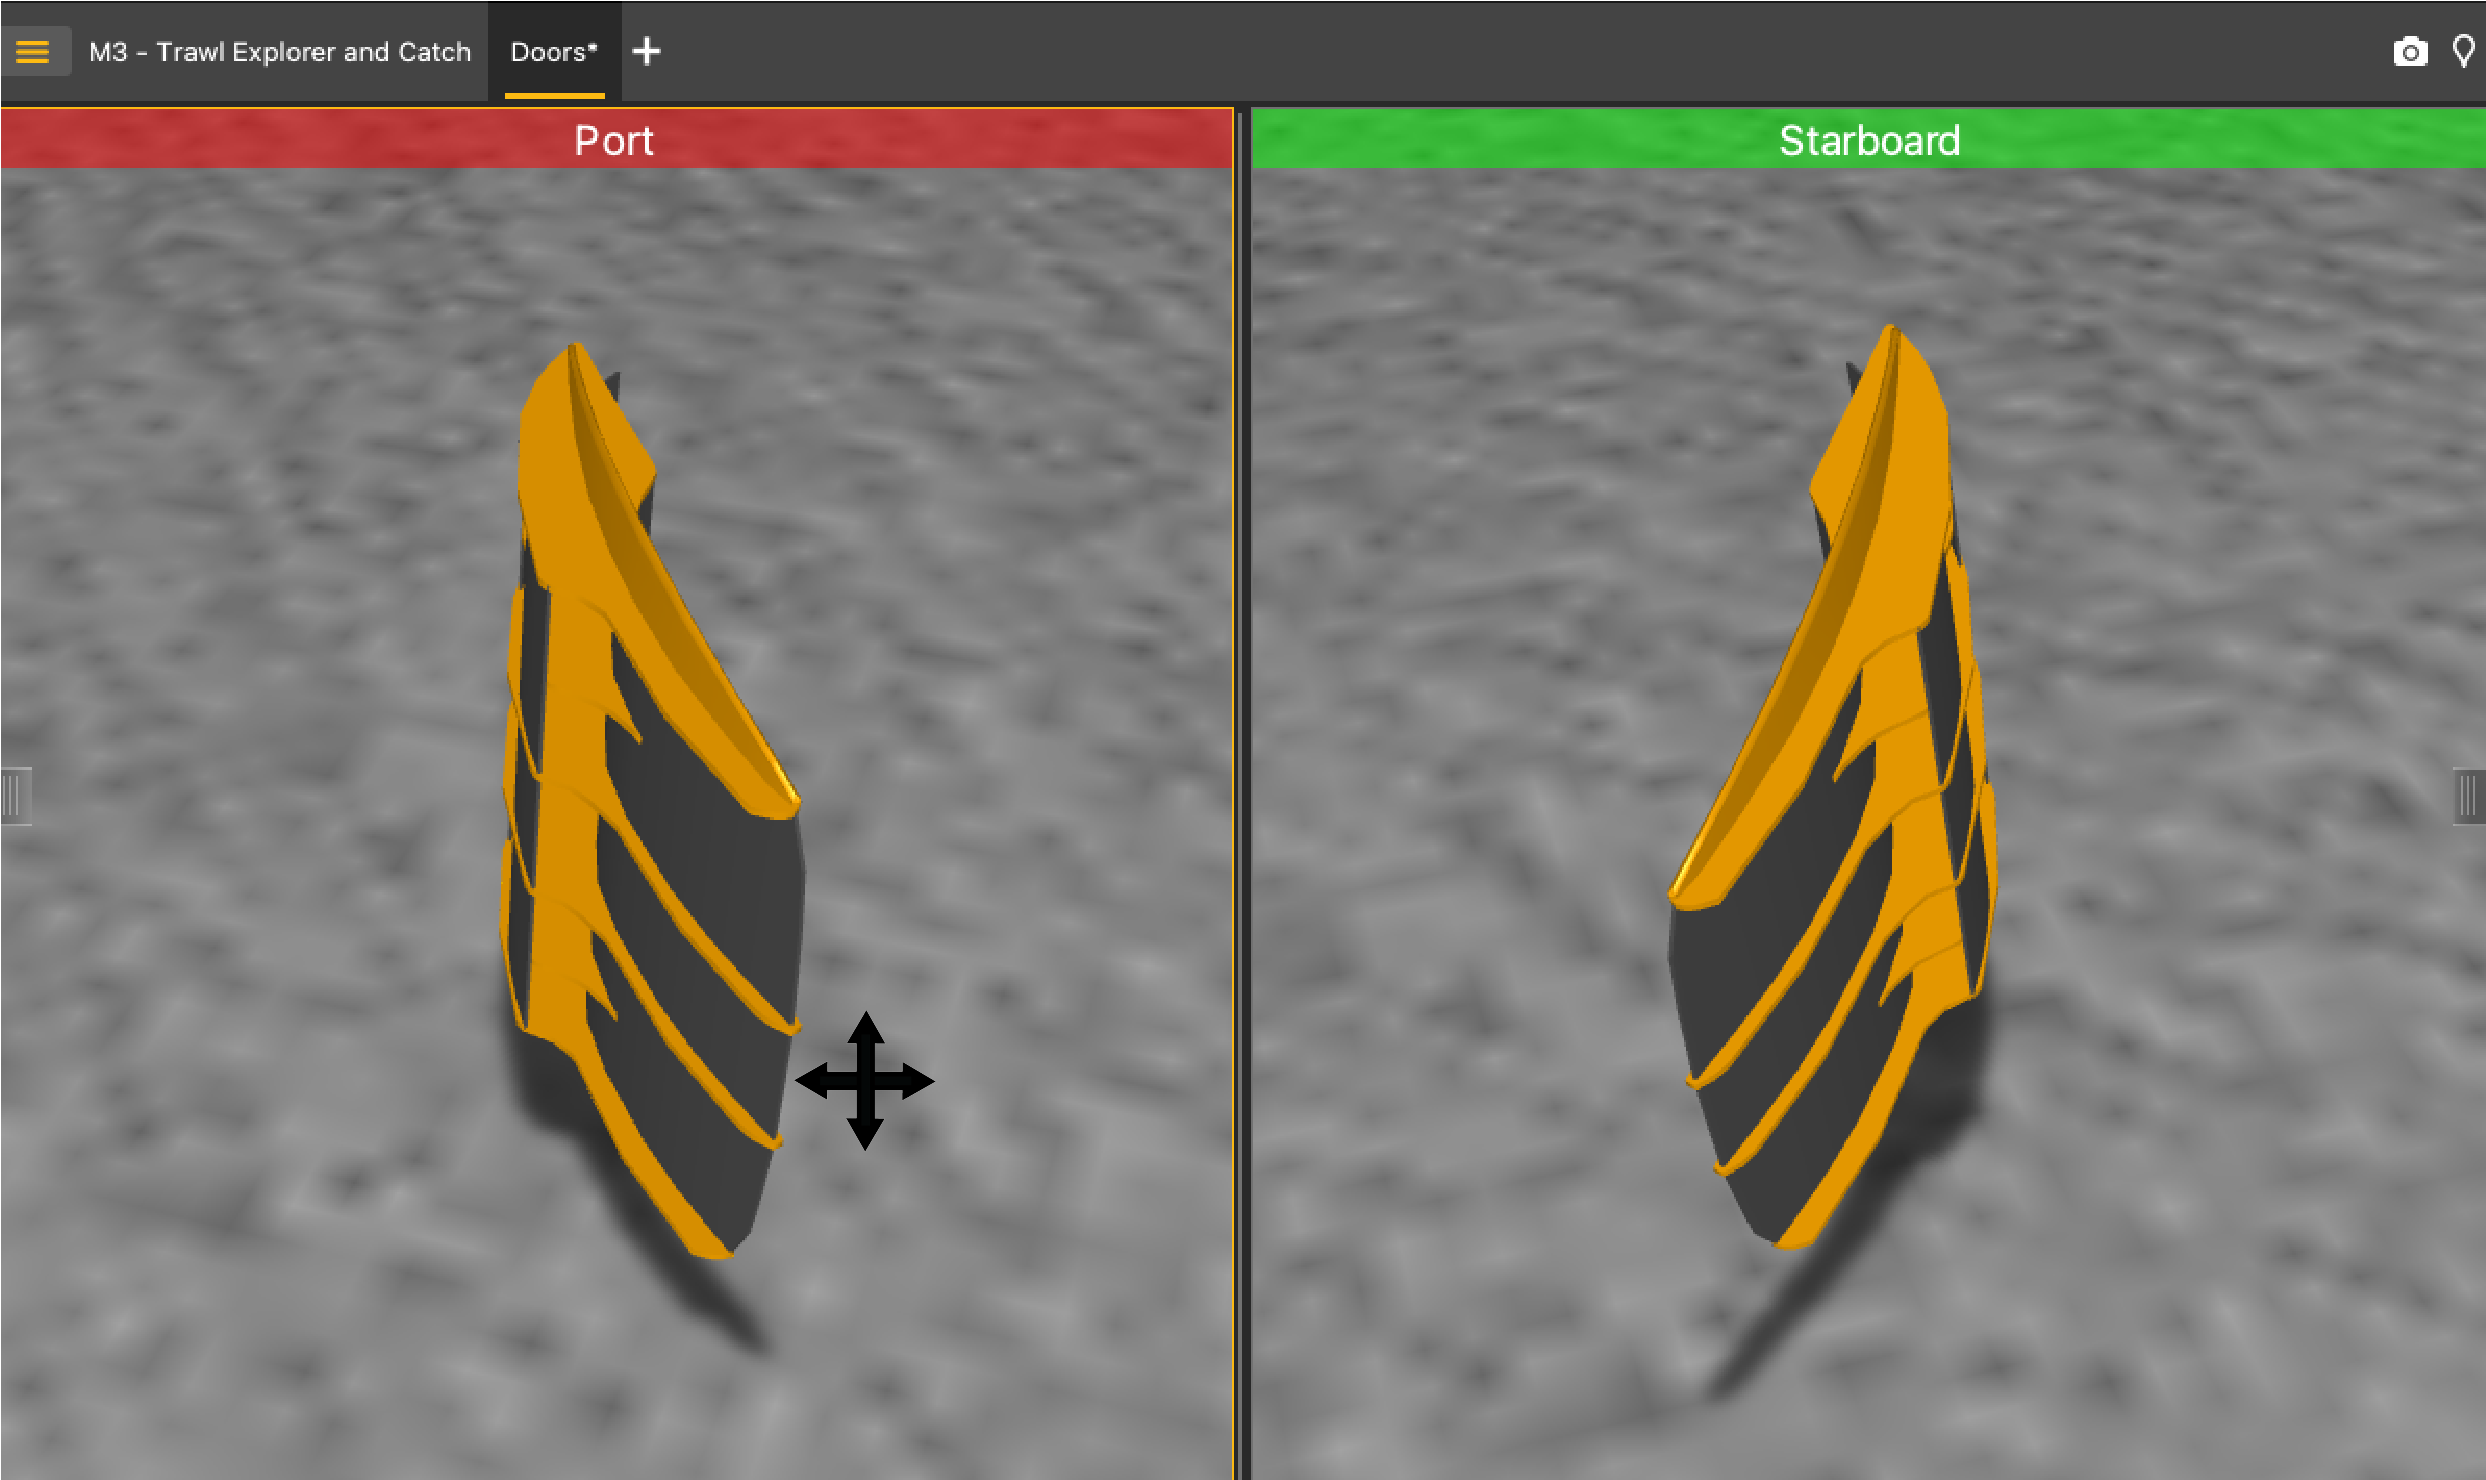
To change the view angle of the door, right-click the 3D view and choose:
- Horizontal
Camera to see the doors from
the front:
 Or back:
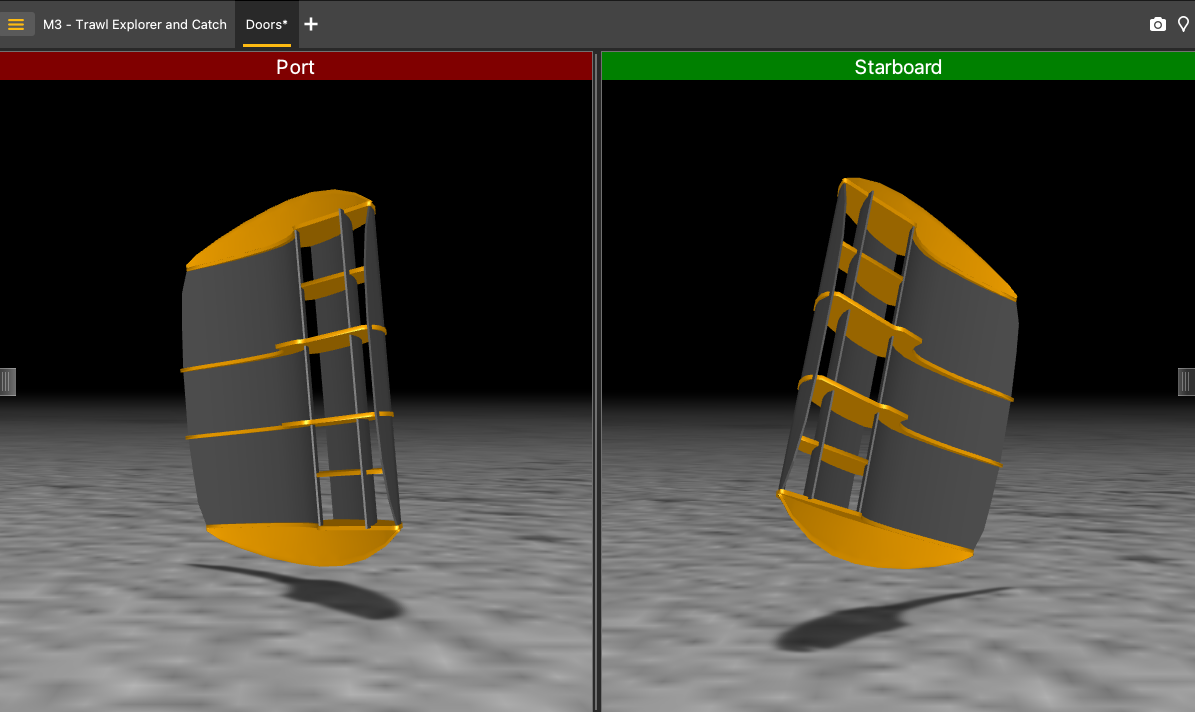
- Vertical Camera to see the doors from
above.
- Free Camera to adjust the viewing
angle yourself, by clicking and dragging the 3D doors.
- Horizontal
Camera to see the doors from
the front:
- To display or hide the ground, right-click the 3D view and select or not Display Ground. You should leave the ground displayed, in order to see if the doors are touching it.
-
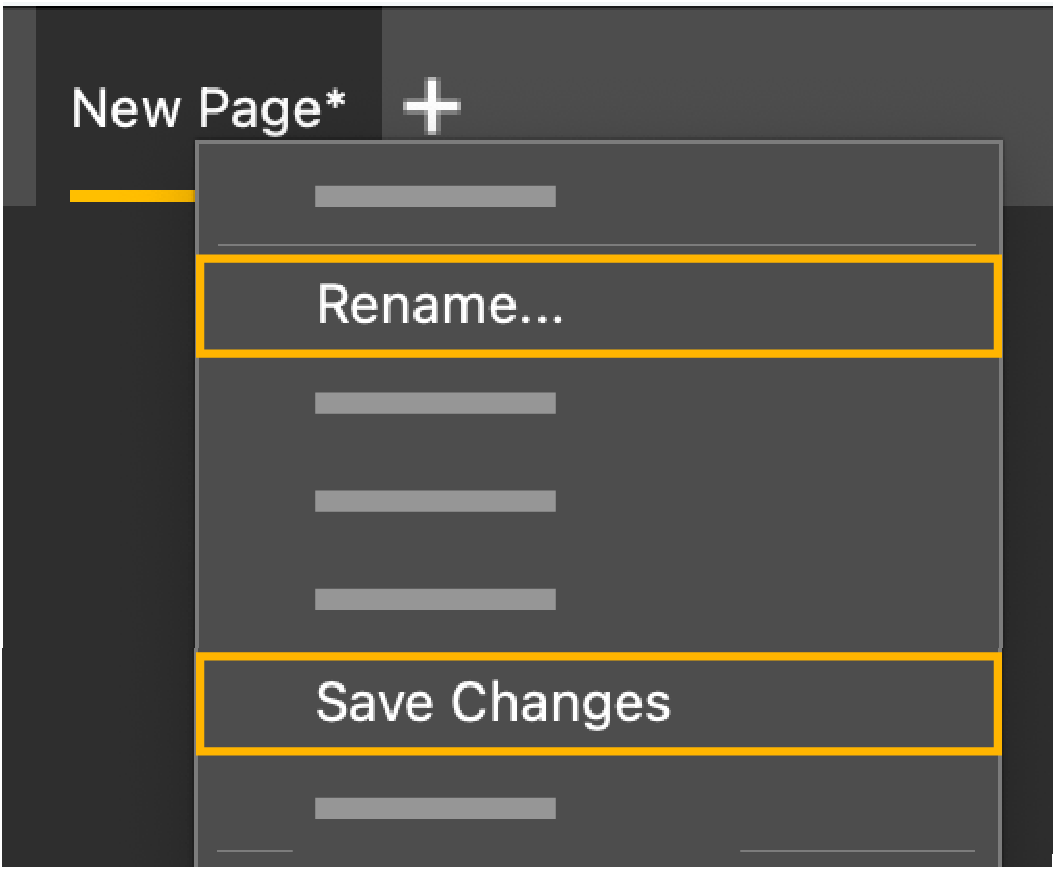
To save the changes you made:
- To rename the page, right-click the name of the page and click Rename.
-
To save the page, right-click the name of the page and click Save Changes.
-
Deactivate the Customize mode when you have finished
customizing pages: click Menu > Customize again.
Spread Sensor: Displaying Single Trawl Spread
Procedure
-
From the top left corner of the screen, click
Menu > Customize and enter the password
eureka.
-
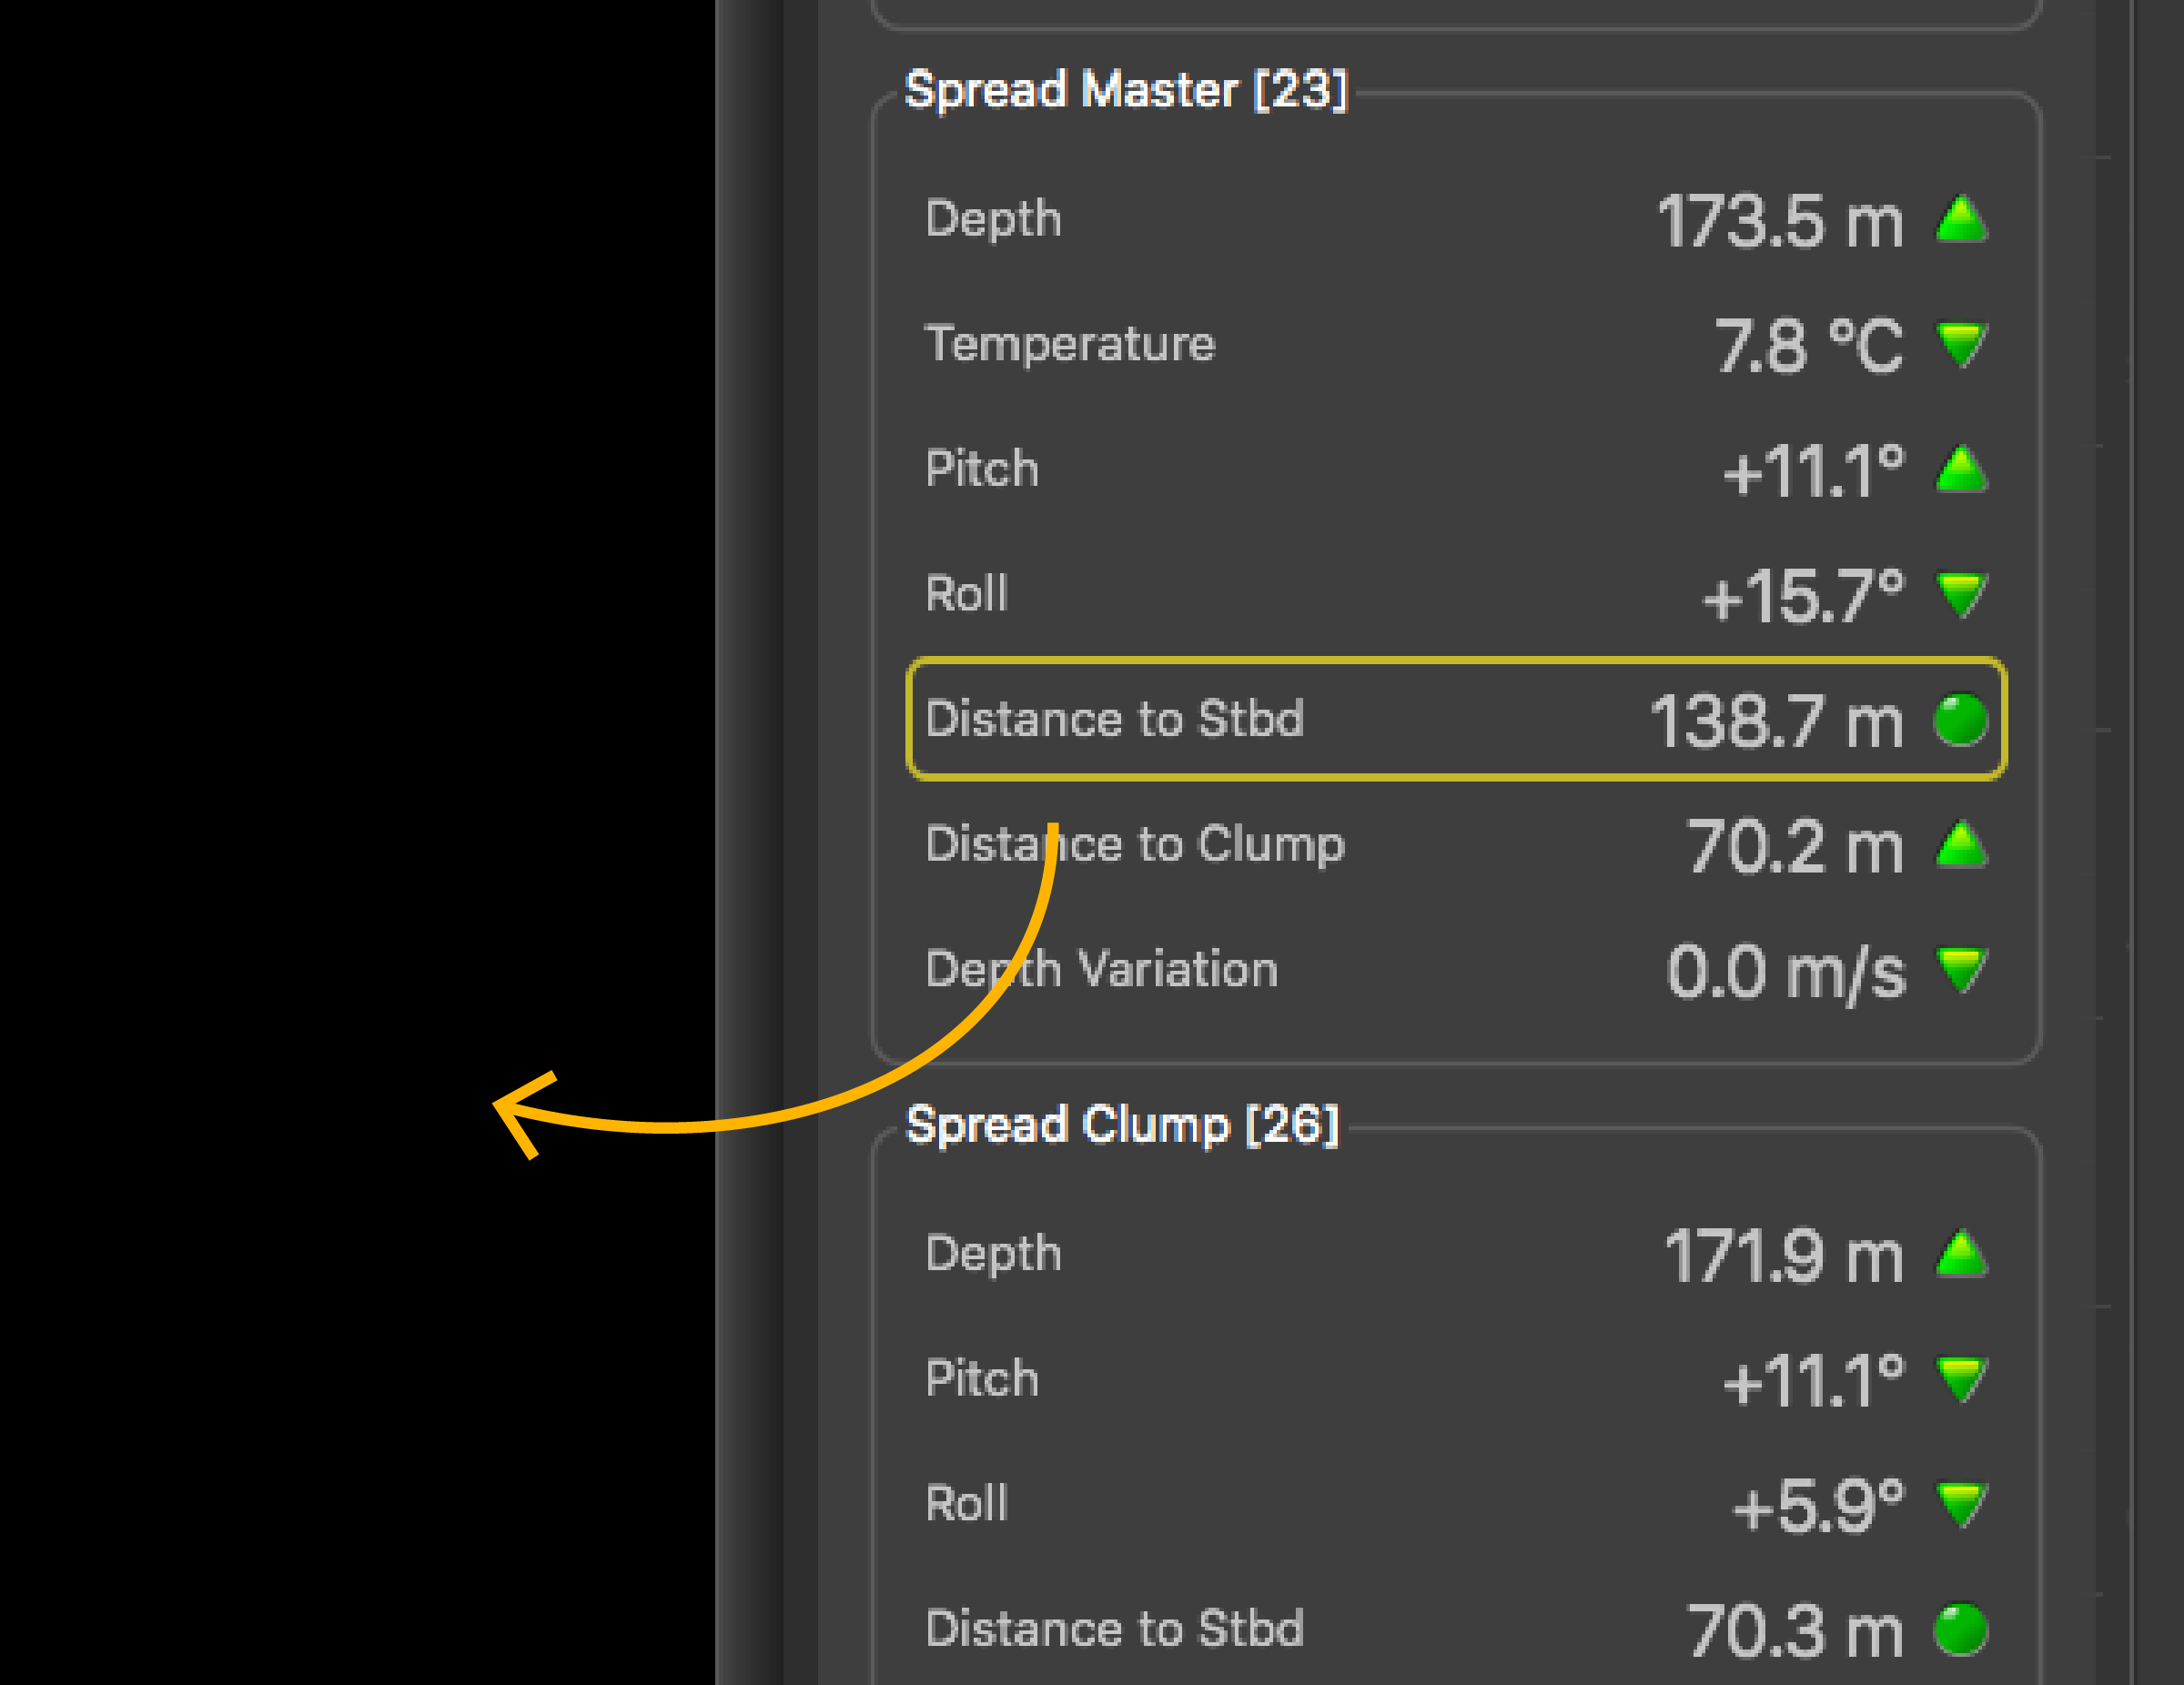
Open the control panels and from the Mx tab, click + hold distance data from
spread sensors such as Distance to Stbd from
a Spread Master and drag it to the page
display.
-
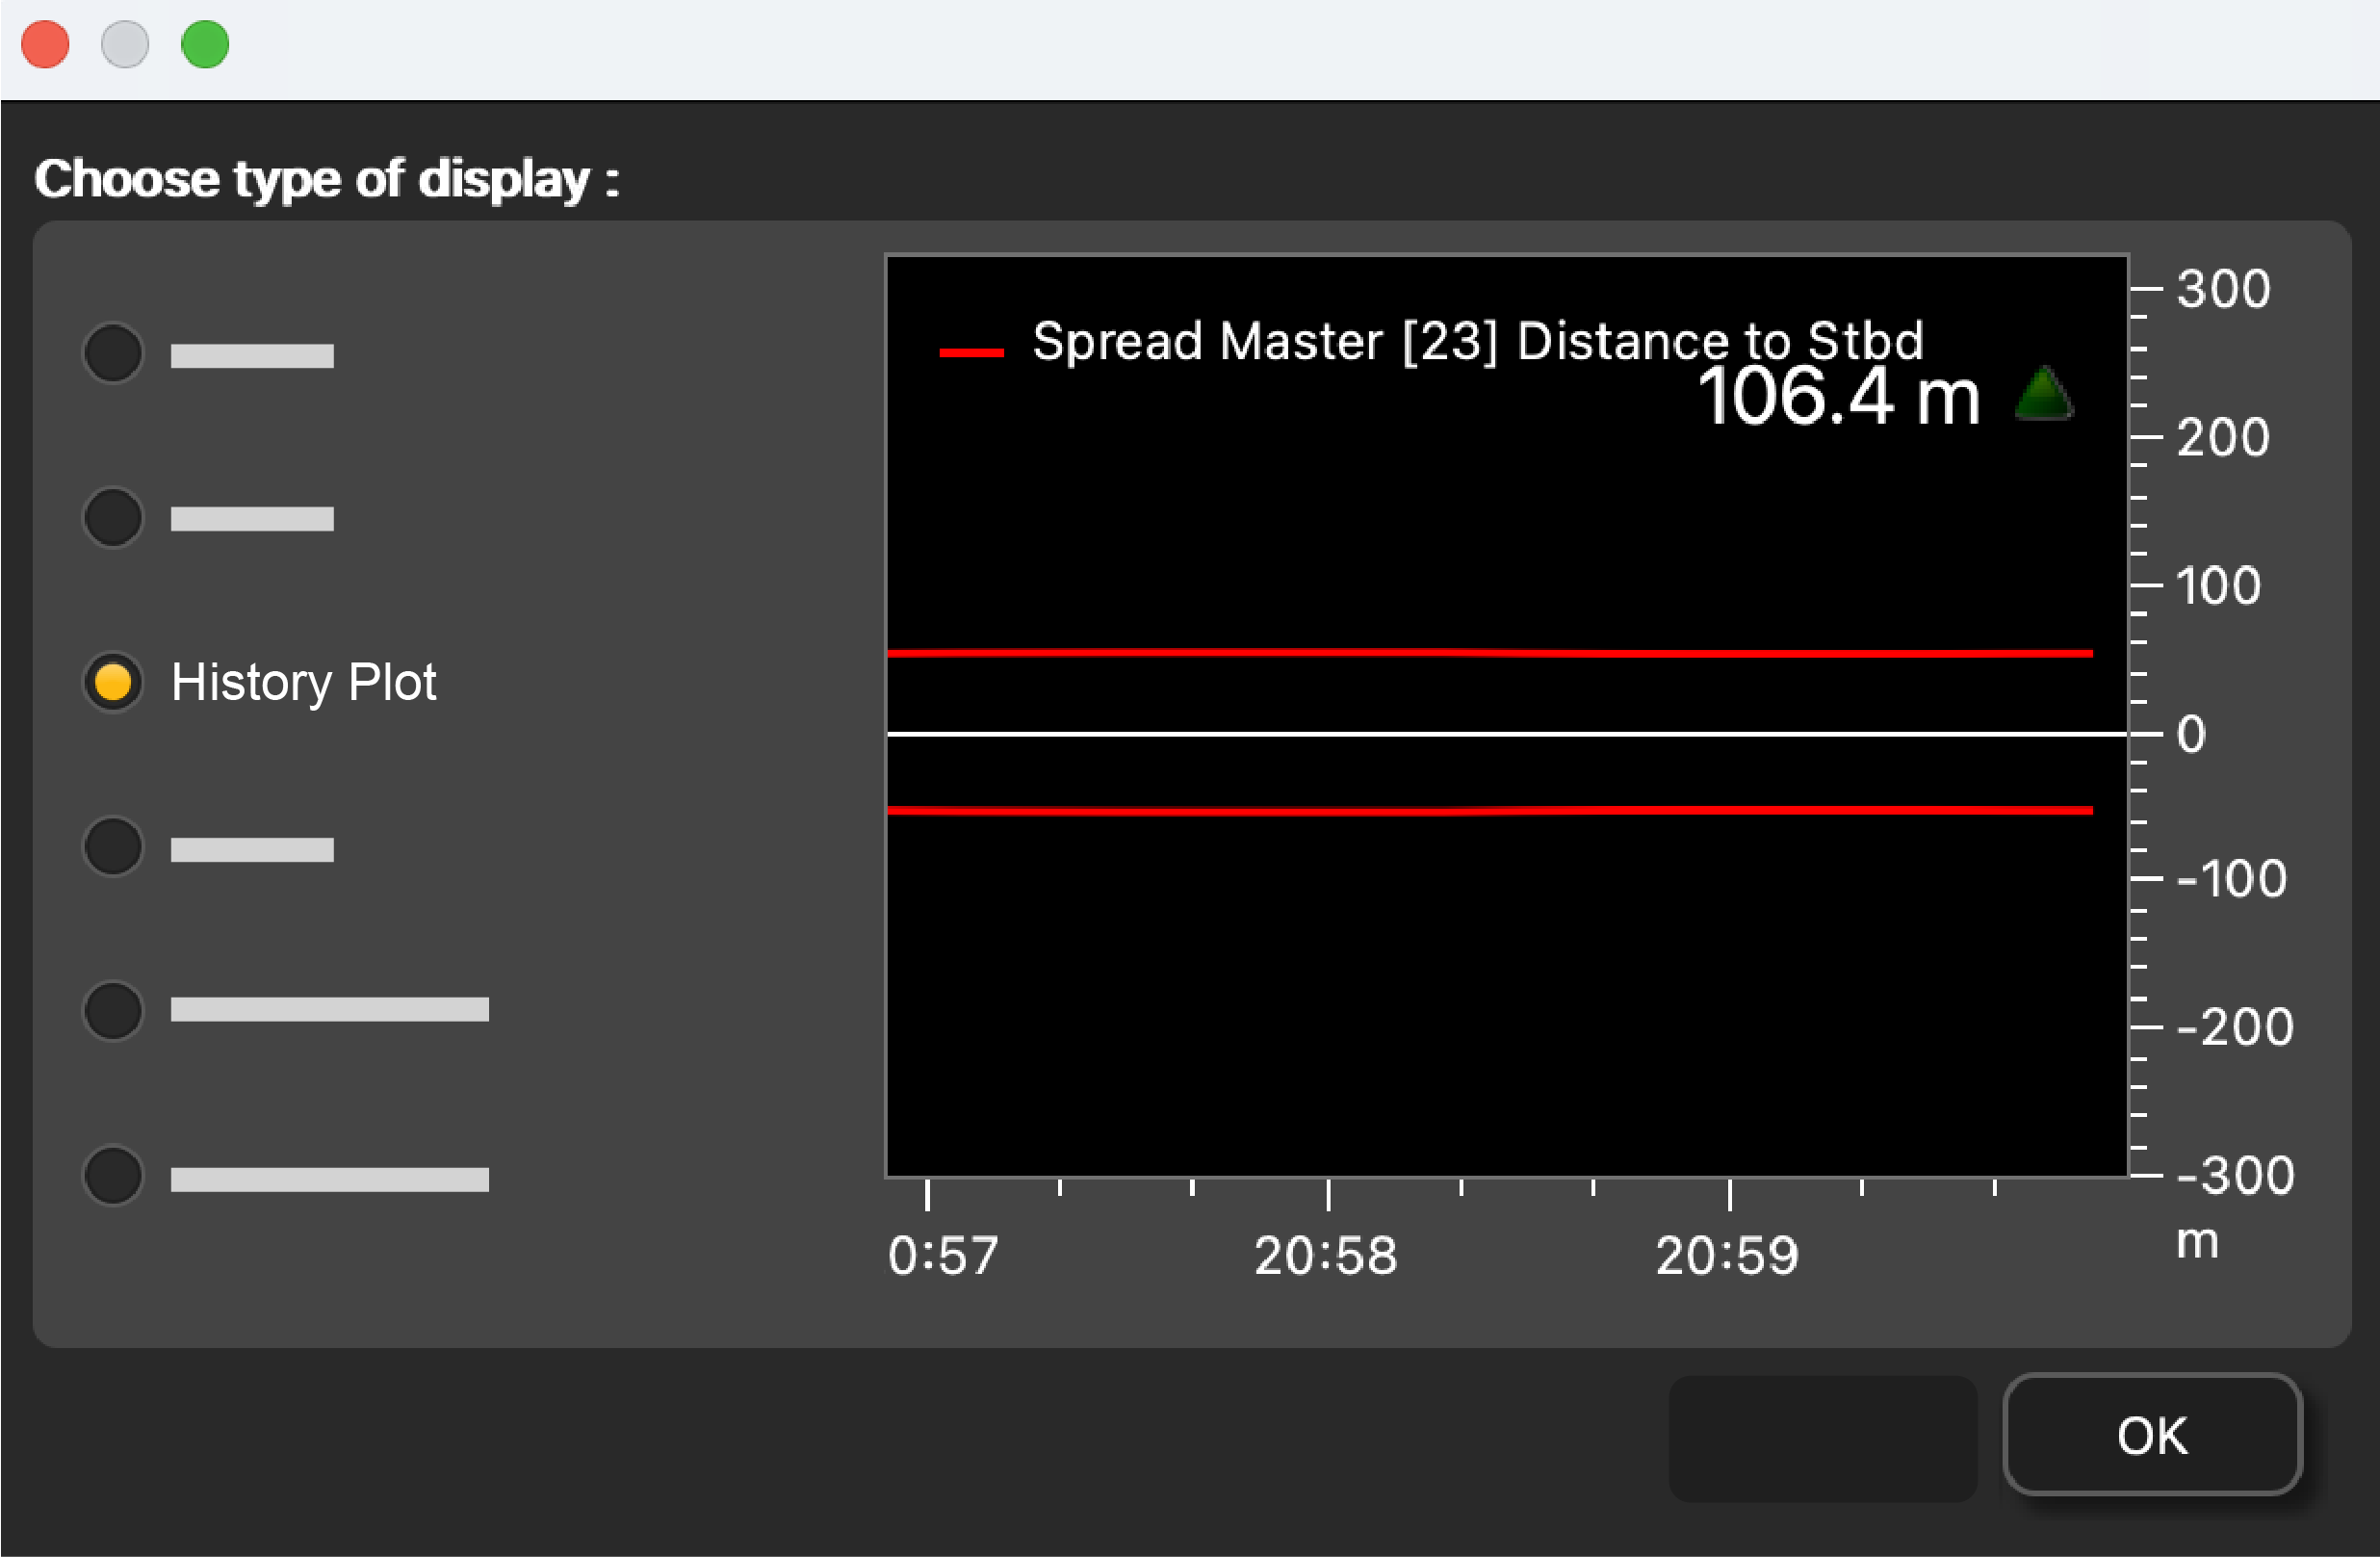
In Choose new Gauge
Type, select
History Plot.
-
Right-click the history plot and select Vertical.
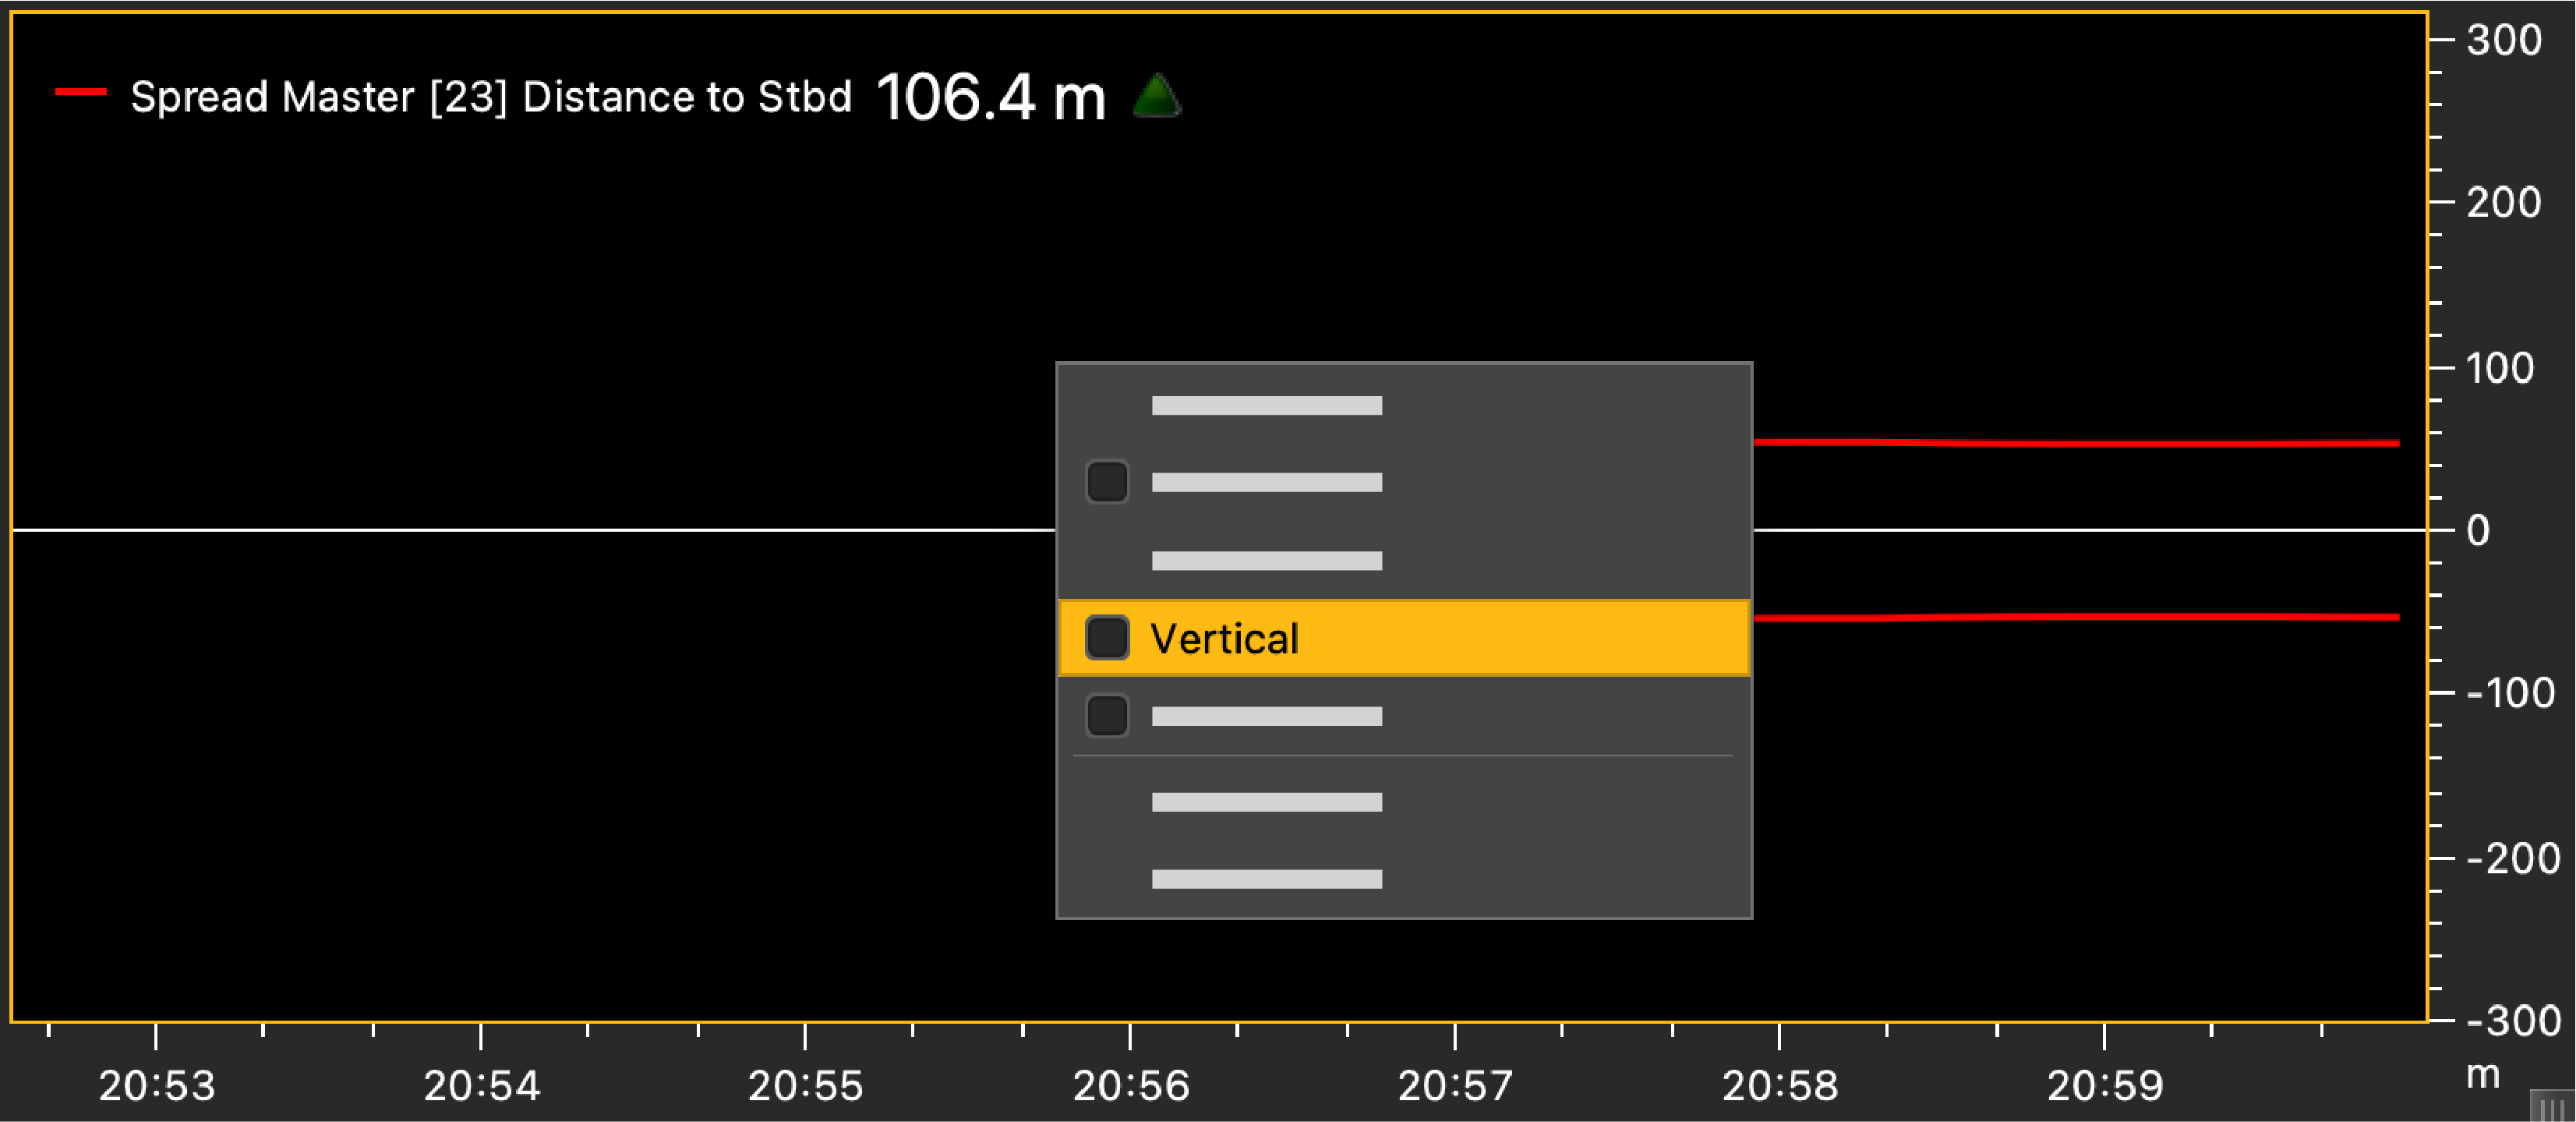 The history plot becomes vertical. You can see the distance between the port and starboard door.
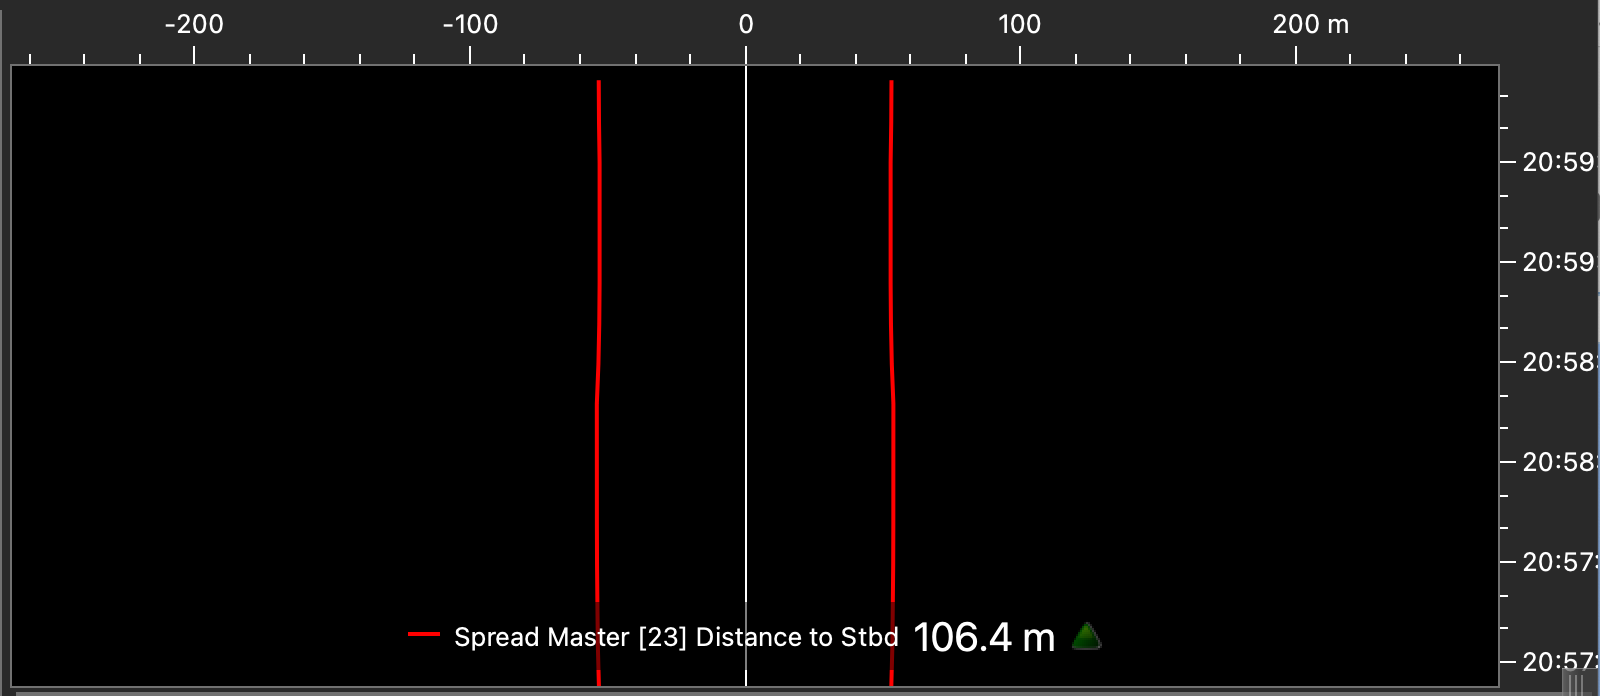
-
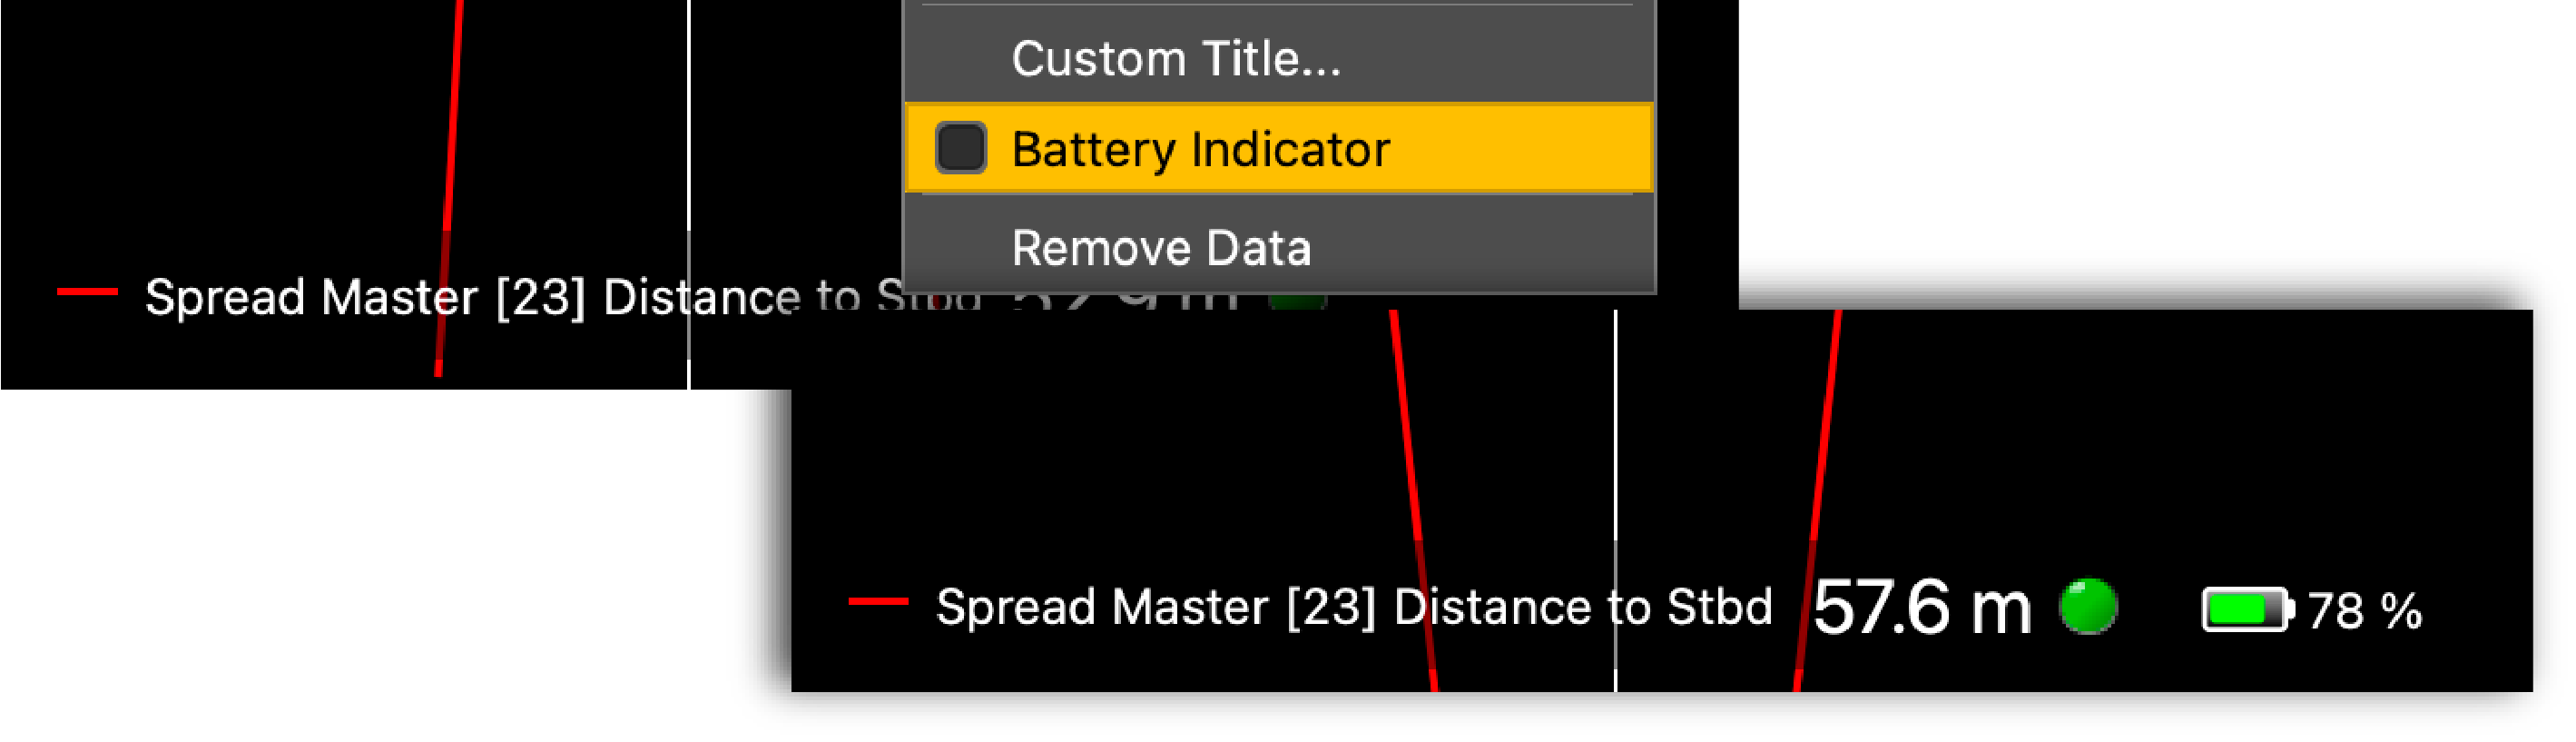
If you have a firmware version 08.03 and above, you can display the battery
level on the plot. Right-click the title of the plot and click Battery
Indicator.
What to do next
Spread Sensor: Displaying Twin Trawl Spread
Before you begin
Procedure
-
From the top left corner of the screen, click
Menu > Customize and enter the password
eureka.
-
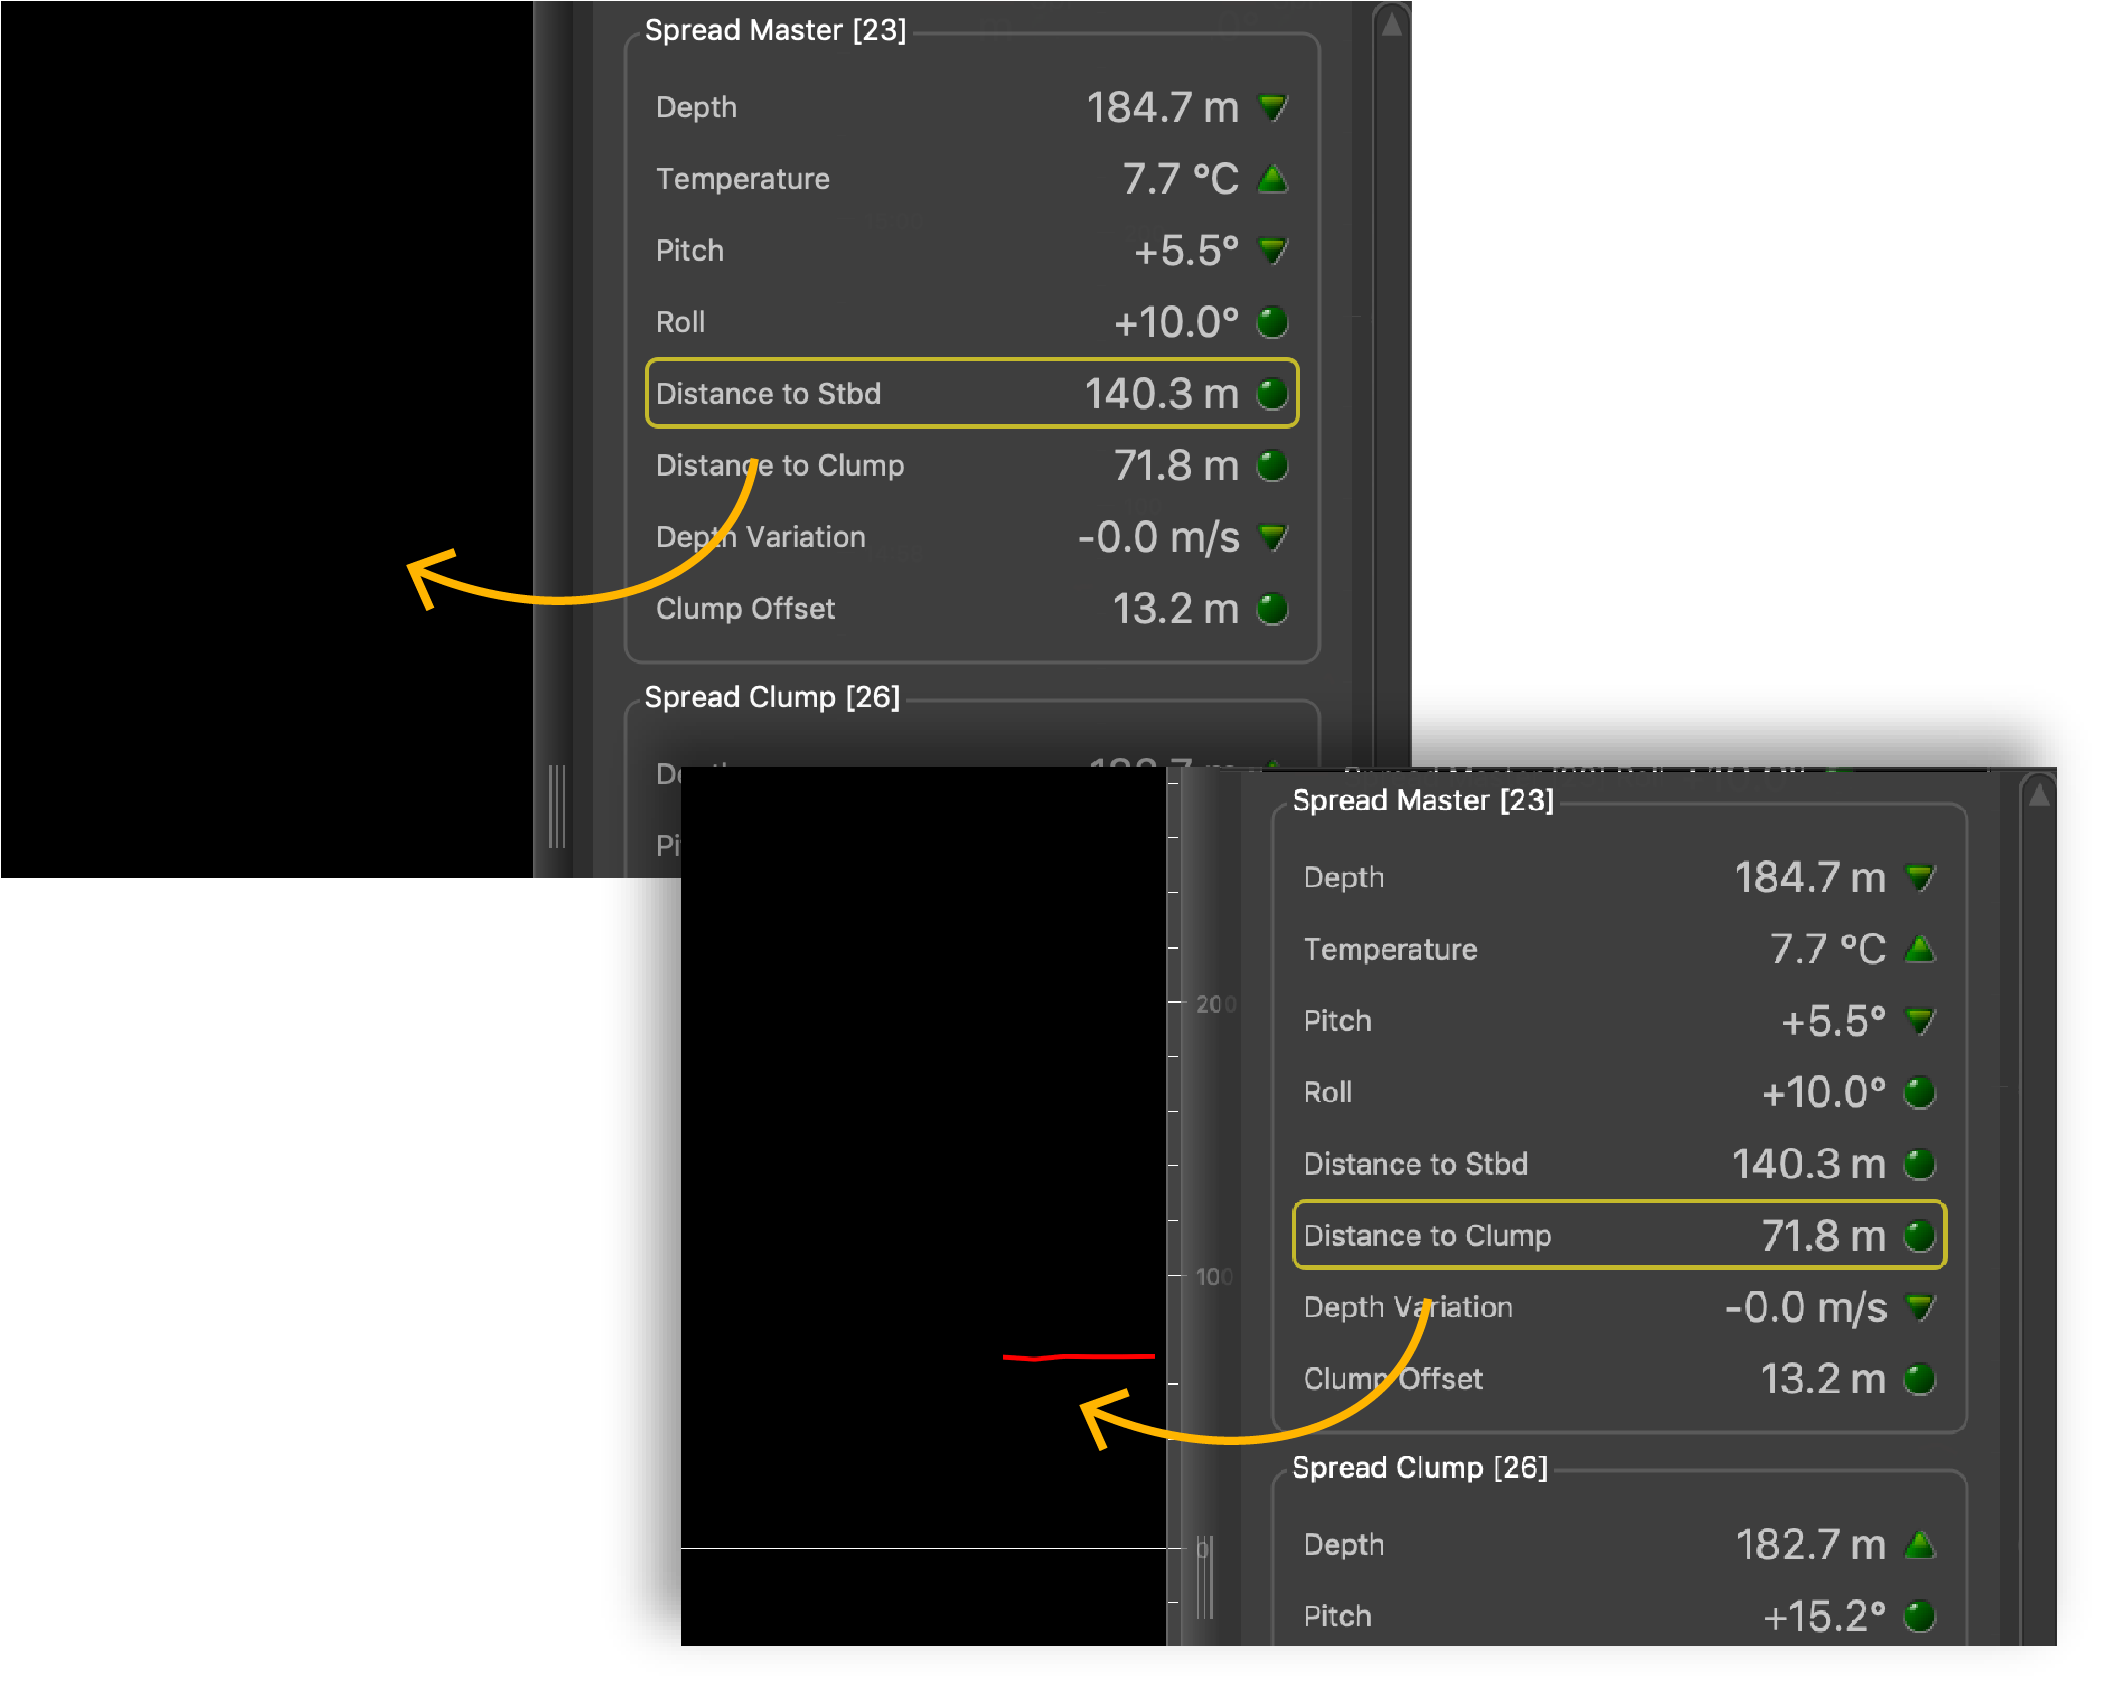
If you have twin trawls with 2 measured distances, drag to the page
the Spread Master Distance to Stbd, then
drag Distance to
Clump above the plot of the
distance to starboard. Right-click the plot and click Vertical.
 Distances between the port door and starboard door and between the port door and clump are displayed.
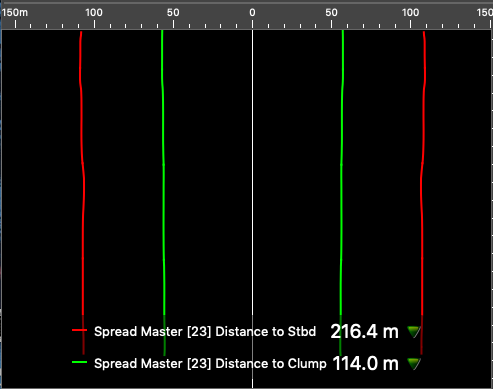
-
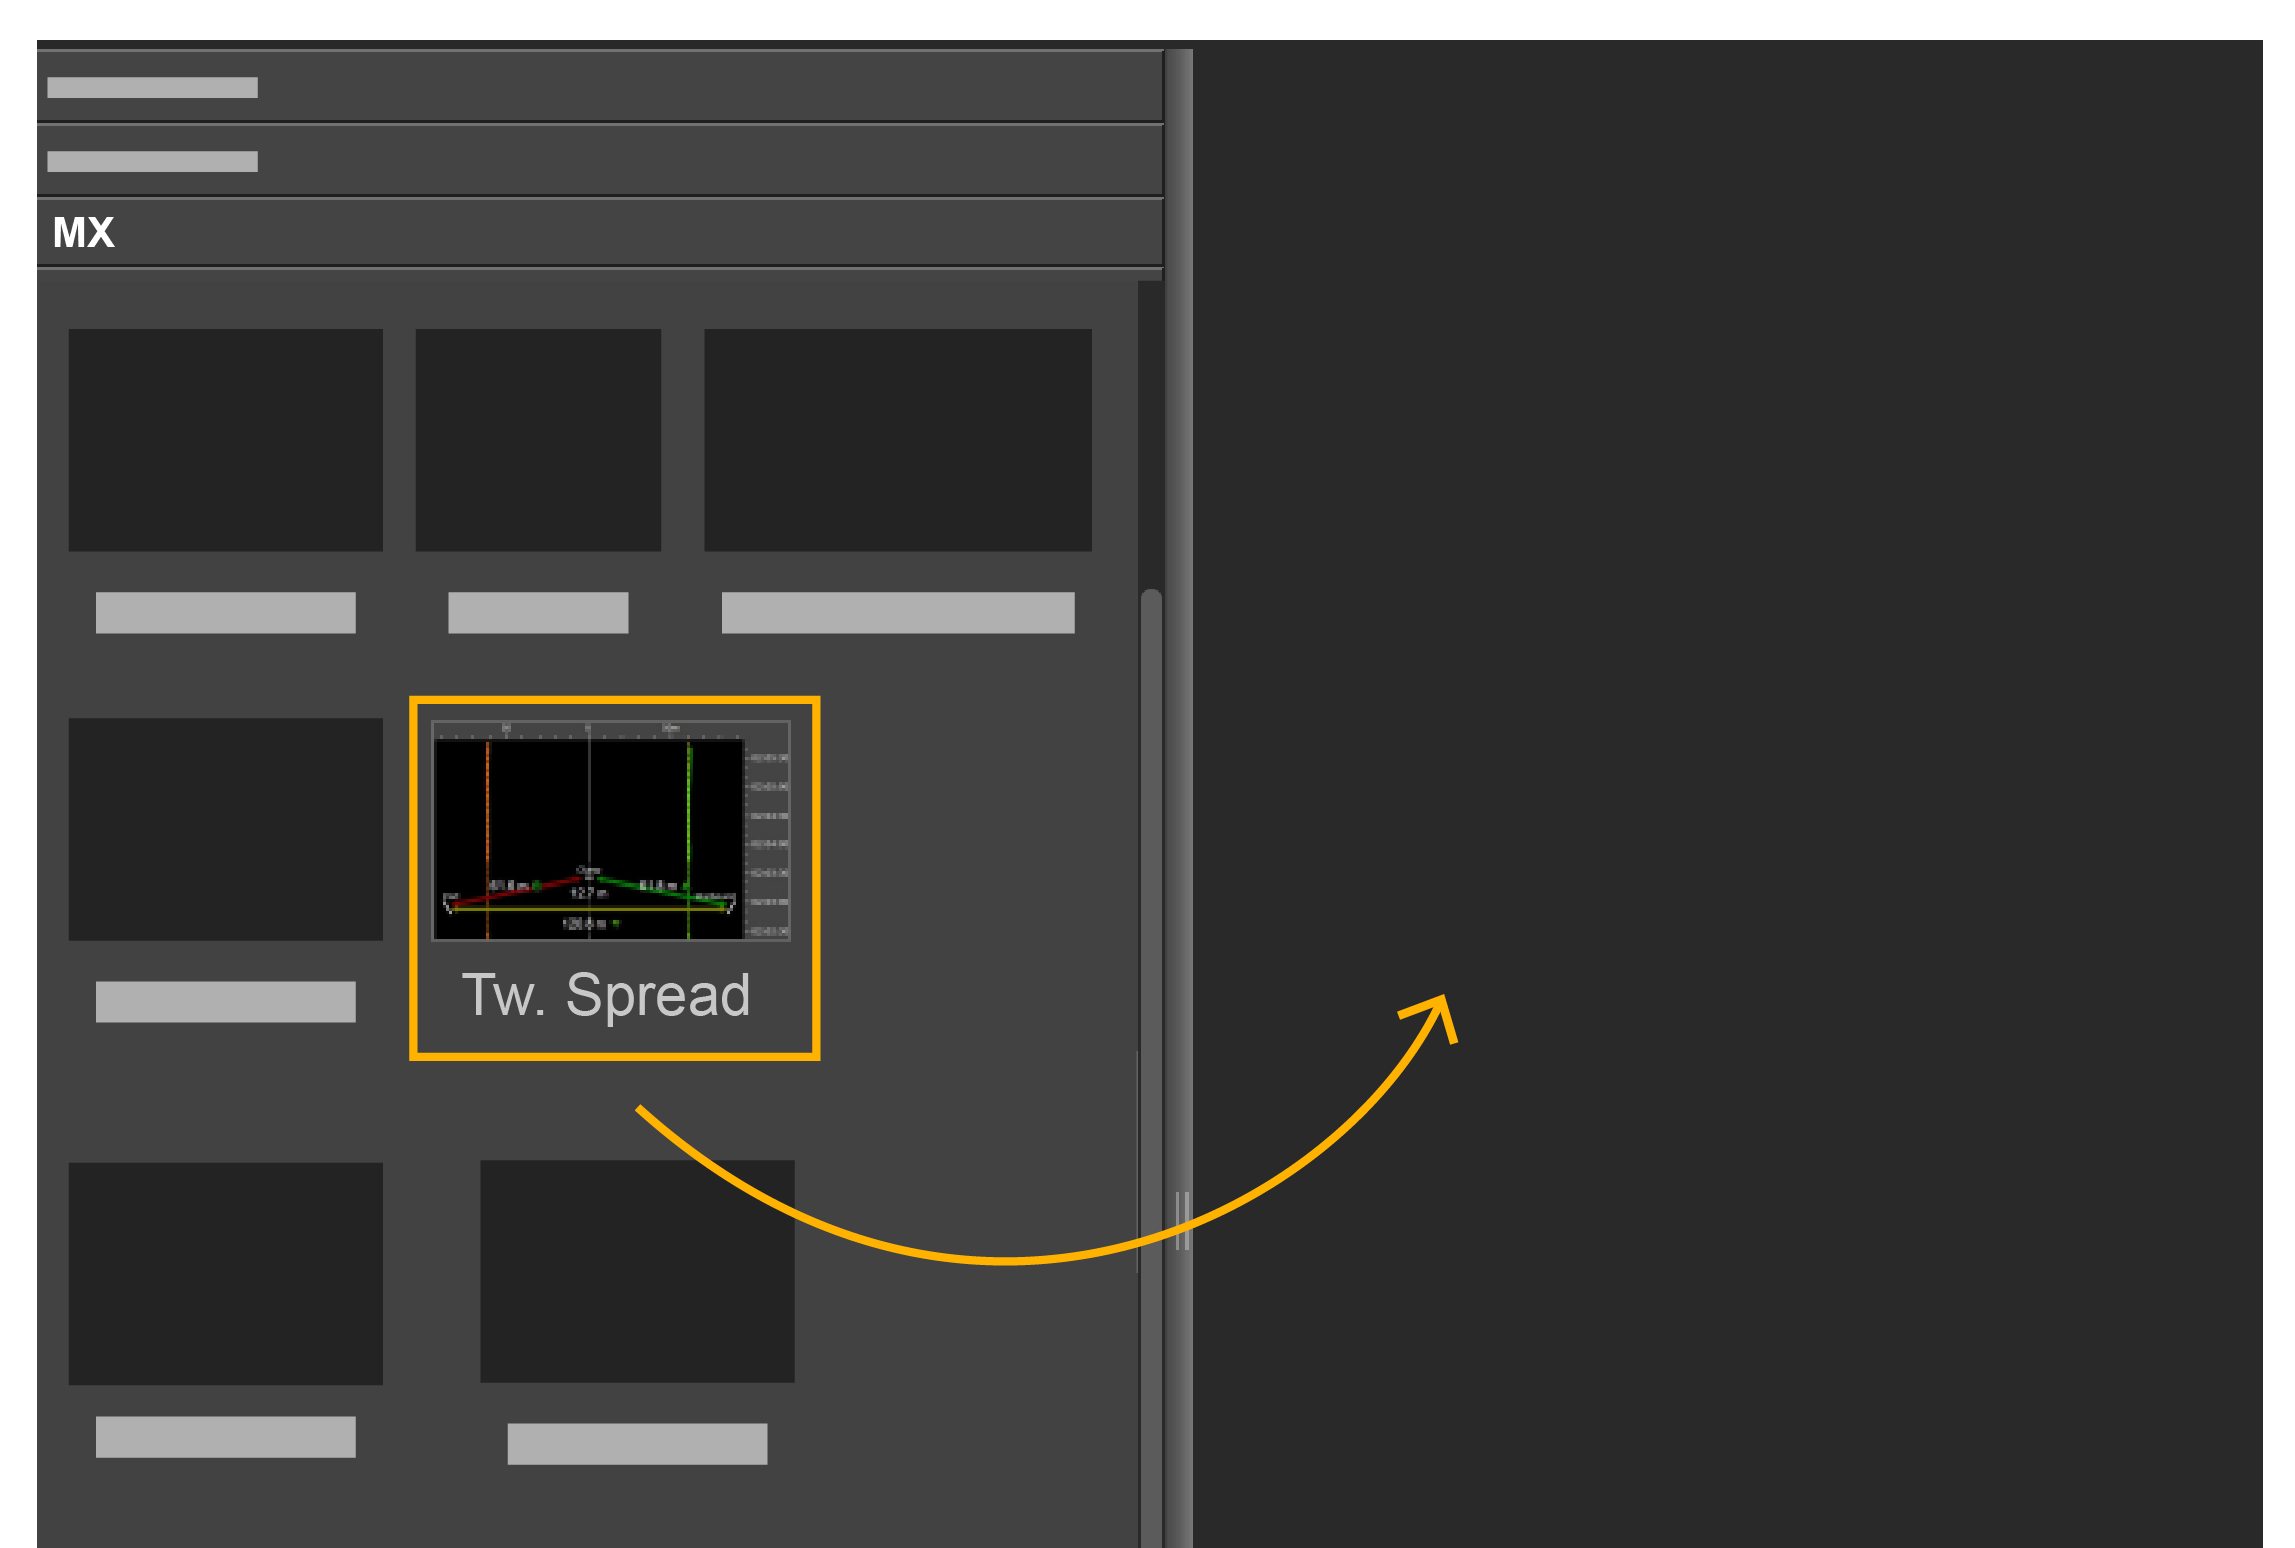
If you have twin trawls with 3
measured distances, open the Customize panel and go to the Mx tab.
- Click + drag a Twin Trawl Spread
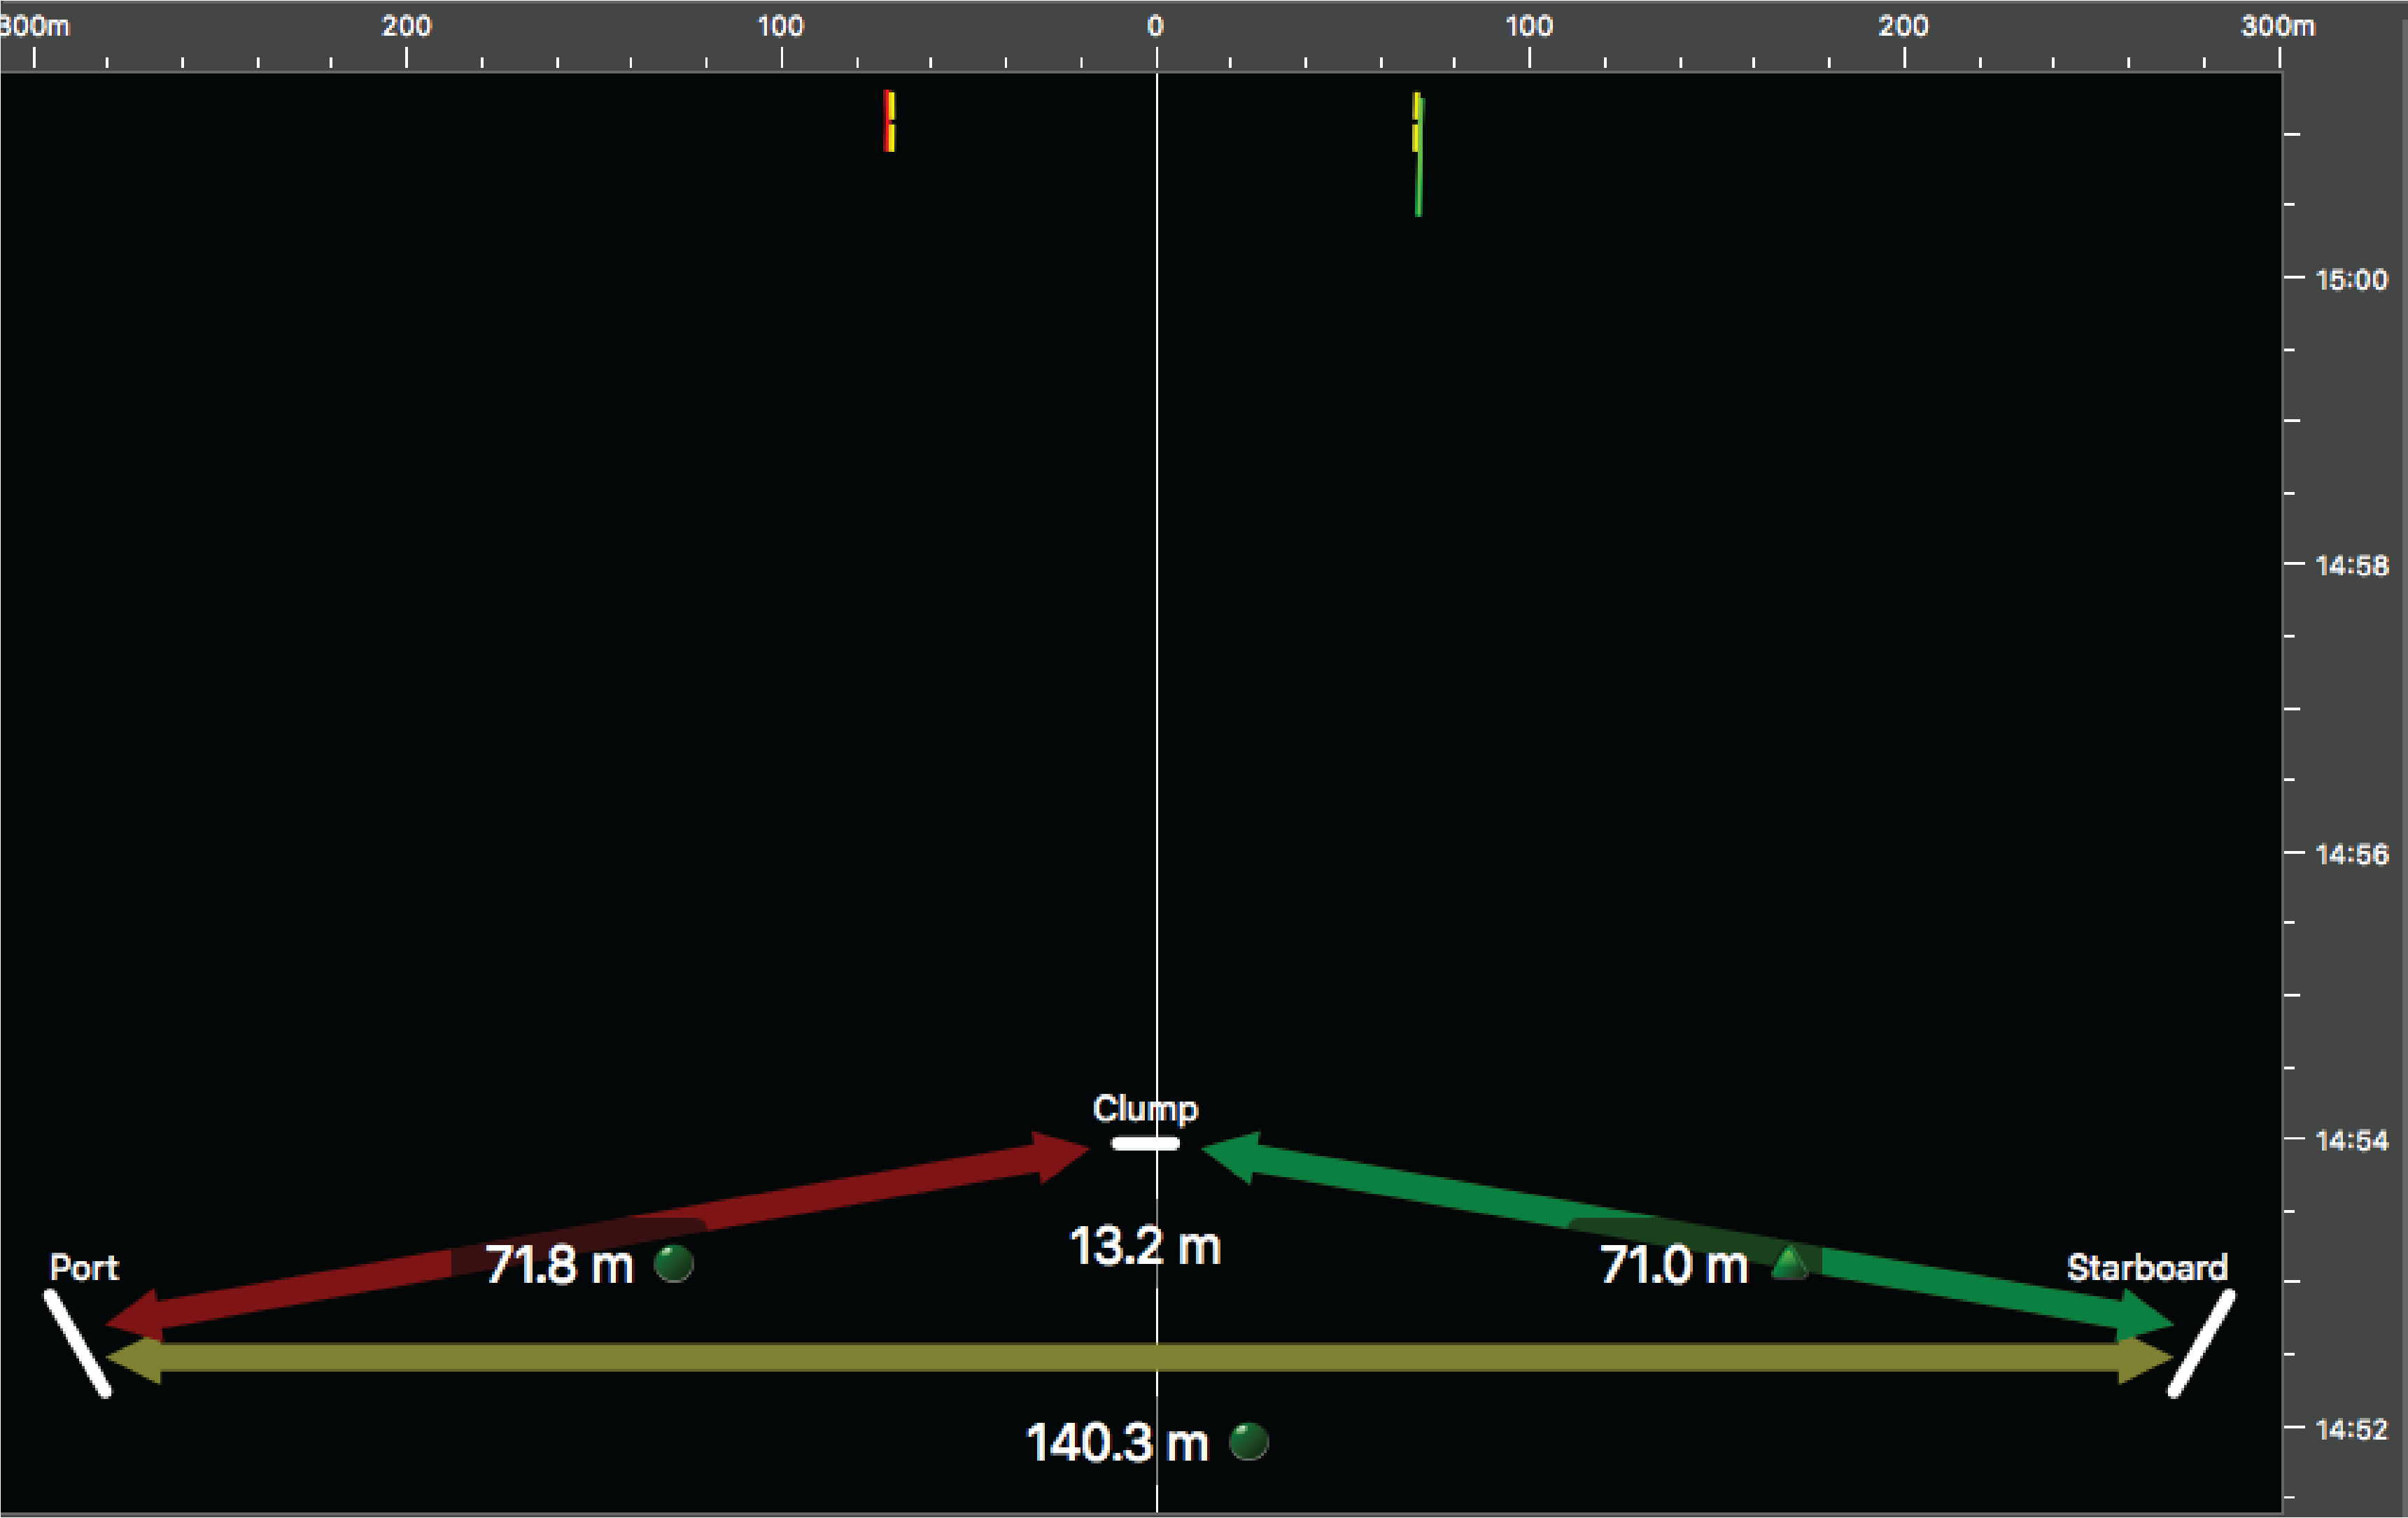
Plot to the page. You can know if the clump is centered when the yellow dashed
line is above the red and green lines.
- Or click + drag a Twin trawl Spread
Diagram to only display the
diagram.
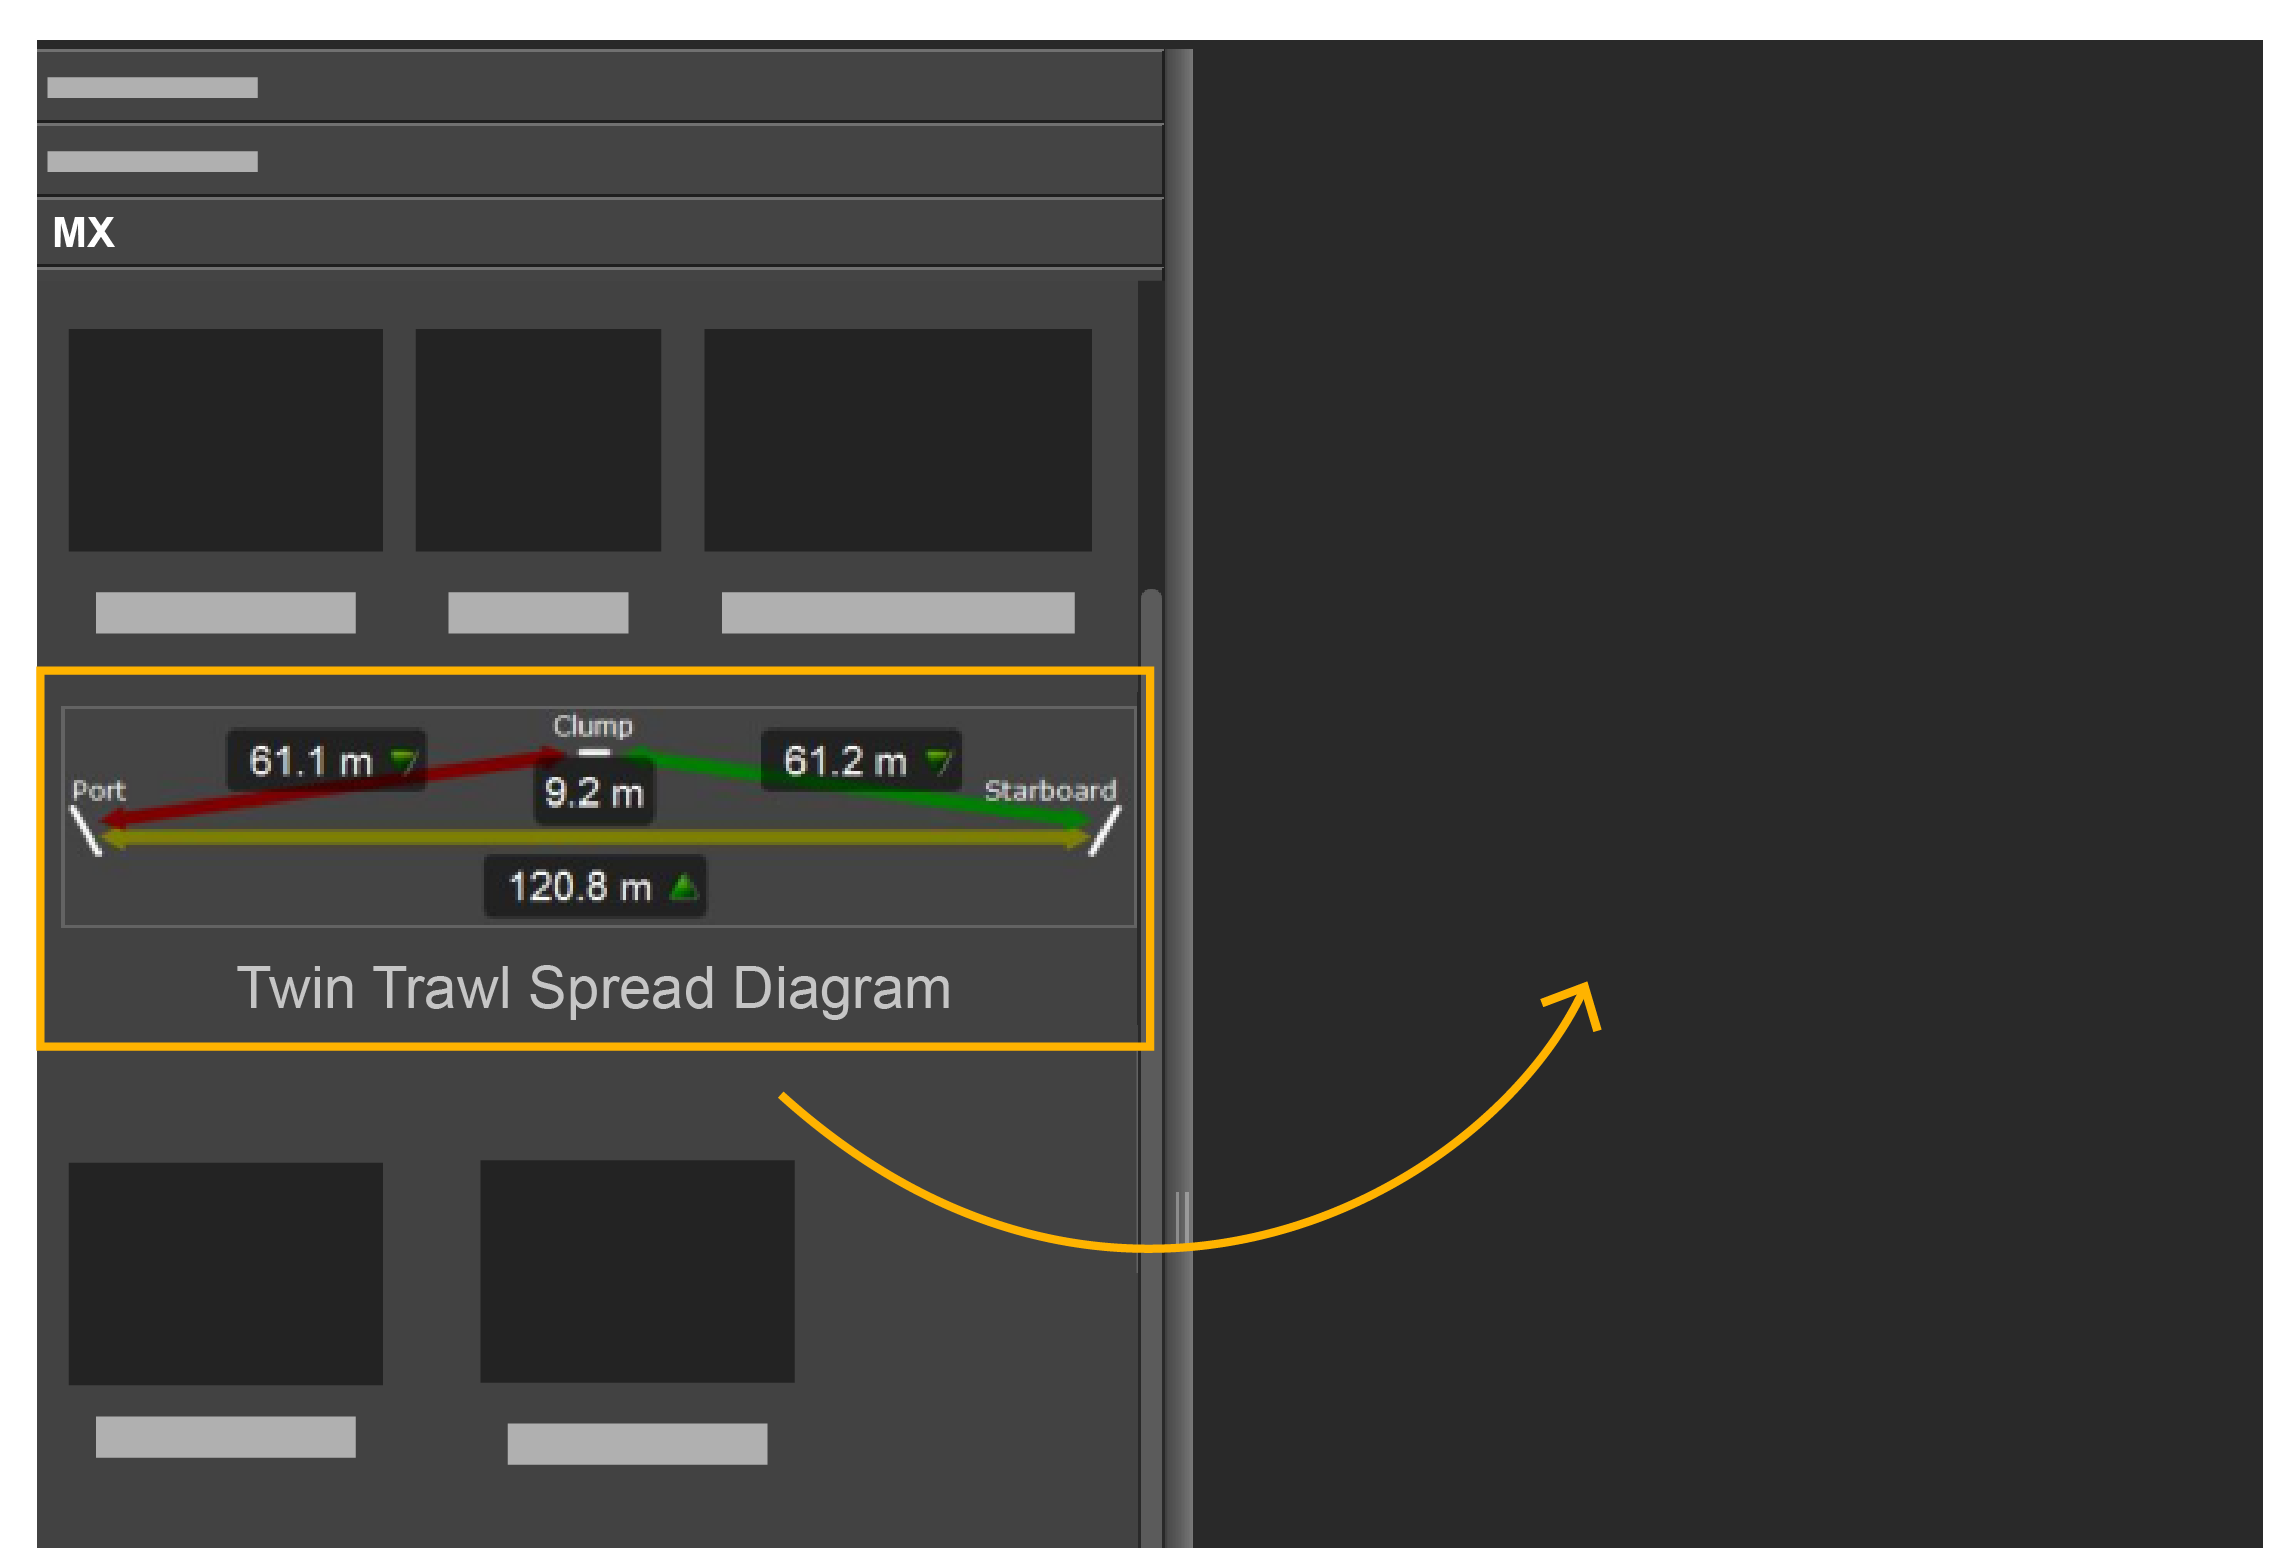

Now you can see the distances between:- port door and starboard door,
- port door and clump,
- clump and starboard door.
Note: Right-click the plot and click Single Trawl Spread Plot if you need to switch to single trawl. - Click + drag a Twin Trawl Spread
Plot to the page. You can know if the clump is centered when the yellow dashed
line is above the red and green lines.
What to do next
Displaying the Chart View
Before you begin
- You must be in Customize mode to do this task.
You must have:
- Incoming GPS data and heading data.
- Spread or Slant Range sensors with bearing measurement
- Warp lengths or Slant Range sensors giving distance to vessel
Procedure
- Open the customization panel, then go to Geographic.
-
Click + drag Chart to the
page.
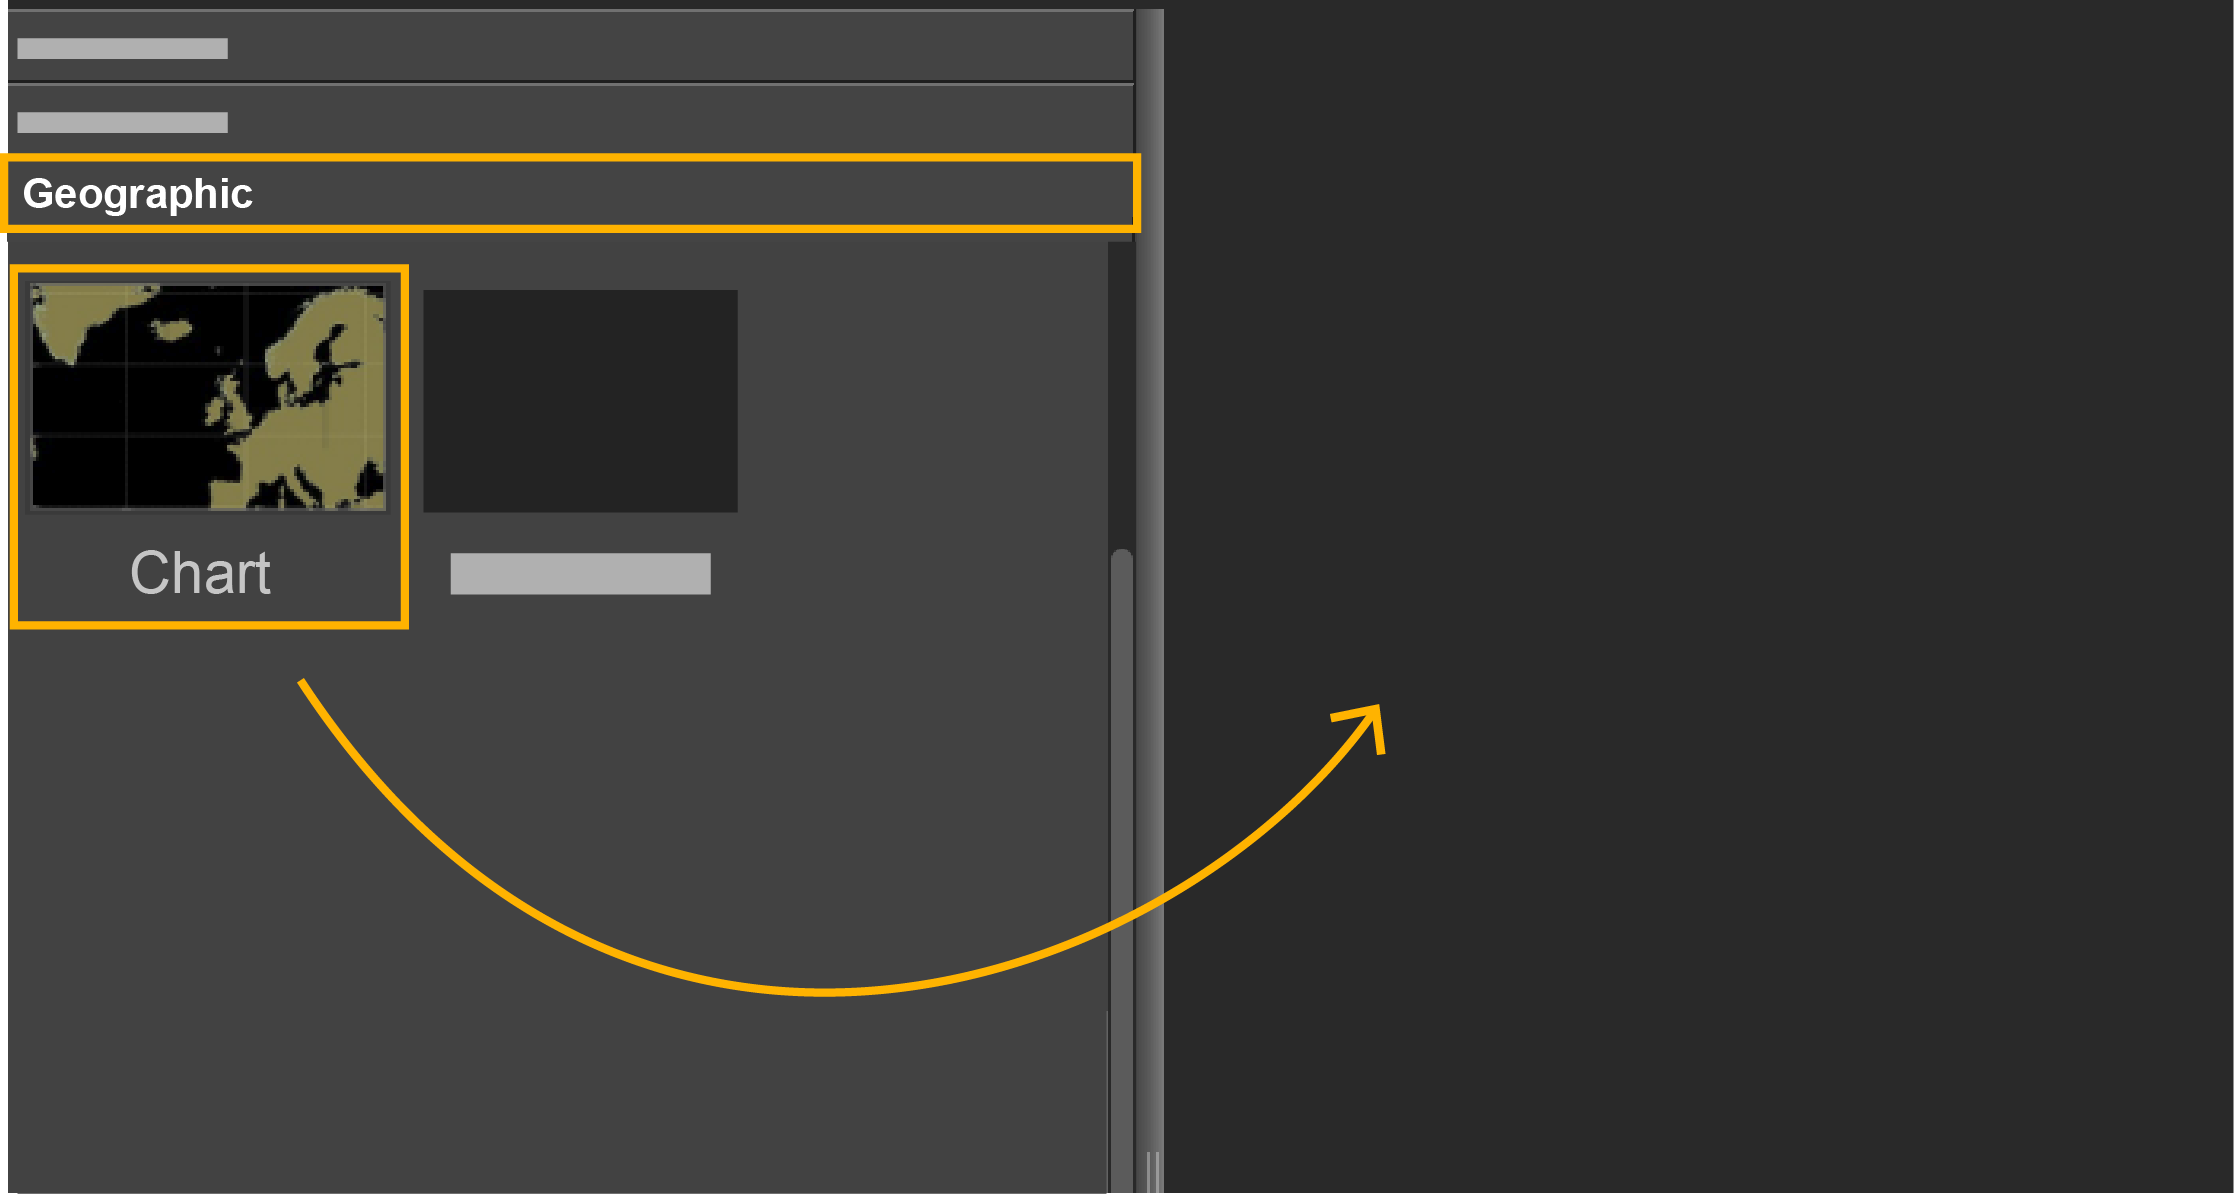
-
Drop it in a yellow area.
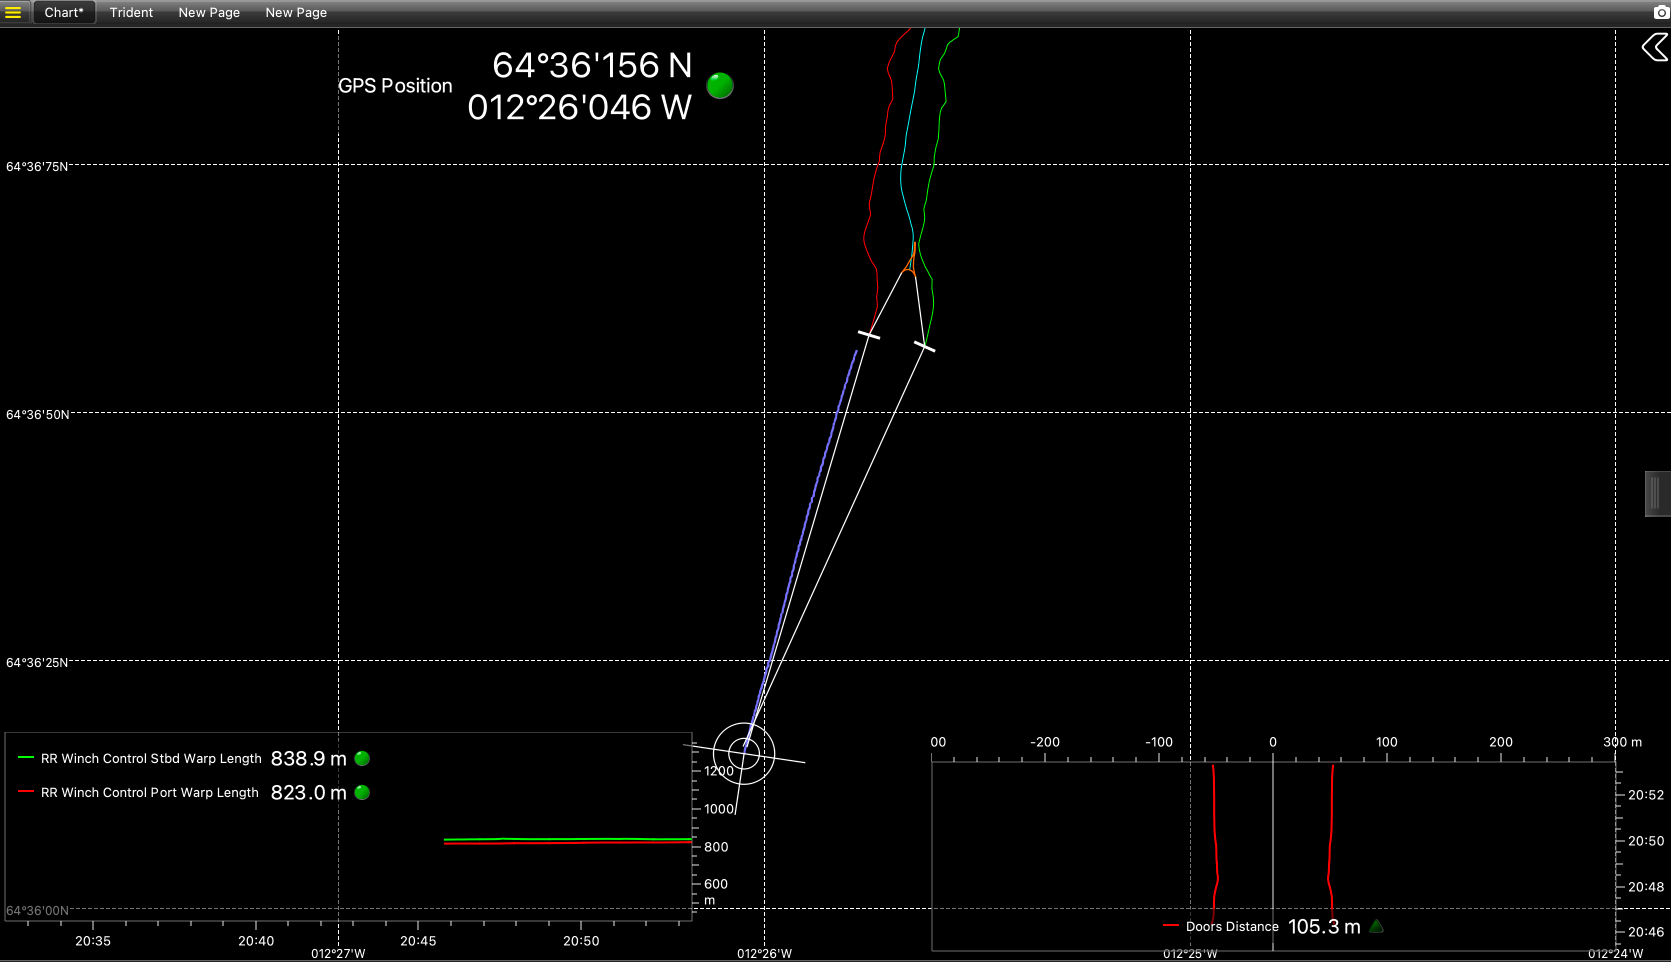
The chart view is displayed. The heading of the vessel, the port (red) and starboard (green) door paths appear by default.
-
Click the arrow on the right side of the view to show the
display options.
Trouble: If the view looks empty it might be because the view is not centered on the vessel. Open the setting menu and click or Center on Ownship and Trawl.
Displaying the Vessel 3D Overview
You can display a 3D overview of the vessel system if you have
the Scala Full
version. To know if you have the 3D enabled, check in Menu ![]() > About Scala.
> About Scala.
Before you begin
You must be in Customize mode to do this task.
You need to have incoming data from:- GPS (position, heading)
- Sensors with positioning
- Warp lengths or Slant Range sensors giving distance to vessel
Procedure
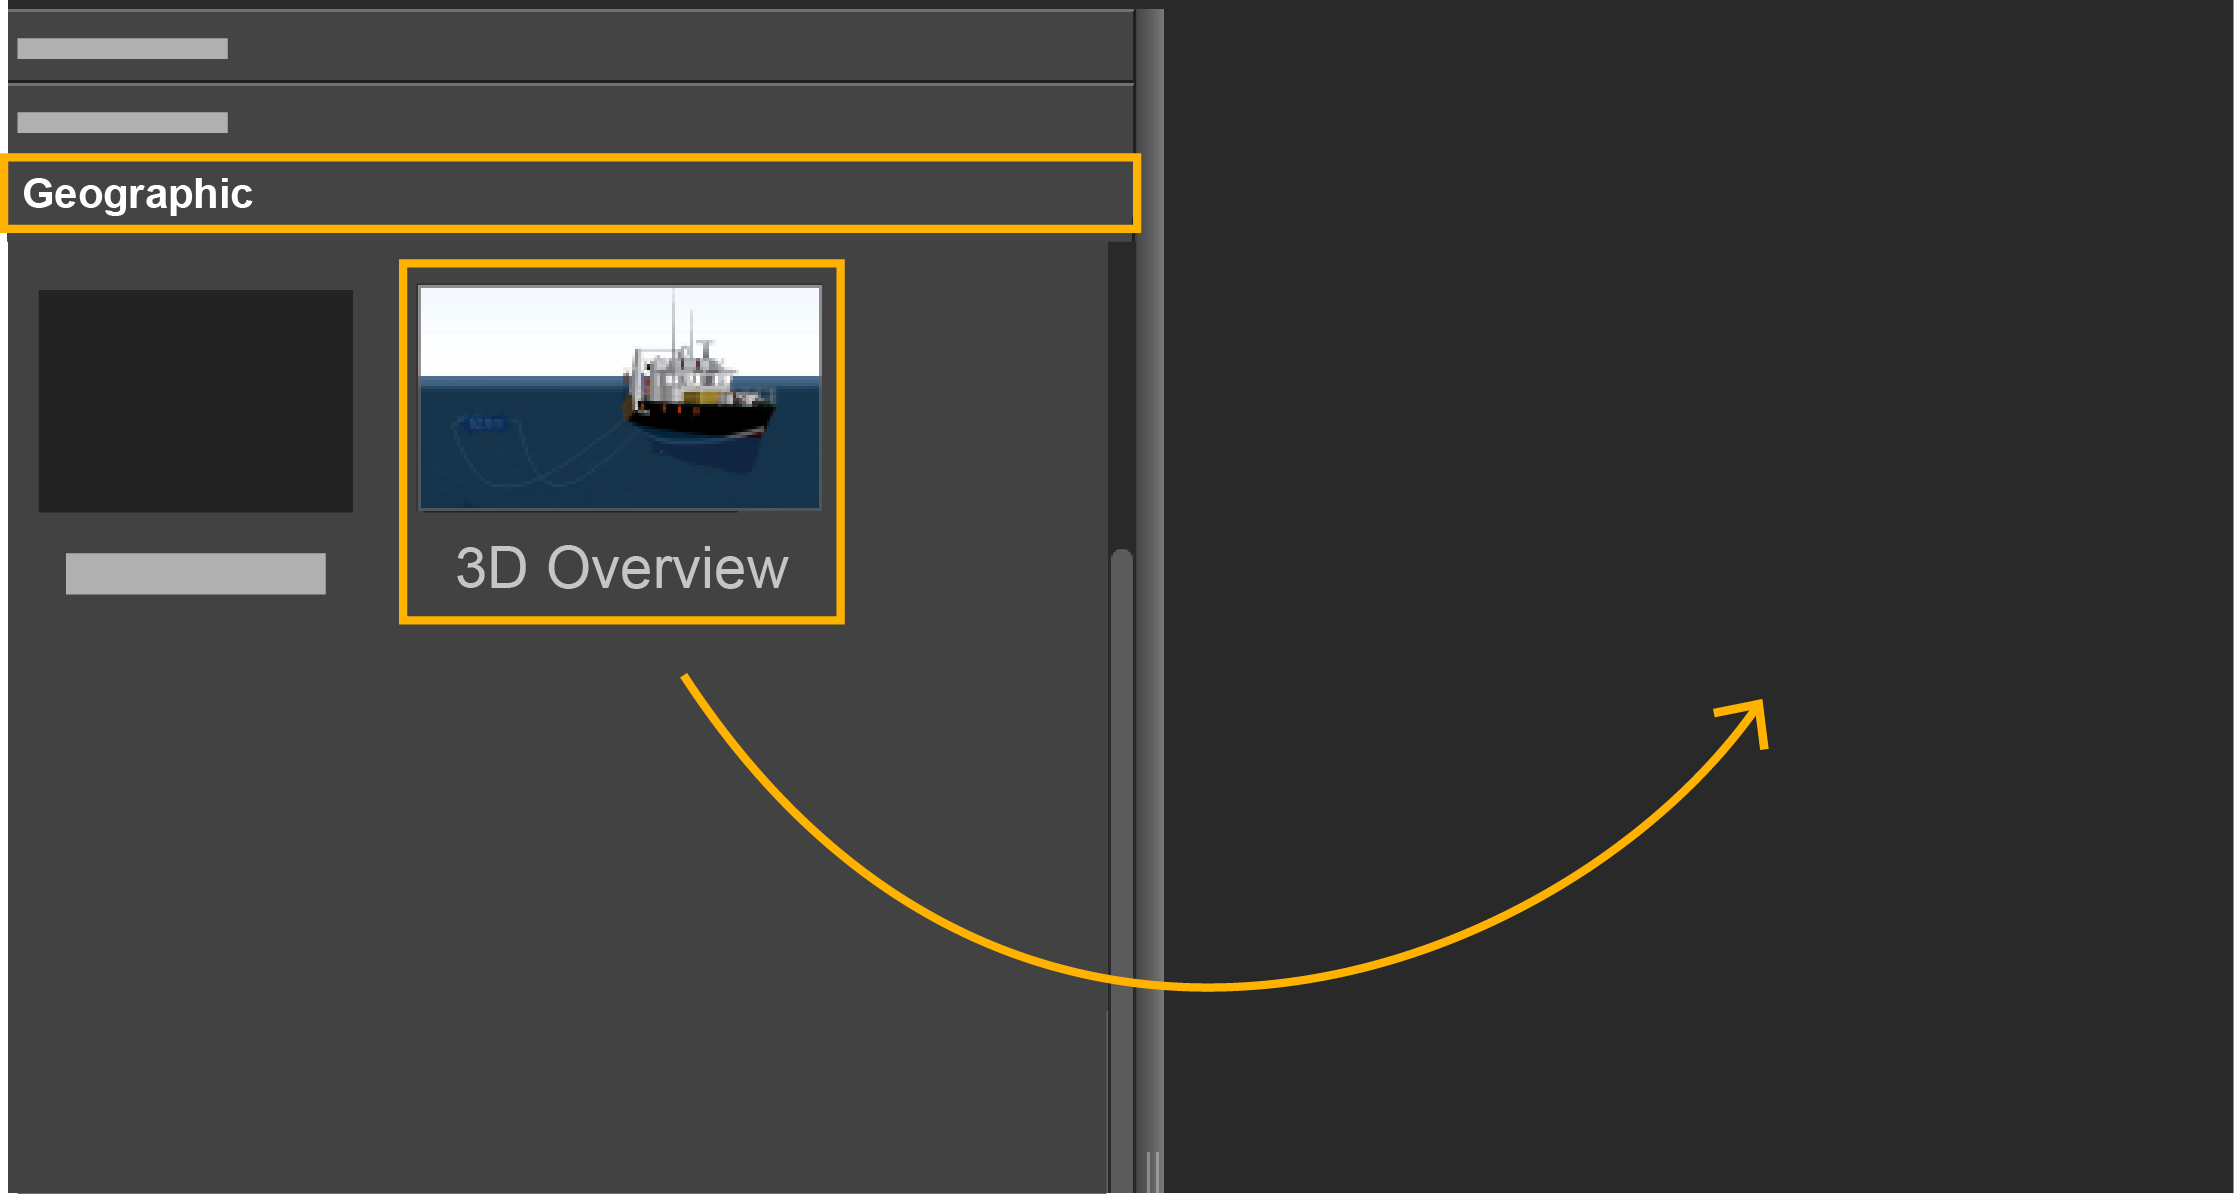
- Open the customization panel, then go to Geographic.
-
Click + drag the 3D Overview to the
page.
 A 3D view of the vessel and trawl is displayed.
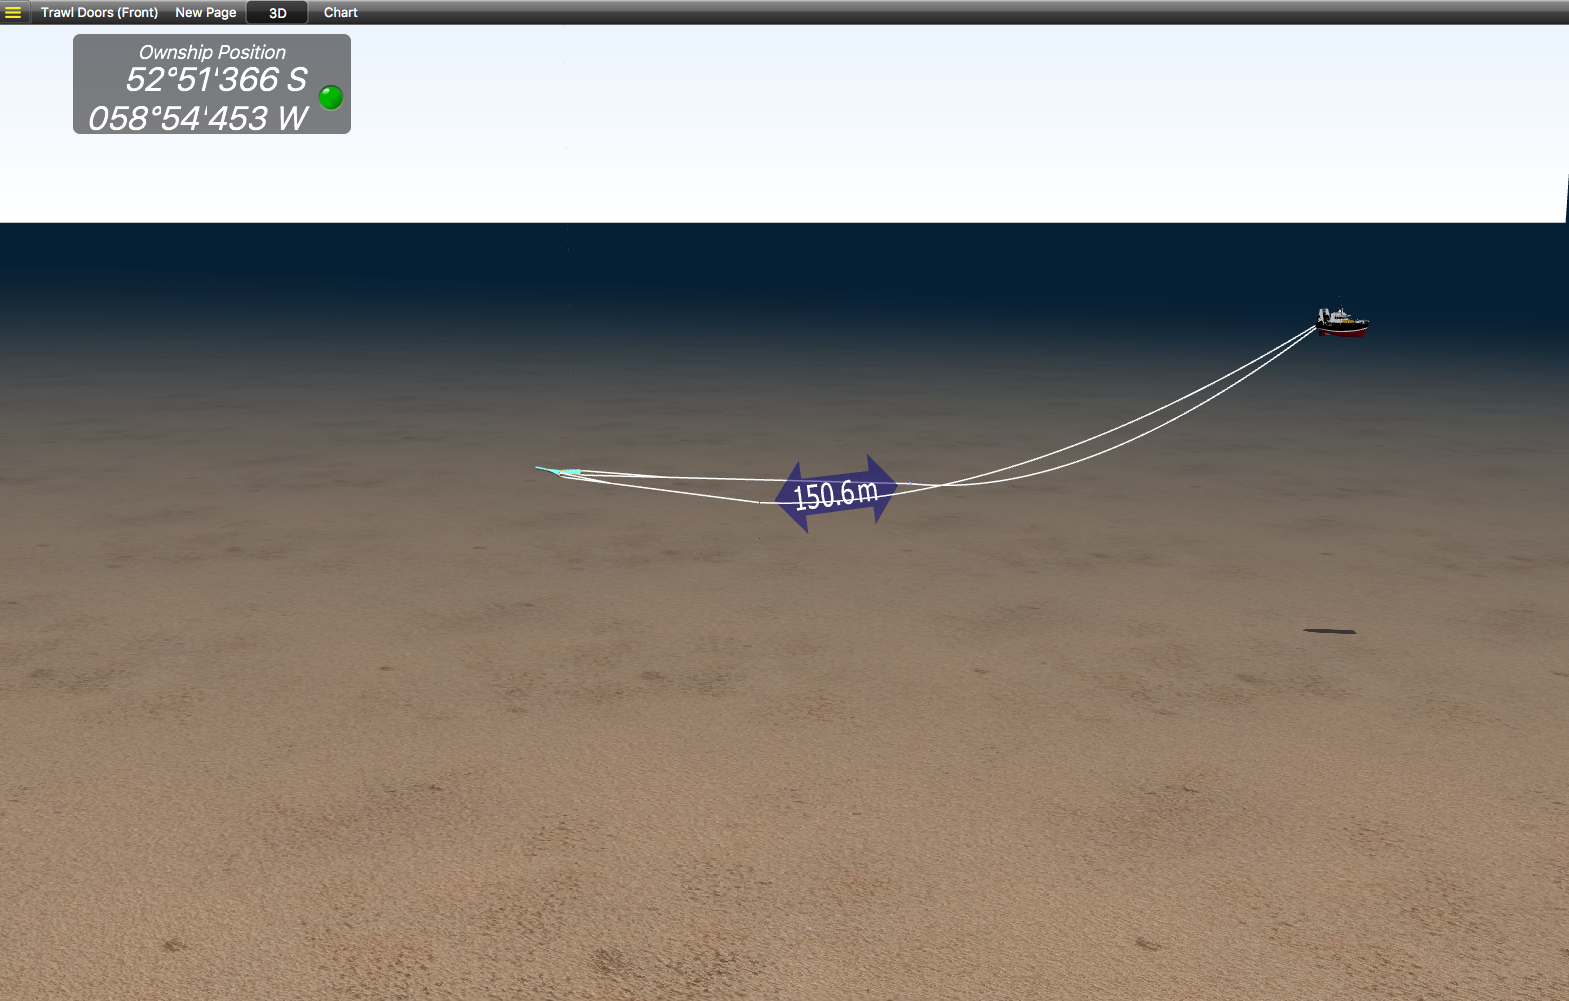 If you have twin trawls, you can see
it on the 3D view as well. Make sure you have configured twin trawls in the
receiver settings.
If you have twin trawls, you can see
it on the 3D view as well. Make sure you have configured twin trawls in the
receiver settings.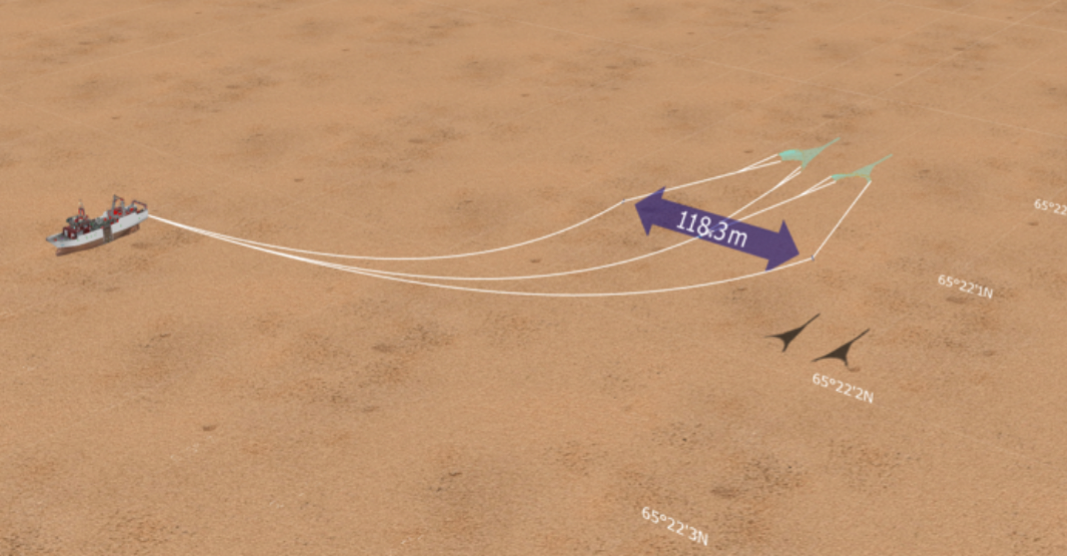
-
To change the vessel 3D model, from the upper left corner of the screen
click
Menu > Settings and click the Ownship tab.
- To change the view, you can use the numeric keypad: press the keys 0 to 9 to change the viewing angle.
- Right-click the 3D view and click Center on Ownship to focus on the vessel or Center on Trawl to focus on the trawl.
What to do next
Doors Positioning Data
You can display data related to the position of the doors.
Before you begin
Note: Minimum data required to display
Doors Positioning are
GPS positioning, depth, door spread distance, port and
starboard door bearings. However, we strongly recommend to receive warp lengths from a winch control
system. Without it, the accuracy of the positioning will be
reduced.
Procedure
In the control panels, go to the trawl data. In Scala2, the name of the panel depends on the
trawl gear setup. The panel can display Single Trawl, Twin Trawl, Triple Trawl or Quad Trawl.
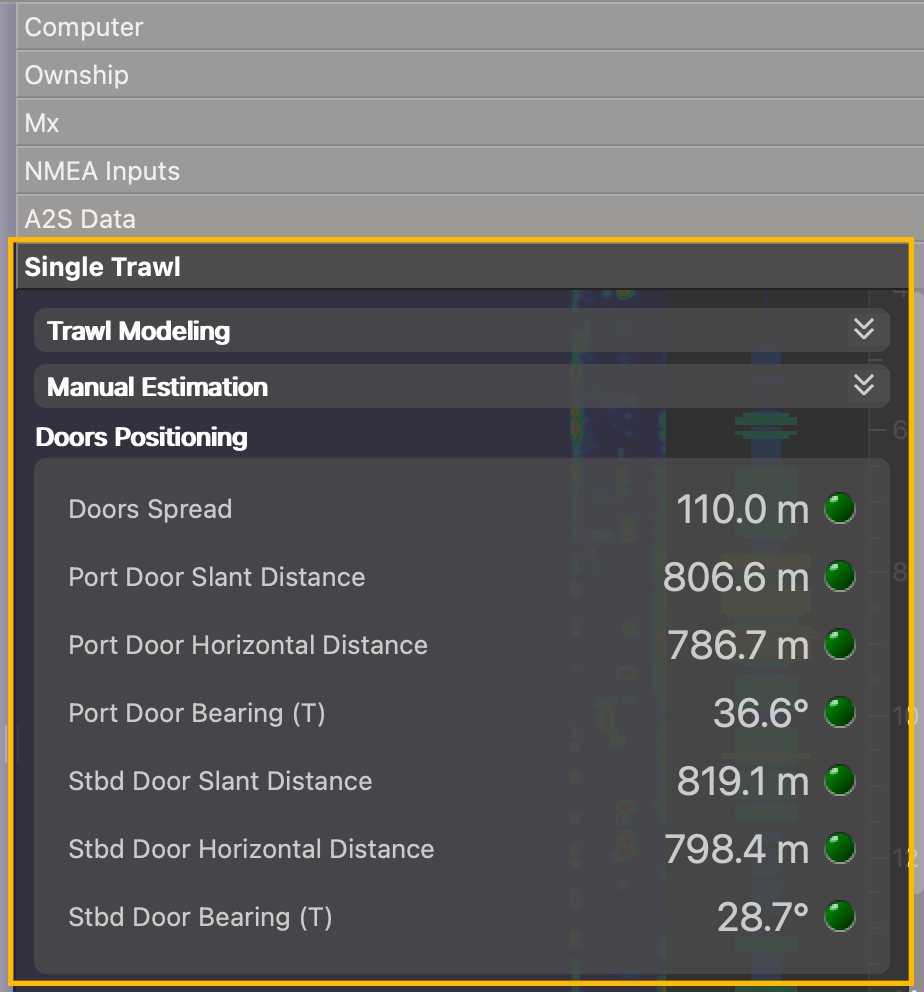
Tip: This panel displays the door horizontal distance (1)
and slant distance (2) to the boat: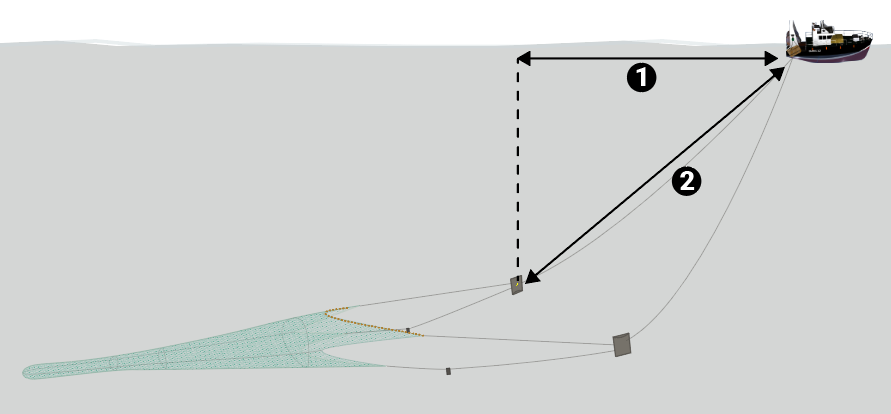
Bearing Angles
Procedure
You can see the relative (R) bearing angles of the doors. Angles are
relative to the stern, unlike Scala version
01.06.34 and below, where angles were relative to the heading of the vessel.
Angles toward port side are negative and angles toward starboard side are
positive. See About Trawl Positioning for drawings.