Displaying Catch Monitoring
You can be alerted when the codend is full.
Before you begin
Procedure
-
Open the control panels and drag Catch data
to a page.
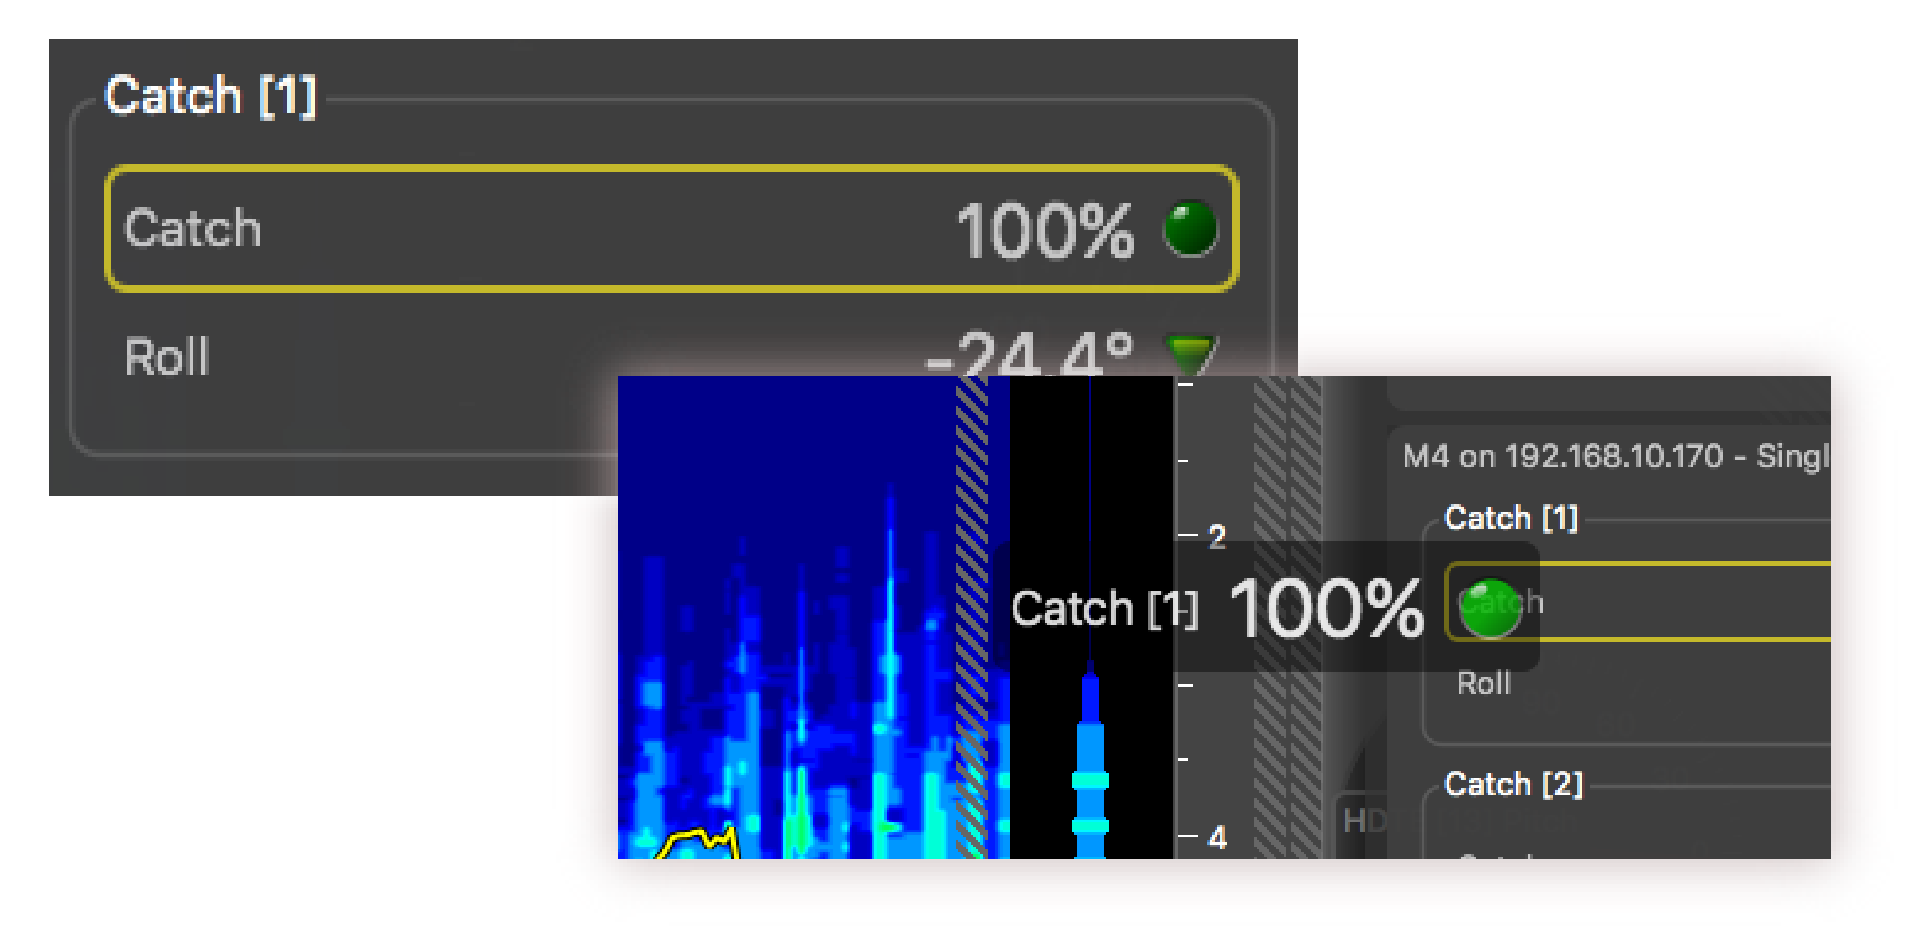
- In the Choose new Gauge Type dialog box, select History Plot.
Results
When there is no catch the history plot is: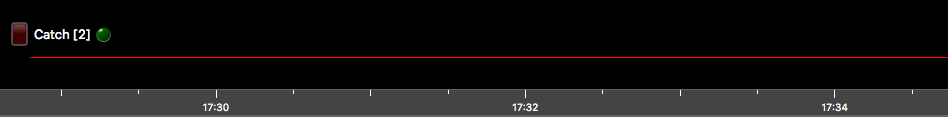
When the codend is full: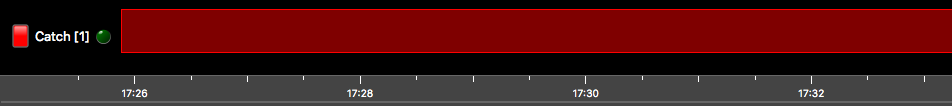
What to do next
 > Customize again.