Displaying the Chart View
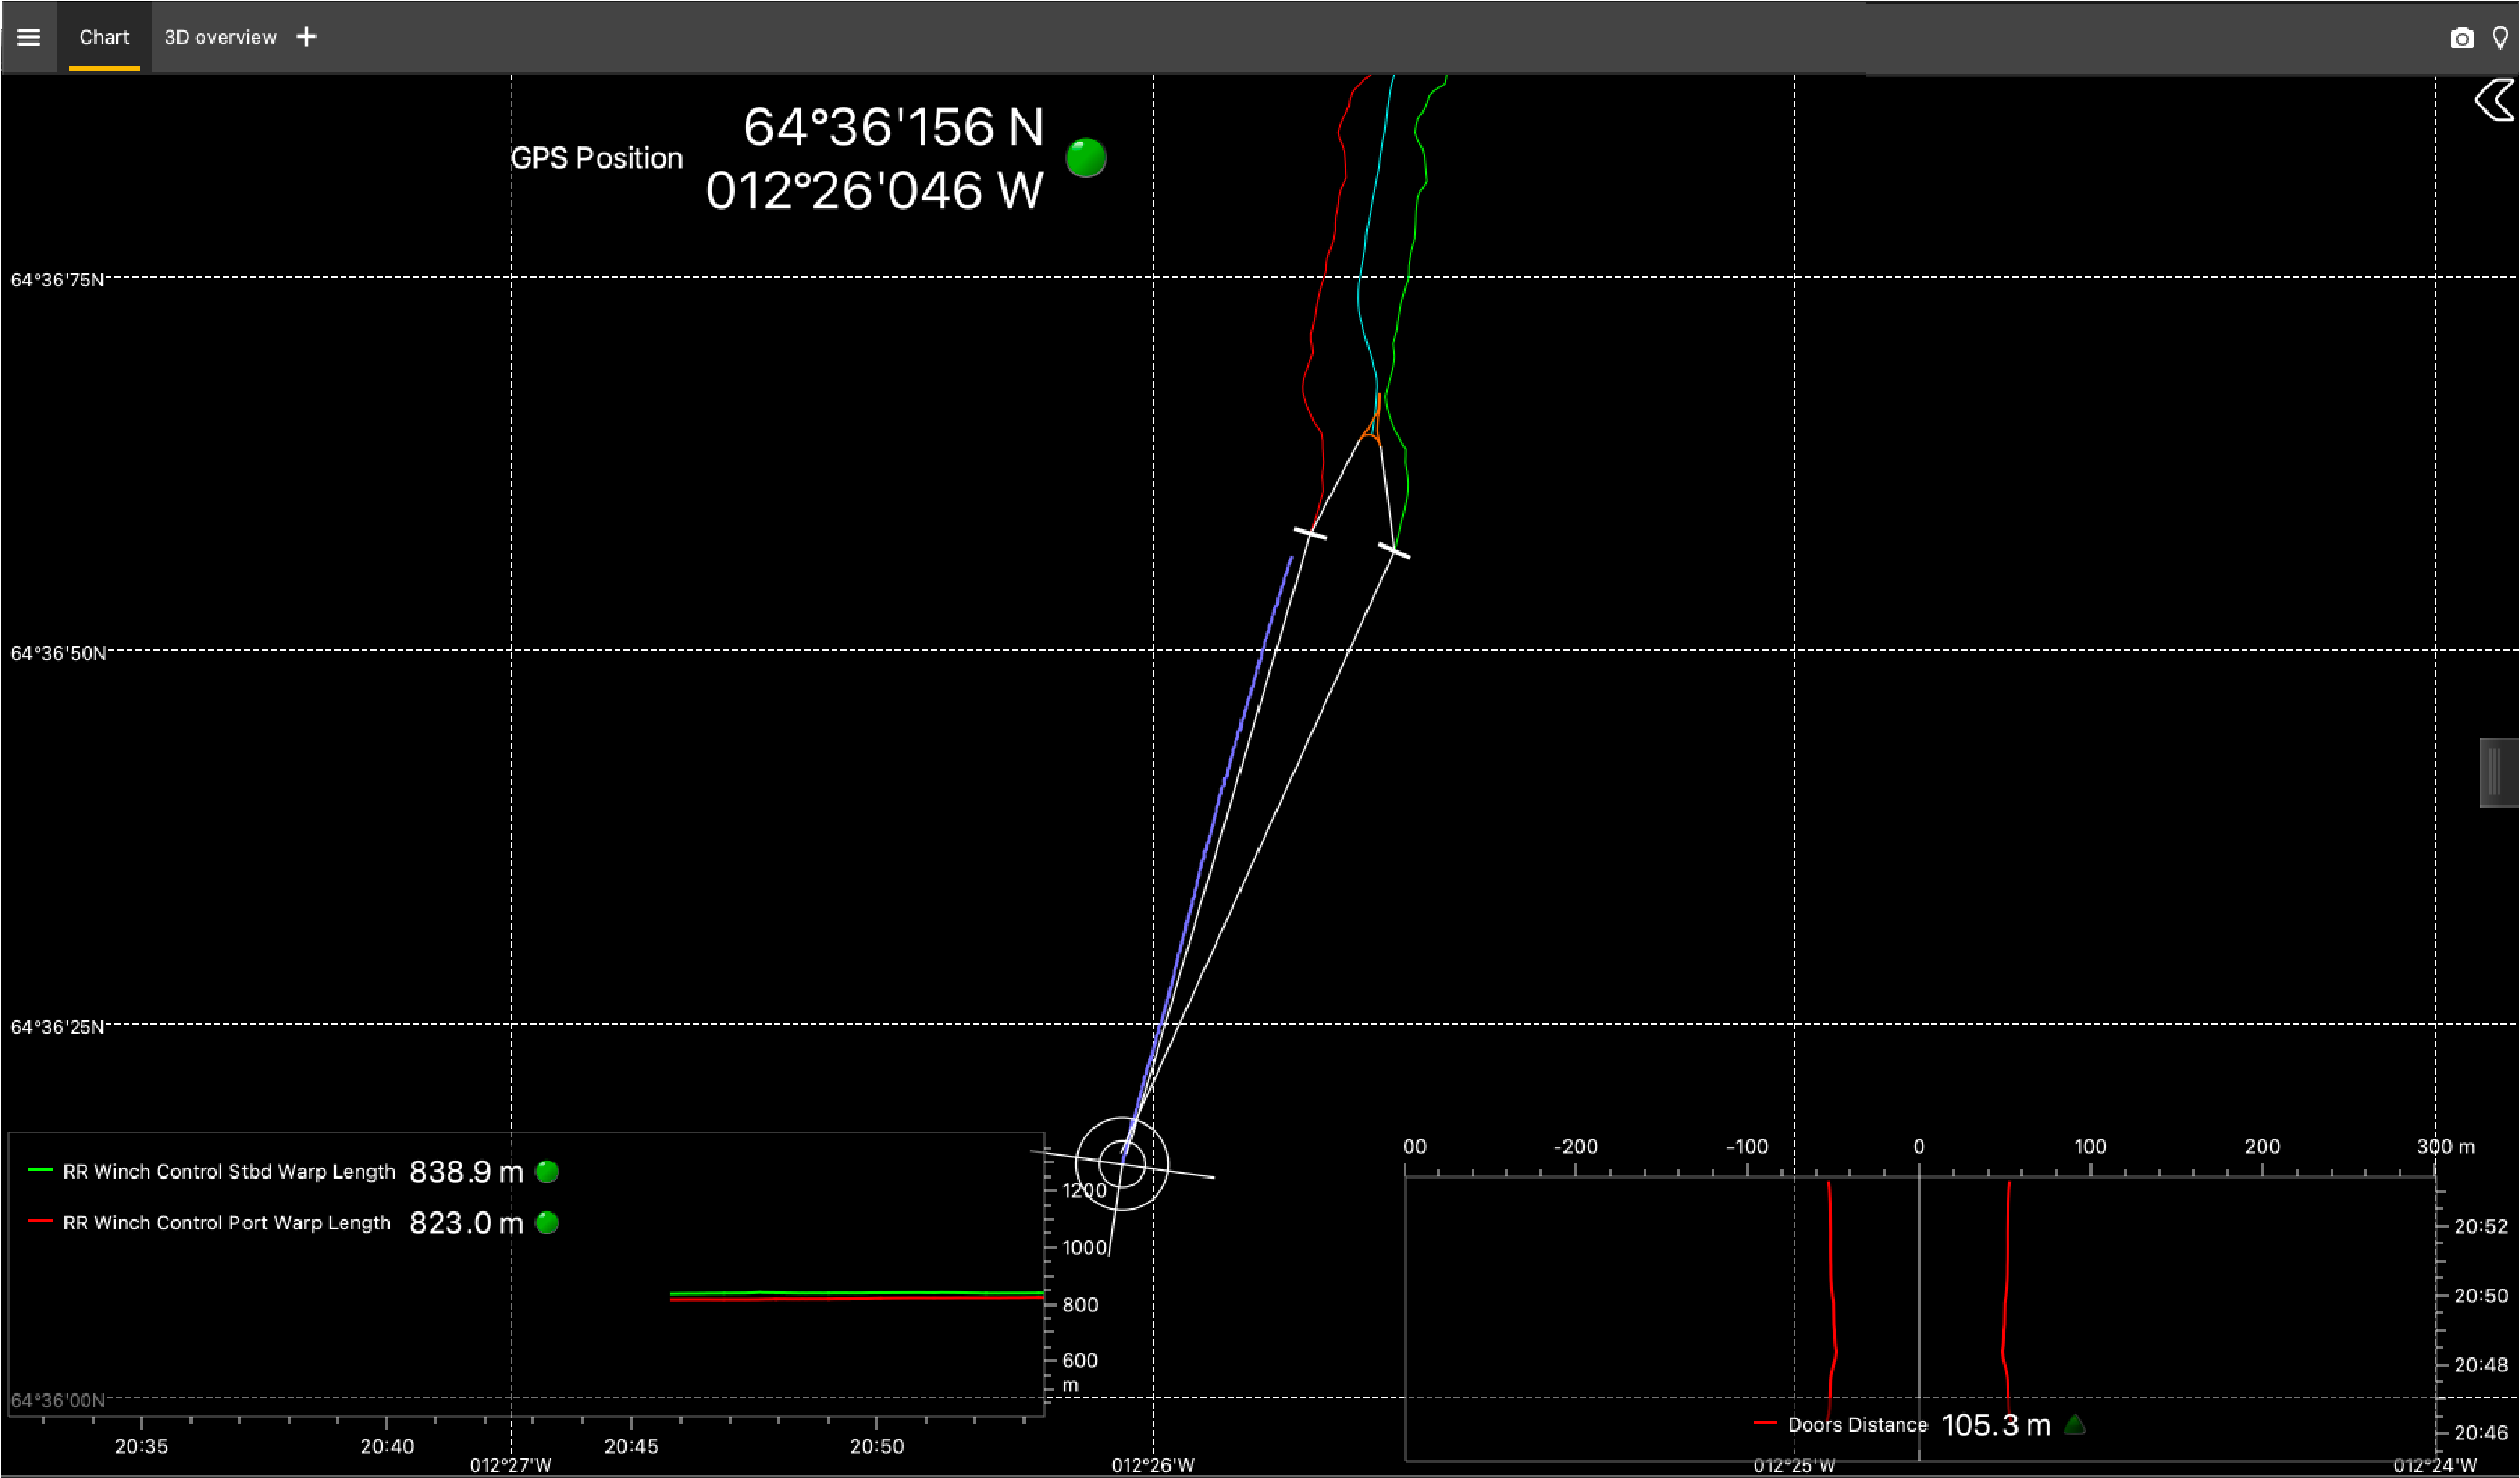
You can display the location and trajectory of the trawl behind the vessel if you receive GPS data and have door positioning sensors.
Before you begin
- You must be in Customize mode to do this task.
You must have:
- Incoming GPS data and heading data.
- Spread or Slant Range sensors with bearing measurement
- Warp lengths or Slant Range sensors giving distance to vessel
Procedure
- Open the customization panel, then go to Geographic.
-
Click + drag Chart to the page.
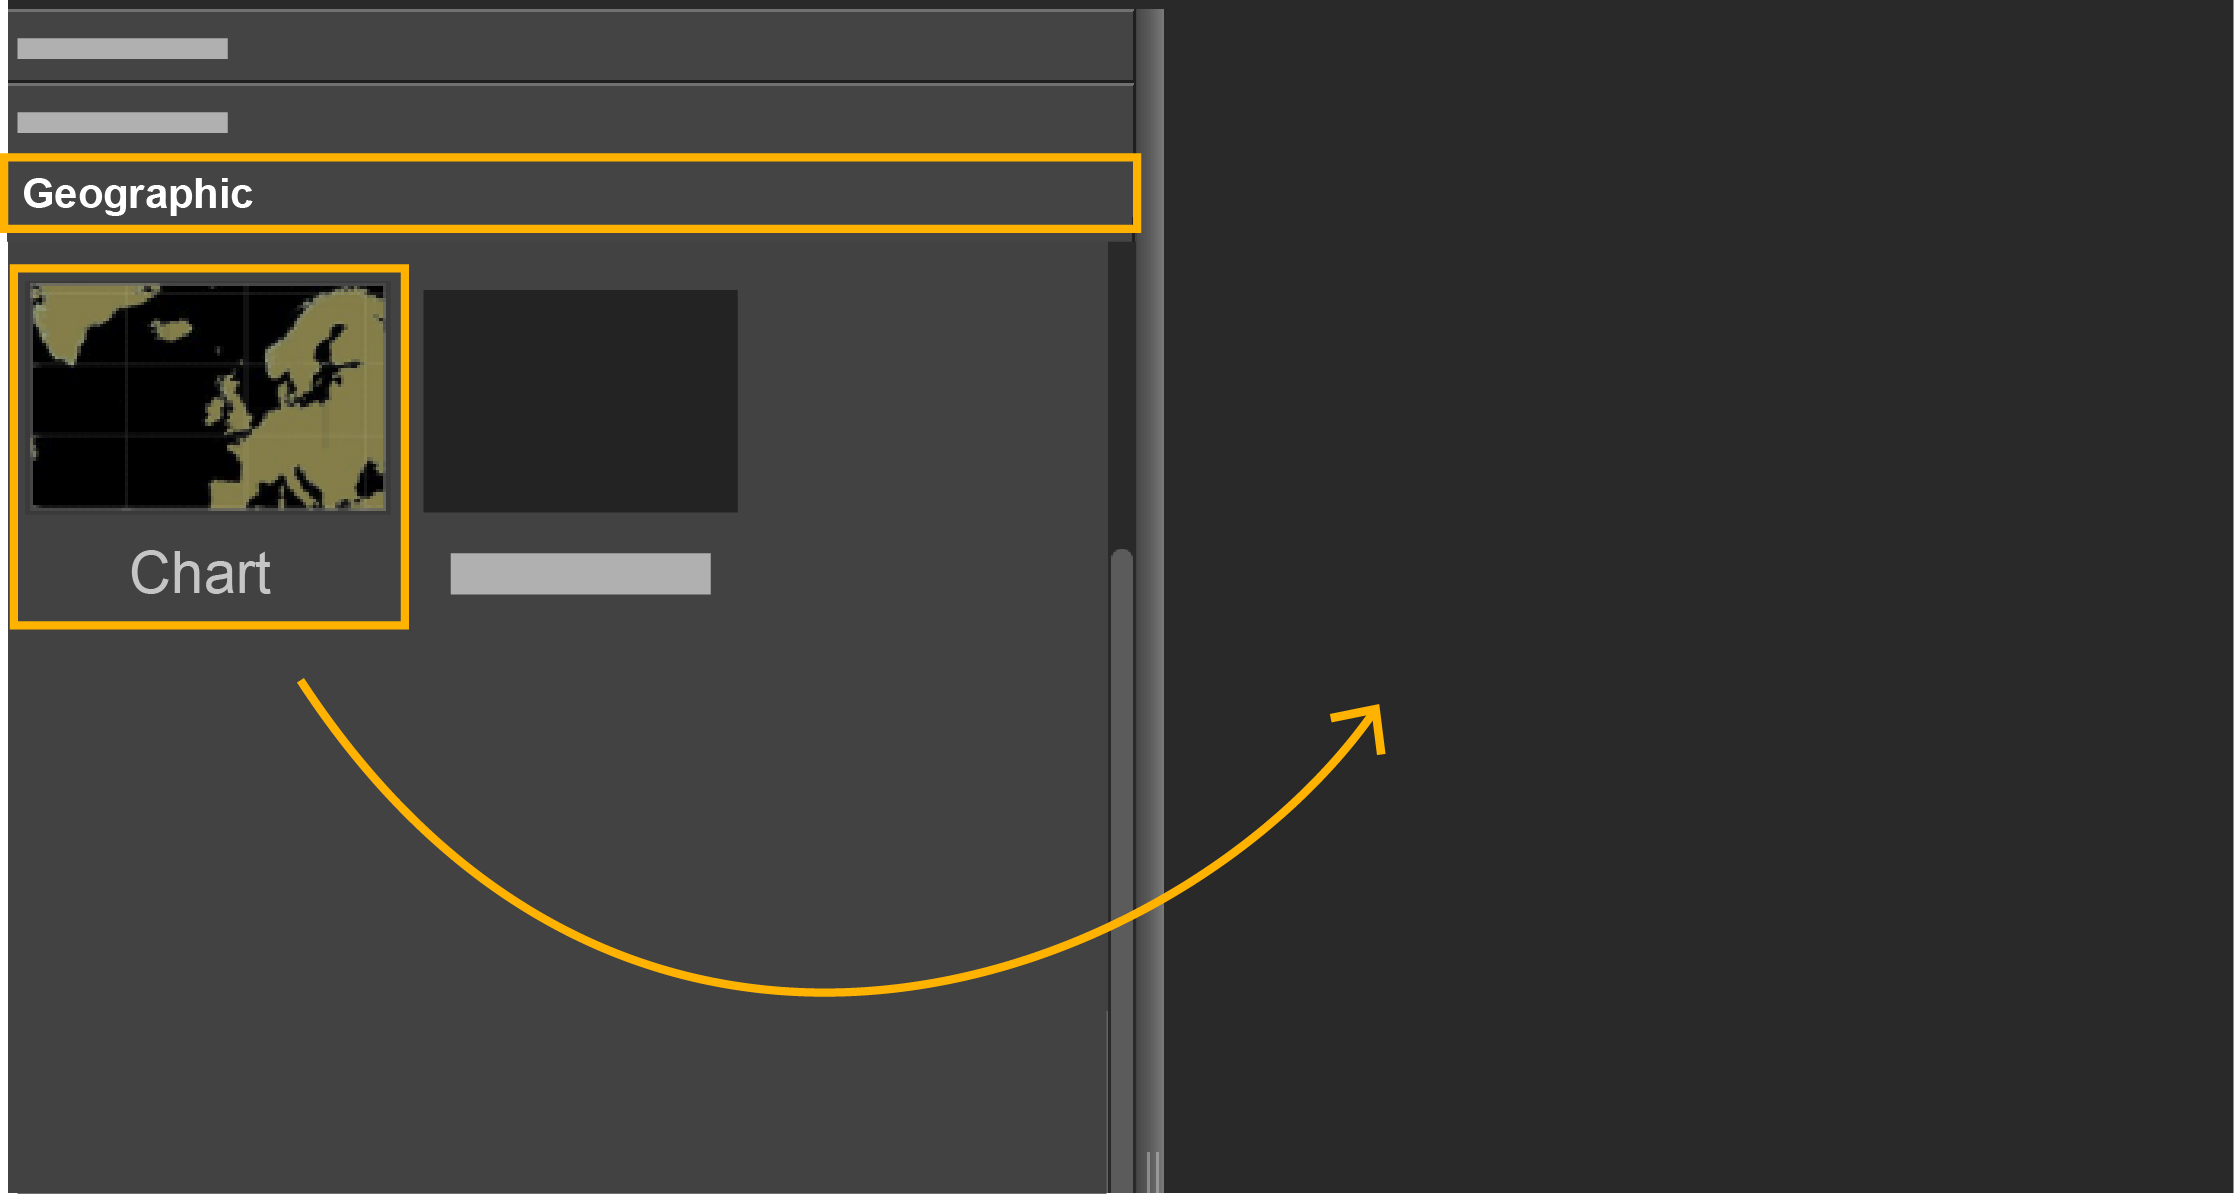
-
Drop it in a yellow area.
The chart view is displayed.
-
Click the arrow on the right side of the view to show the
display options.
View 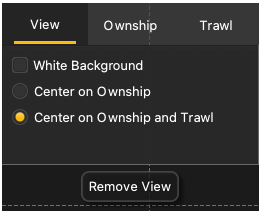
- White Background: change the chart background to white instead of black.
- Center on Ownship: center the view on the vessel only.
- Center on Ownship and
Trawl:
center the view on both vessel and trawl.Tip:If the view looks empty it might be because the view is not centered on the vessel. Select one of these last two options.
Ownship 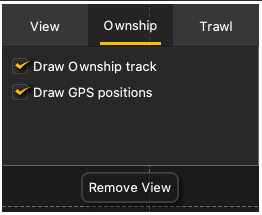
- Draw Ownship track: displays the path of the vessel, based on the GPS position.
- Draw GPS positions: displays points corresponding to the raw GPS positions.
Trawl 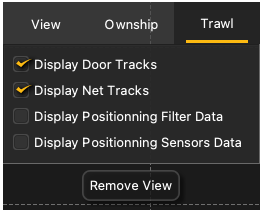
- Display Door Tracks: displays the path of the doors, according to the door positionning data. Green track is starboard door, red track is port.
- Display Net
Tracks:
displays the path of the headline, body or codend.
Tip:For a more accurate position of the headline, complete the trawl measurements in .
- Display Positionning Filter Data: used for development only.
- Display Positionning Sensors Data: displays raw data used to get the trawl position.
If the bathymetry feature is activated:
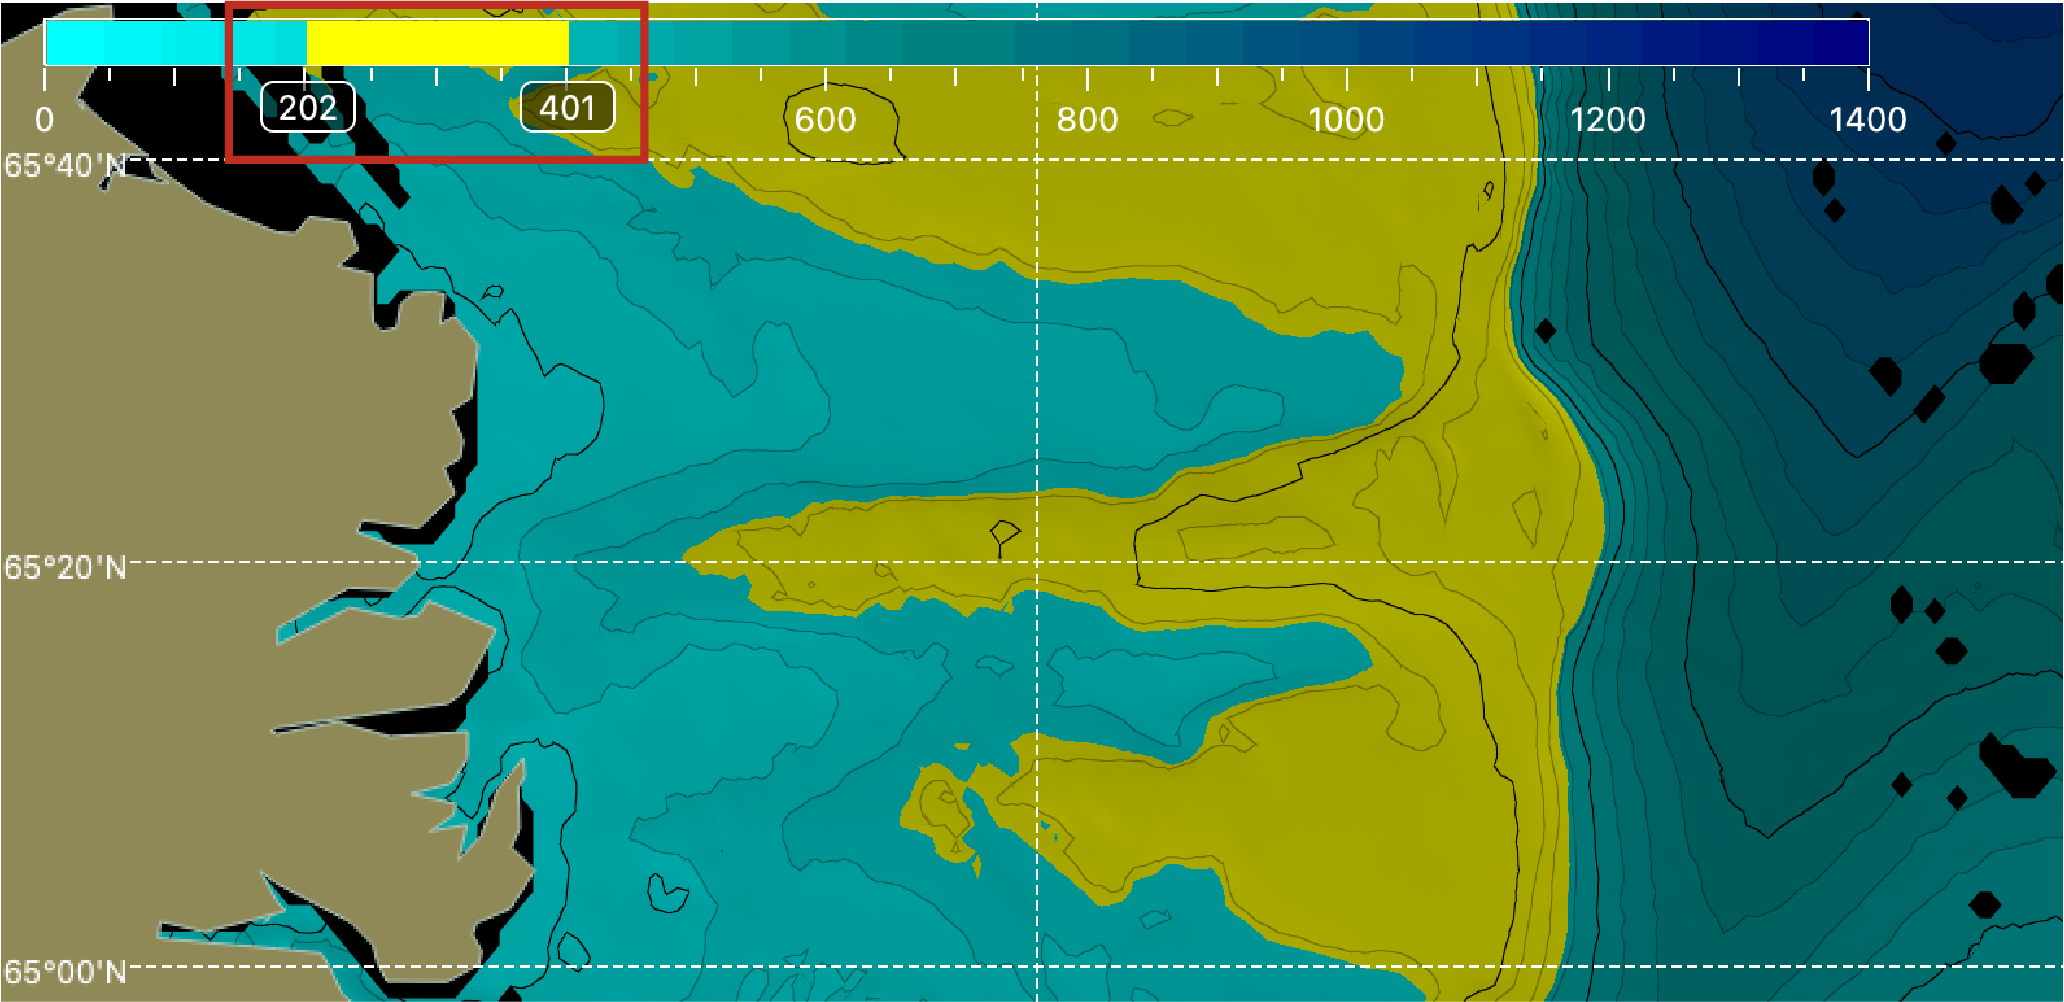
Note:The bathymetry feature is available as an option only.The water depth is shown using a color palette on the top left corner of the view. Use the two handles to color in yellow a specific depth zone.Bathy 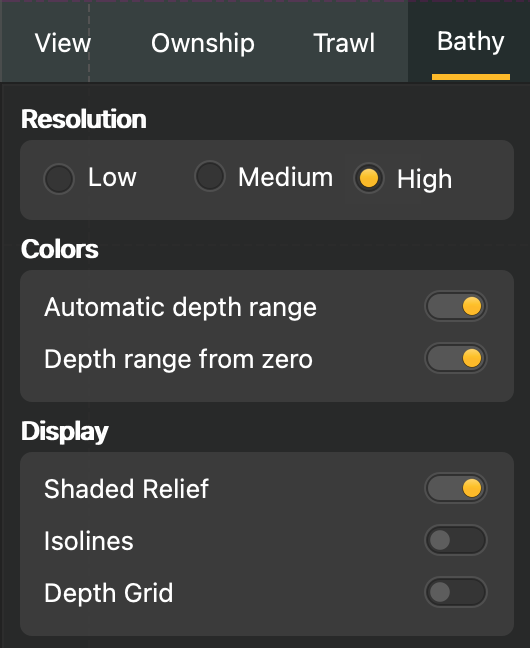
- Resolution: you can lower the resolution if the image is lagging.
- Colors:
- Automatic depth range: the range of the color scale adjusts according to the minimum and maximum water depth of the area displayed on the chart.
- Depth range from zero: if Automatic depth range is activated, the color scale adjusts according to the maximum water depth.
- Display: show on the chart Shaded Relief, Isolines or a Depth Grid (only appears when zoomed in closely).