Display Types
You can choose between different types of display in the customization panel or when you drag numerical data to a page.
| Dial | 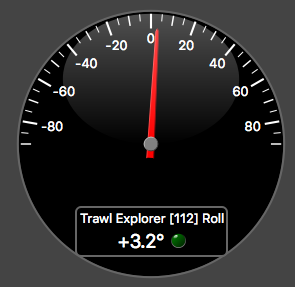 |
| Gauge | 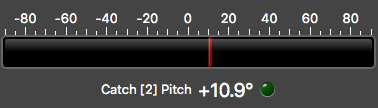 |
| History Plot | 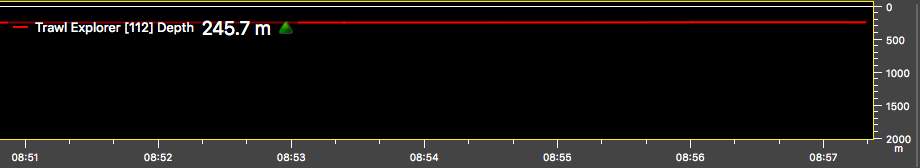 |
| Label | |
| Trend gauge | 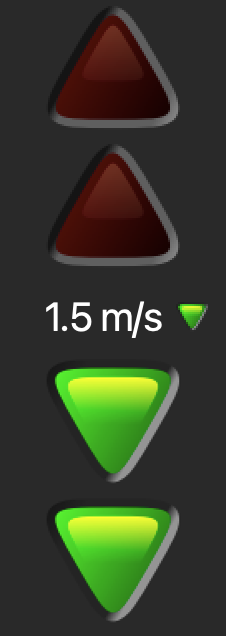 Indicates when the value of depth or
spread variation per second is increasing or decreasing.
Right-click the gauge to set the threshold at which the gauge lights on. |
There are also dials specific to certain types of data:
| Name | Types of data | Illustration | Display details |
|---|---|---|---|
| Horizon |
|
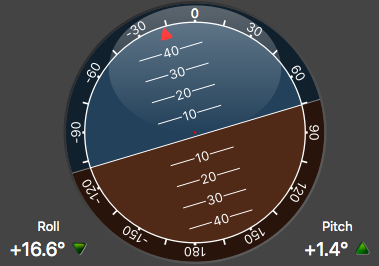 |
Displays horizon line according to pitch and
roll. Red dot in the middle indicates pitch angle and red arrow on top indicates roll angle. |
| Wind dial |
|
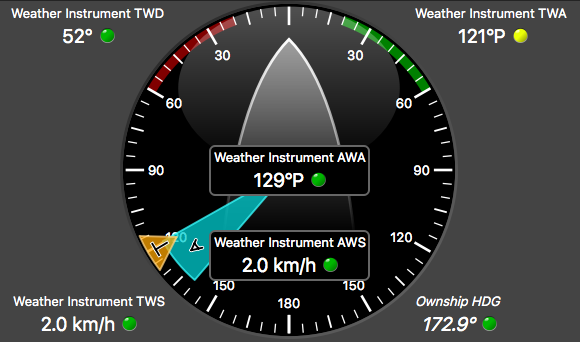 |
Vessel is displayed in the middle in grey. Apparent wind angle is displayed in blue and true wind angle in orange. |
| Heading dial |
|
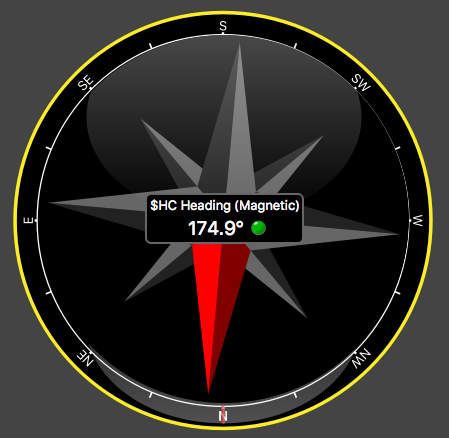 |
Red arrow displays North. Cardinal points are displayed around. |
| Trawl Speed Dial |
For trawl speed type sensors:
|
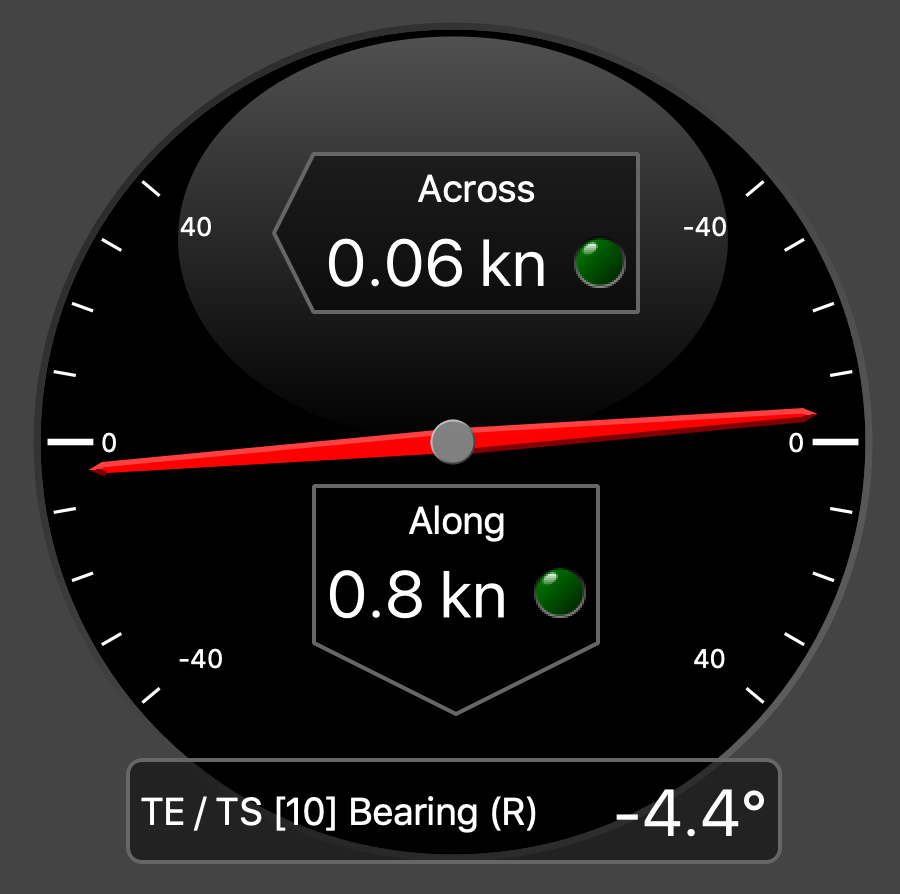 |
Bearing angle is negative when the sensor is oriented toward port and positive when oriented toward starboard. |
| Water Speed (WS) Dial |
For speed log type of device, data received from NMEA inputs:
|
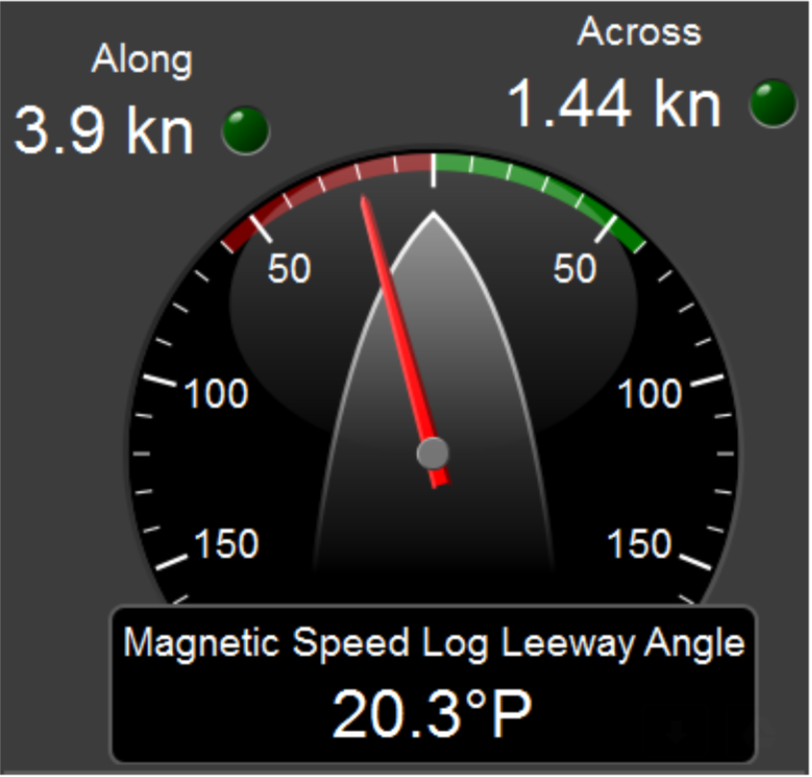 |
Leeway angle is displayed for port (P) or
starboard (S). Vessel is displayed in the middle in grey. |