Replaying Data on ScalaReplay2
You can replay on ScalaReplay2 data you have recorded.
Procedure
-
Click the Launchpad icon in the Dock. Then click the ScalaReplay2 icon.

ScalaReplay2 opens. -
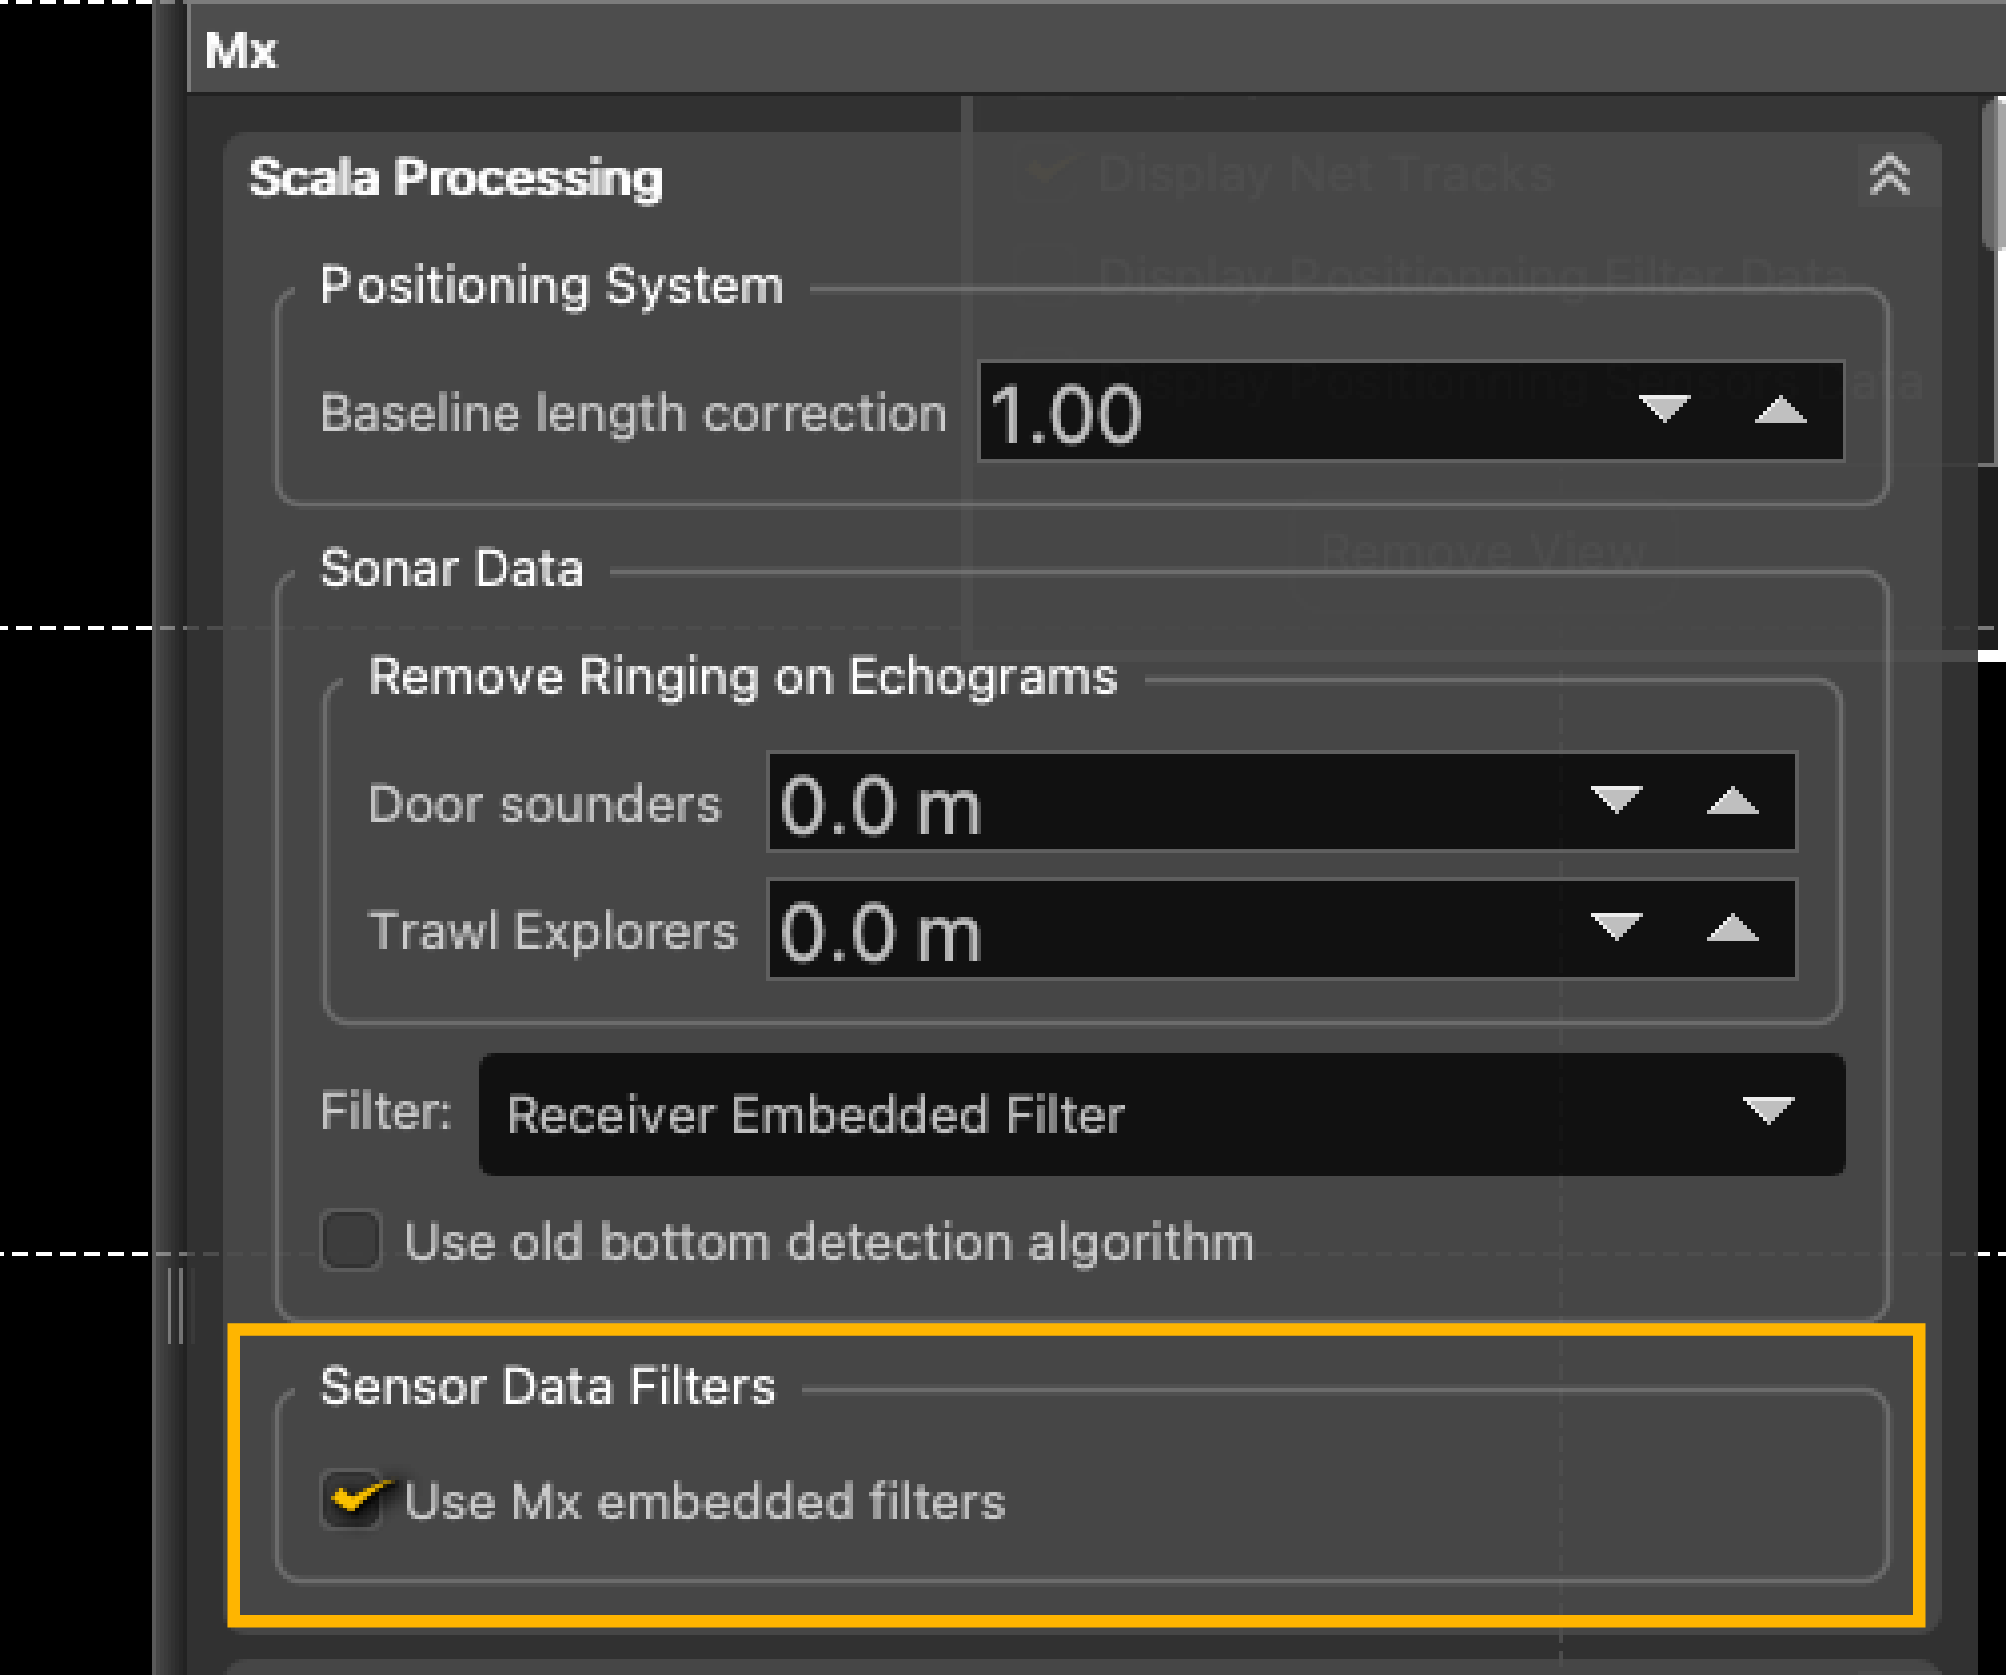
Open the control panels, then click and select Use Mx embedded
filters.
-
To choose the source directory, right-click the timeline and click Change Directory.
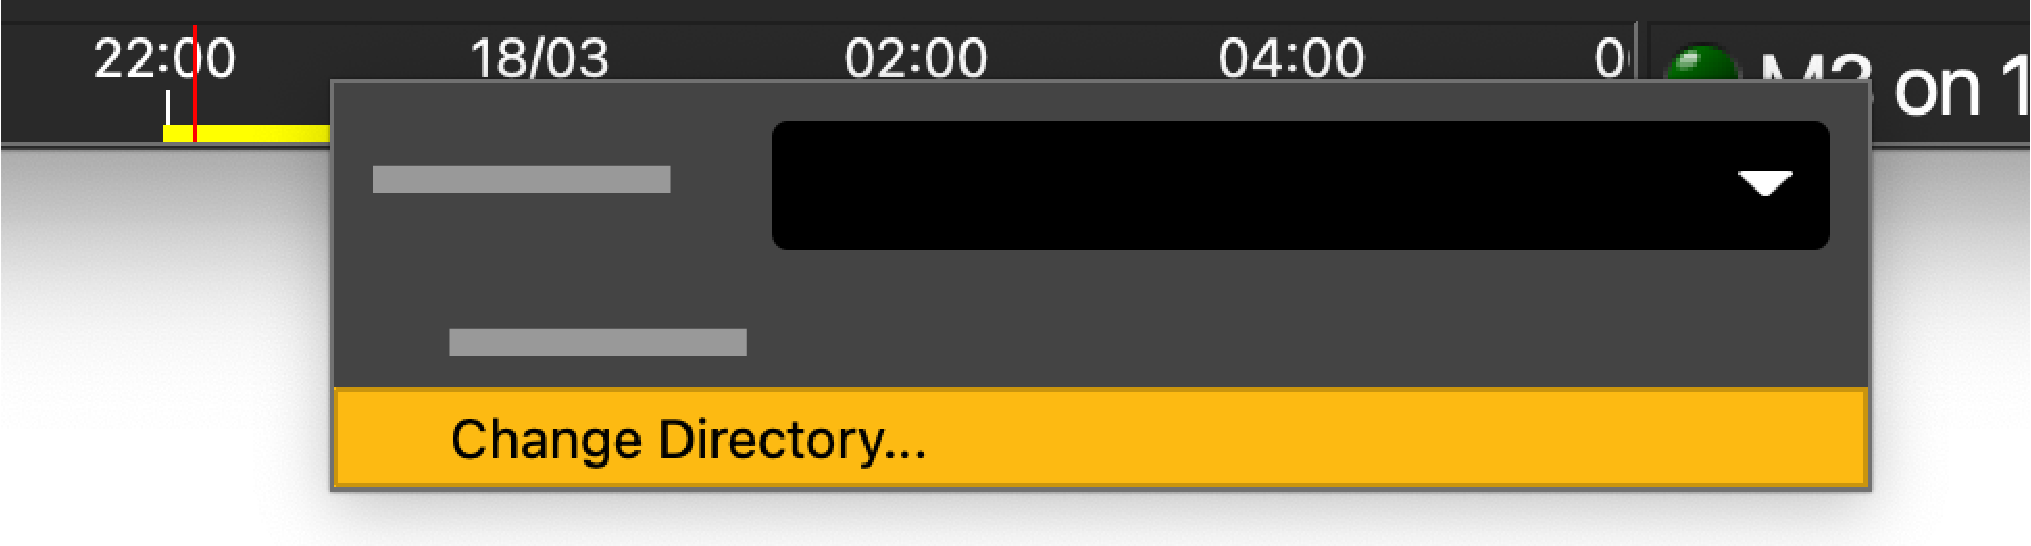
Note: By default, ScalaReplay2 reads files that are in Documents/Marport/SDSRecord.Data from the source folder is displayed at the bottom of the screen, in the timeline. Periods containing recorded data are in yellow and your position in the timeline is marked by a red line.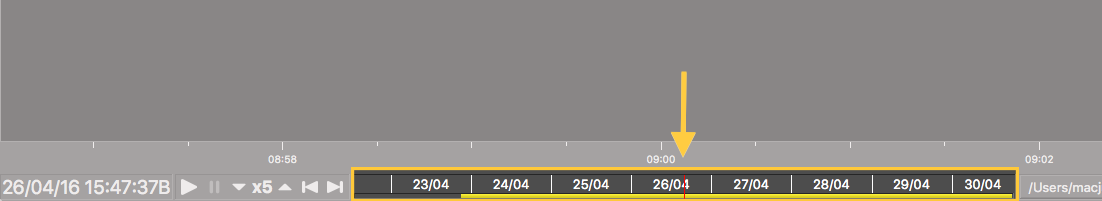
-
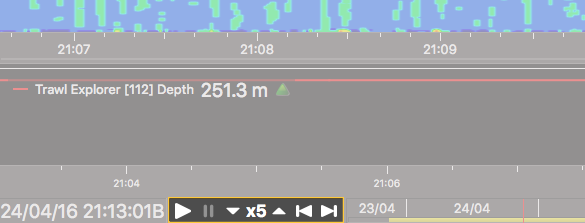
When the marker is on a period containing data and the replay is paused,
details about the vessel and system on which the data was recorded are displayed
above the replay bar.
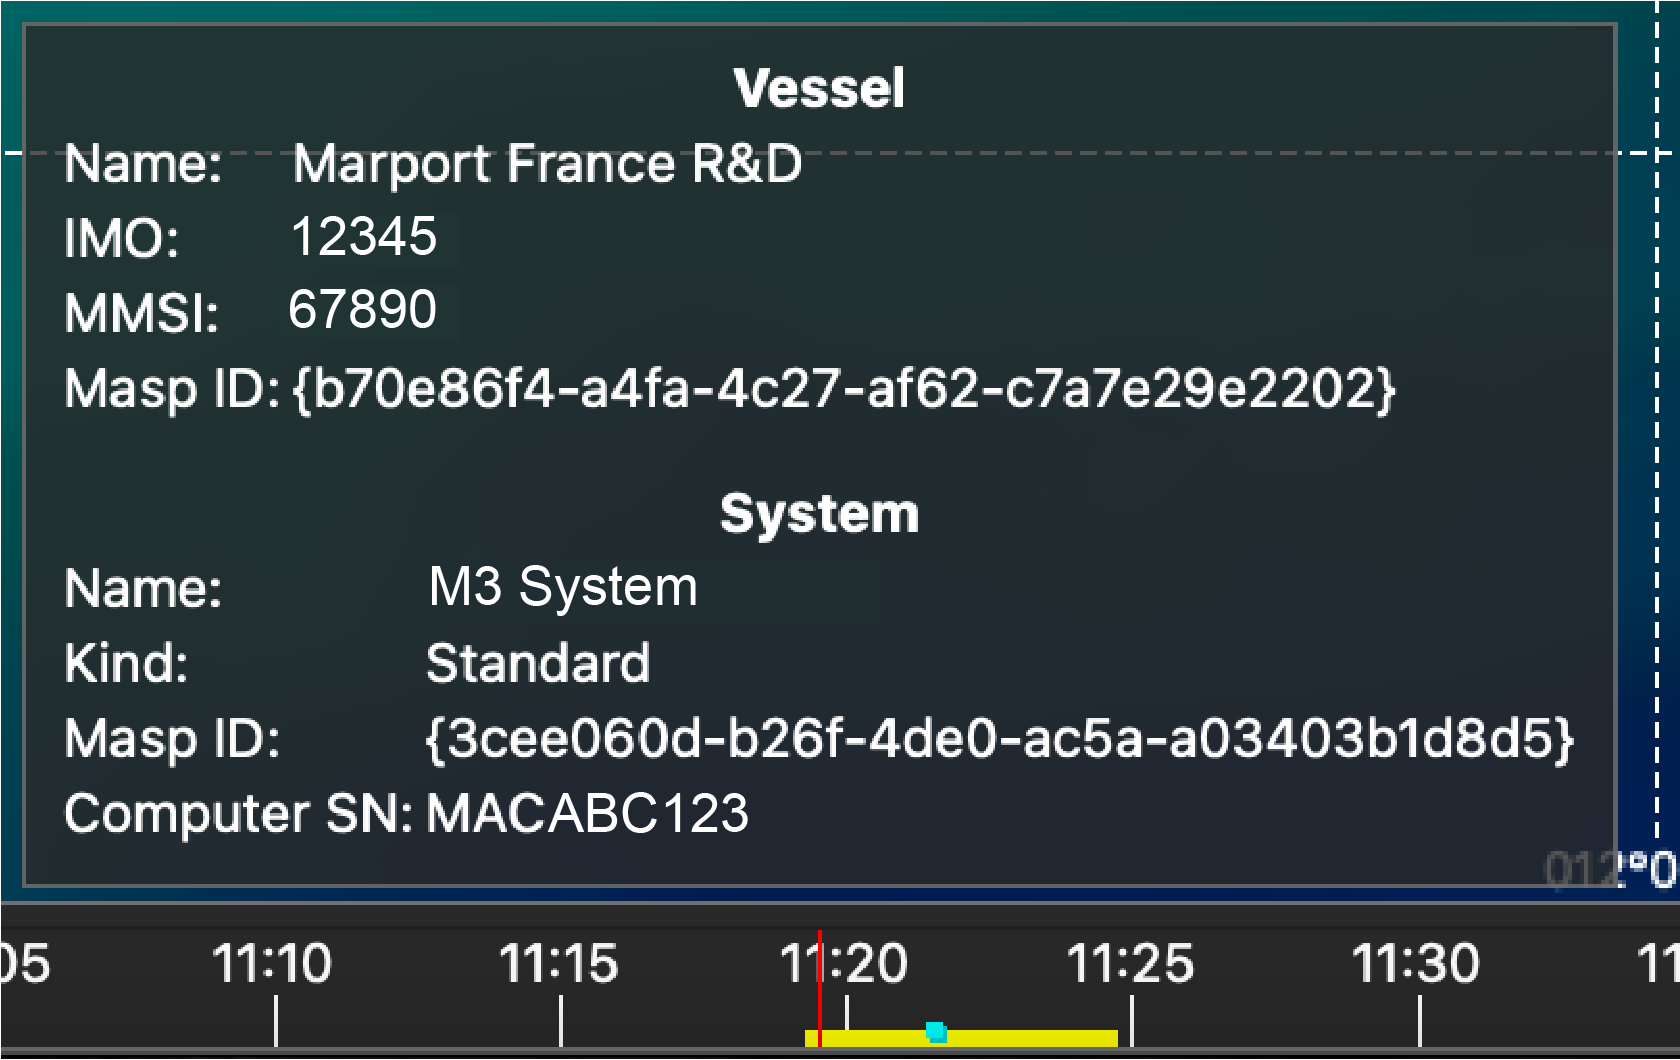
Note: In order to be displayed, these details must have been added in Marport Authorized Service Provider (MASP) and the SDS data must have been recorded with Scala2 version 02.14.x and after. -
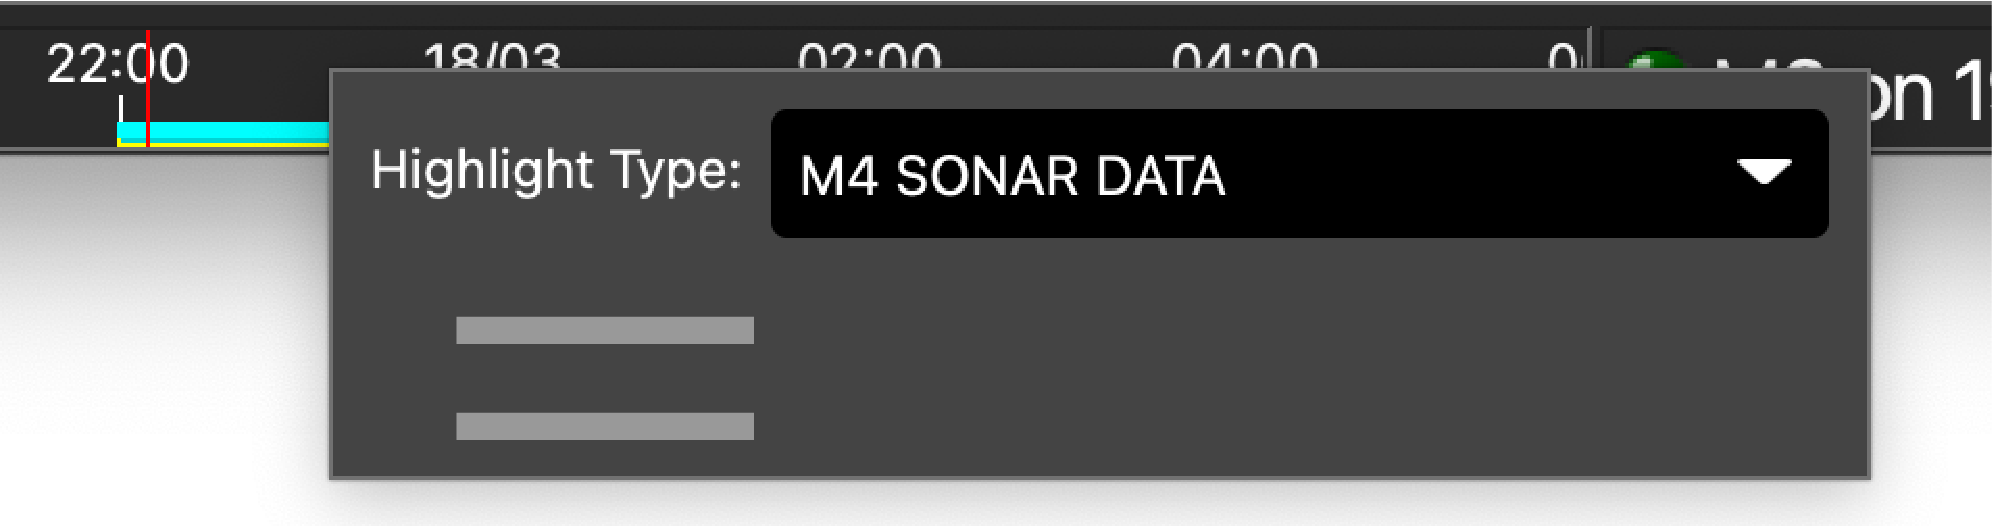
You can show on the timeline the moments when specific types of data were
received: right-click the timeline and select the data from the Highlight
type drop-down menu.
The moments appear highlighted above the yellow line.
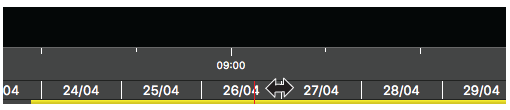
- To zoom in and out on the timeline, place your mouse on the timeline and scroll.
-
To move along the timeline, click + drag the timeline.
-
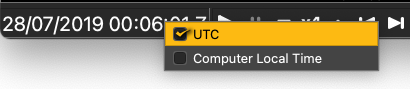
The date and time of the recording is displayed on the left side of the
timeline. Right-click the hour to change it to UTC timezone.
-
Control the playback using the play, pause and speed control buttons at the
left of the timeline.
Note: You can change the display of page data only when the playback is paused.
-
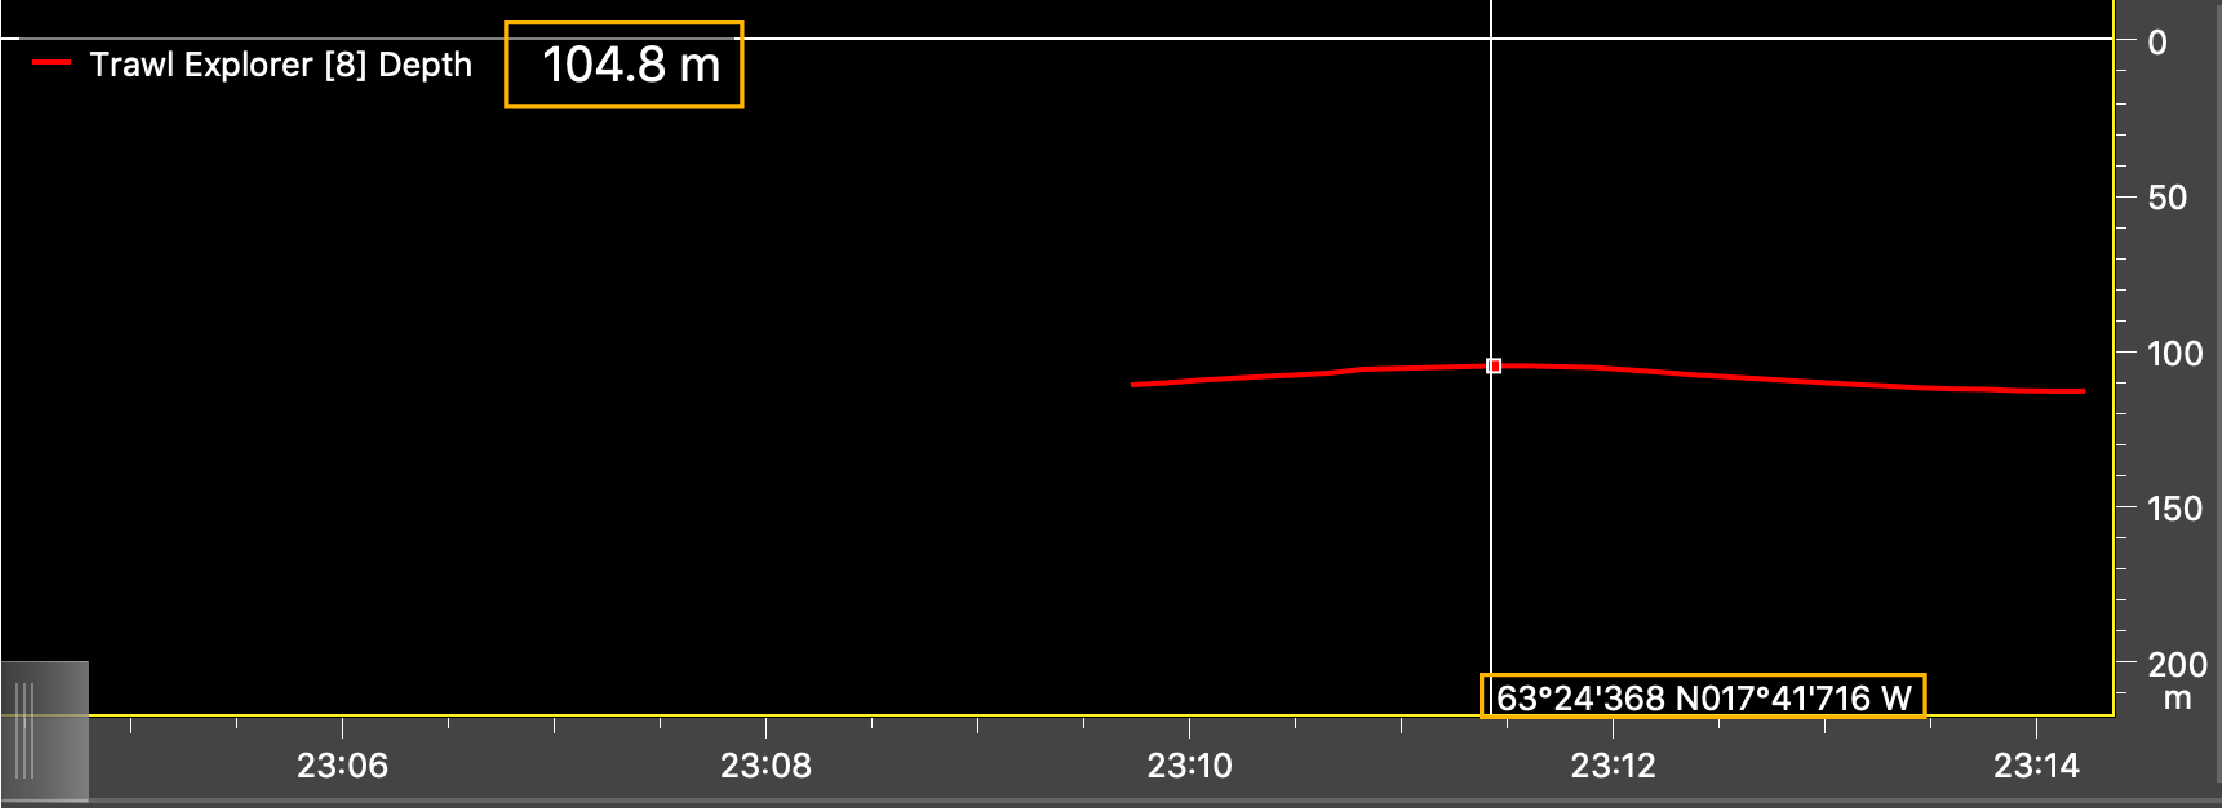
To display with a marker the global position and value of data in plots:
-
Click Menu
 > Settings > Advanced.
- Select Display global position cursor on plots and echograms.
-
Pause the replay, then hover the mouse cursor over plots to see the
global position and value of data, or over echograms to see the global
position.
-
Click Menu