About the Echogram Display
By default, Scala2 displays a real-time echogram. The progression of the echogram is based on time, so it can be time-synchronized with other real-time echograms or plots. This synchronization can for example help you to better follow a target by comparing the echograms. The global position cursor can also complete the information.
On the example below, Scala2 displays an echogram from a Speed Navigator placed on the headrope (top of the screen), and one from a Trawl Navigator placed approximately 30 meters back on the net (bottom of the screen).
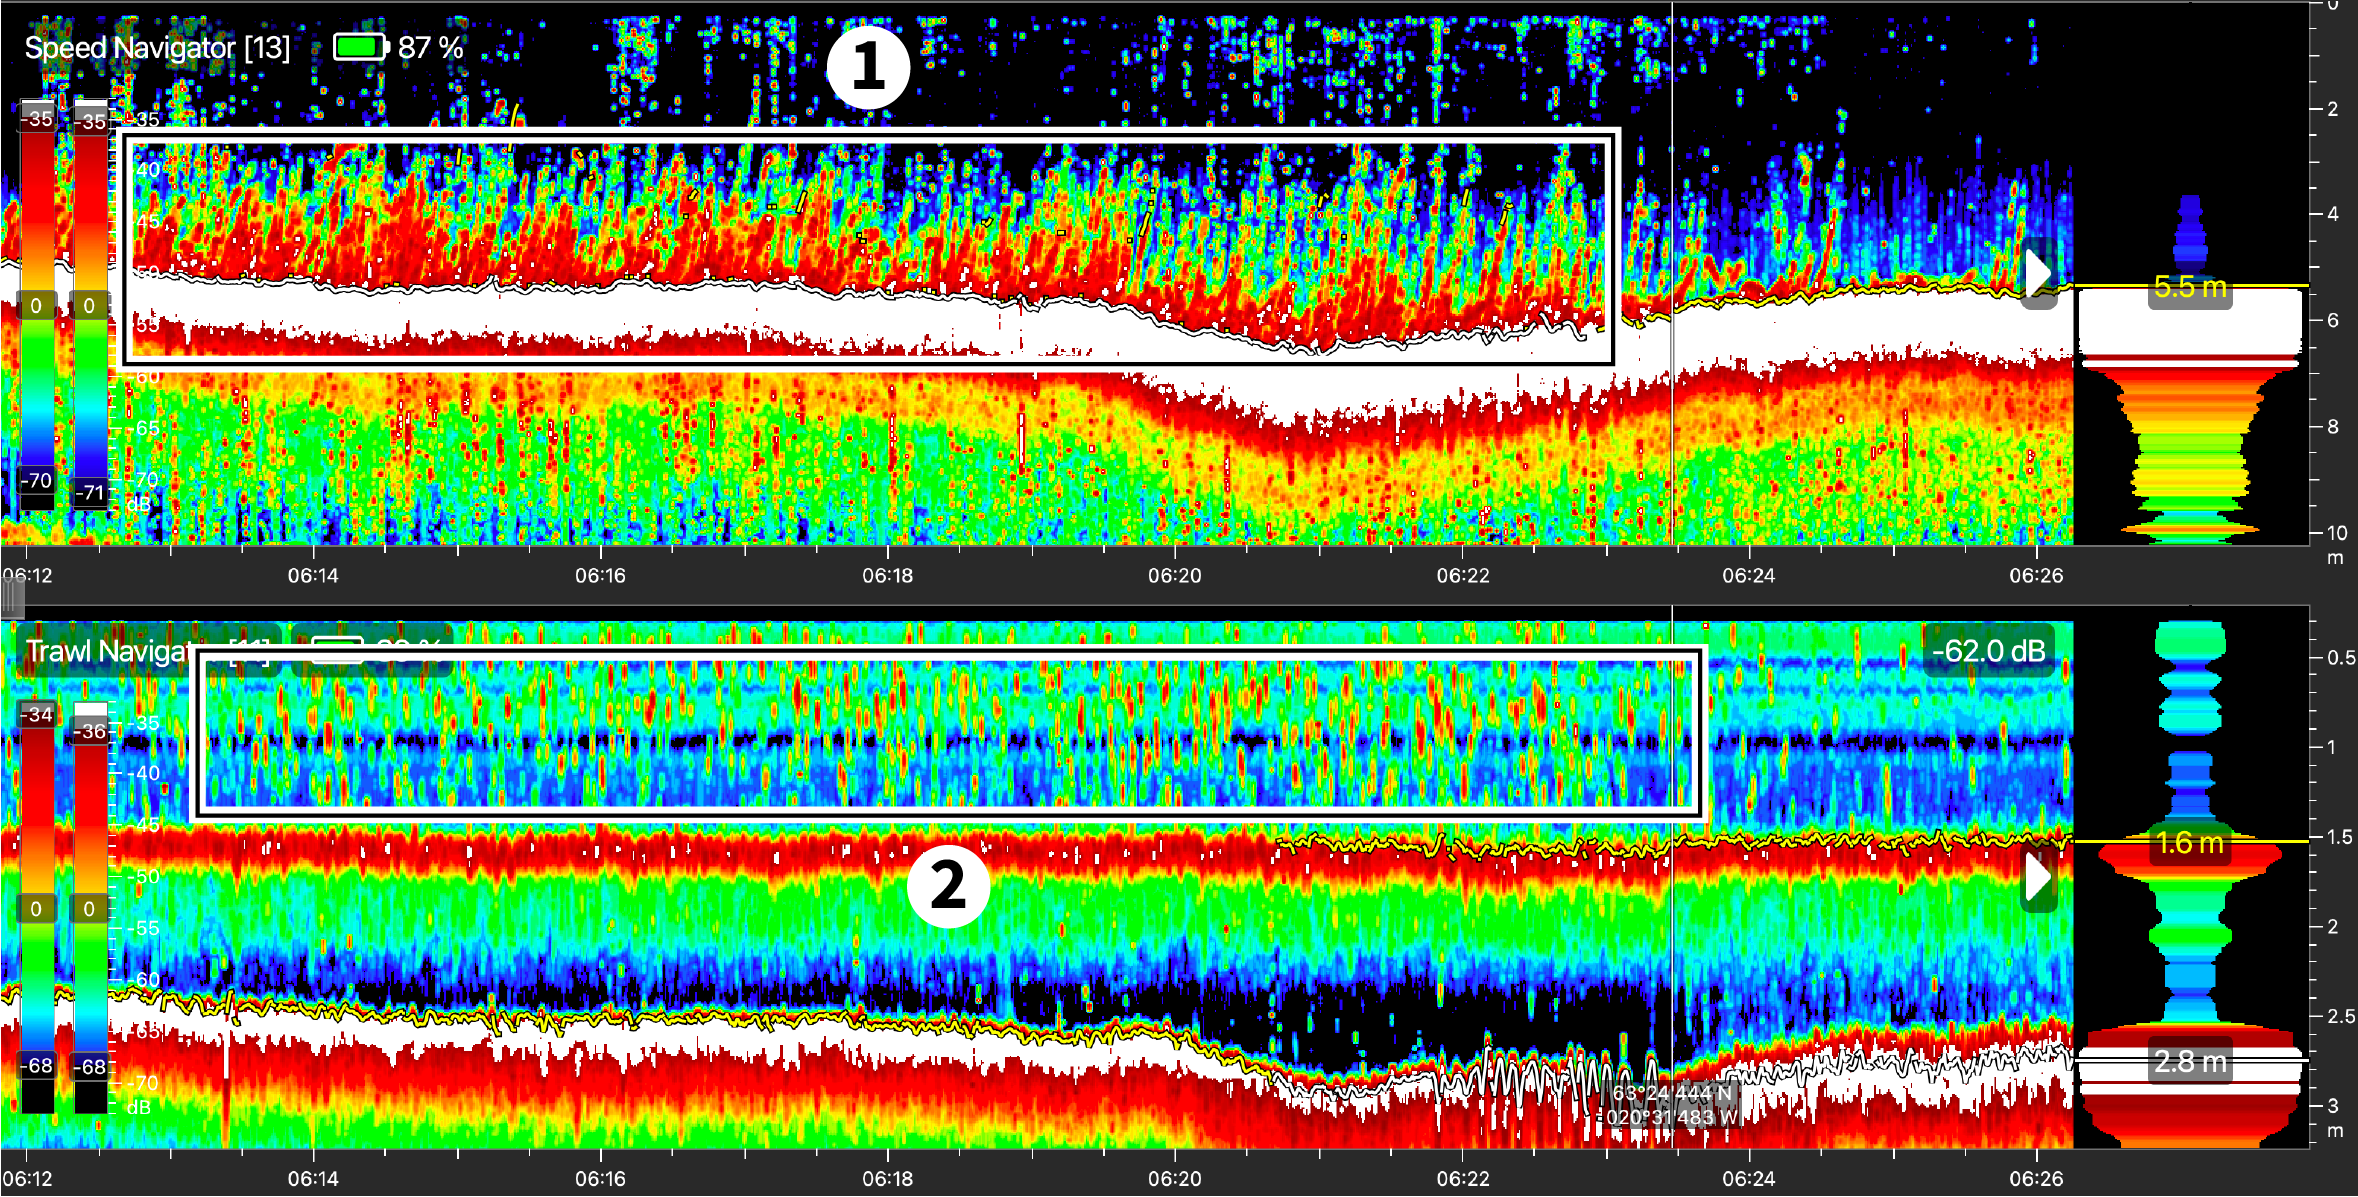
Fish are first detected close to the bottom by the Speed Navigator (1). Then, approximately 20 seconds later, the Trawl Navigator detects them inside the trawl (2). Because both echograms progress at the same speed, the time period between the targets seen on the echogram will always stay the same.
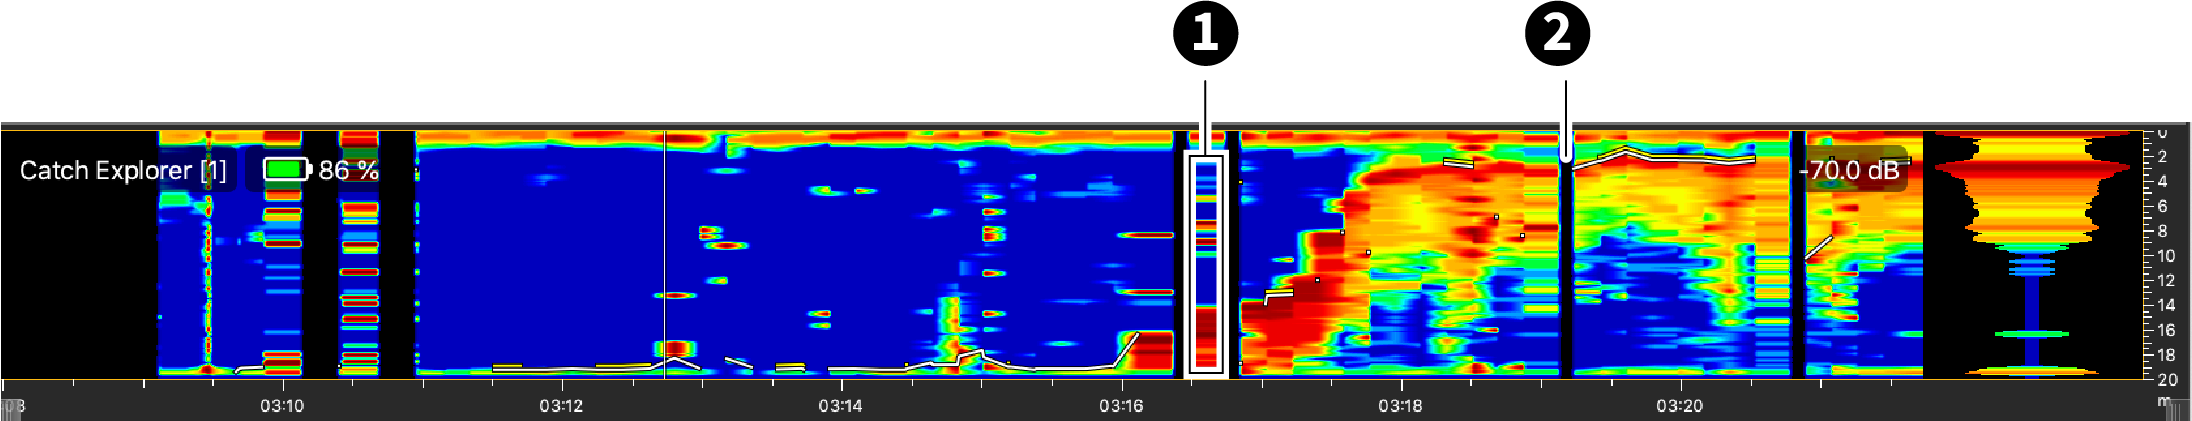 |
| 1. Repeated sonar data / 2. Loss of reception |
Scala2 also has a Fixed beam Width echogram. This type of echogram progresses only whenever sonar data is received. Because sonar data are usually not received at the same time by all the sensors, this echogram cannot be time-synchronized with other echograms and plots and it does not work well when displaying two signals simultaneously (for example up/down). The time progression is usually monitored using the yellow lines on top of the echogram, one yellow line corresponding to 1 minute. If the sonar data are not received correctly, the timescale and yellow lines will shrink.